Correction to: Clinical Epigenetics (2015) 7:2, https://doi.org/10.1186/s13148-014-0034-4
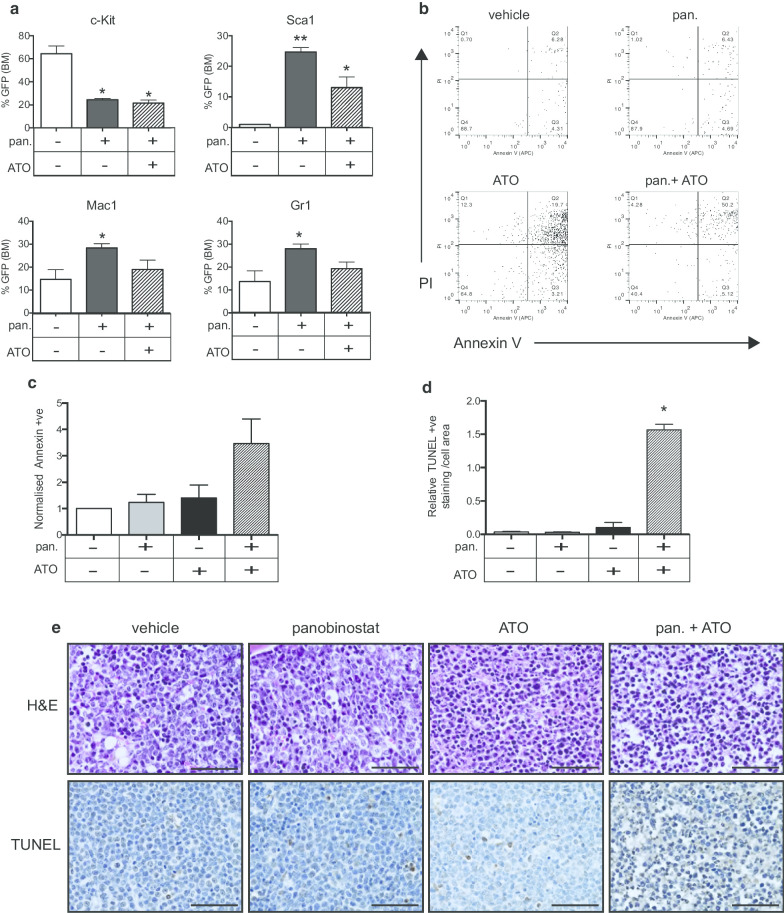
Following publication of the original article [1], the authors identified an error in Fig. 2e. The correct Fig. 2 is given below.
Fig. 2.
The combined effects of panobinostat and arsenic trioxide (ATO) include the differentiation of A/E9a;Nras G12D-leukemic blasts by panobinostat and induction of apoptosis by ATO. (A) Flow cytometry analysis of the cell surface expression of c-Kit; Sca1; Mac1 and Gr1 of GFP-positive tumor cells in the bone marrow of A/E9a;Nras G12D tumor-bearing mice treated for 5 days with either panobinostat (pan; 25 mg/kg) or panobinostat combined with ATO (2.5 mg/kg). (n = 3; data are expressed as mean plus SEM; *P <0.05, **P <0.001) (B) Representative dot plots of AnnexinV-PI staining of tumor cells isolated from the bone marrow of A/E9a; NrasG12D tumor-bearing mice treated for 4 hours with either panobinostat (25 mg/kg) or ATO (2.5 mg/kg) or a combination. Numbers given are the percentage of total cell population. (C) Normalized expression of AnnexinV on tumor cells treated with vehicle, panobinostat, ATO or a combination (n = 3; data are expressed as mean plus SEM). (D) Quantification of terminal deoxynucleotidyltransferase-mediated dUTP nick end labeling (TUNEL) positivity as a proportion of total cell area (n = 3; *P <0.001) (E) Representative images of hematoxylin-eosin staining (H&E; upper panels) and analysis of apoptotic cells by TUNEL staining and counterstained with hematoxylin (lower panels). Staining was performed on de-calcified femurs isolated from A/E9a;Nras G12D tumor-bearing mice treated for 4 hours as indicated. Imaging was performed using 60x objective (scale bars = 50 μm).
Footnotes
Publisher's Note
Springer Nature remains neutral with regard to jurisdictional claims in published maps and institutional affiliations.


