Abstract
Despite the clinical and genetic heterogeneity of autism, bulk gene expression studies show that changes in the neocortex of autism patients converge on common genes and pathways. However, direct assessment of specific cell types in the brain affected by autism has not been feasible until recently. We used single-nucleus RNA sequencing of cortical tissue from patients with autism to identify autism-associated transcriptomic changes in specific cell types. We found that synaptic signaling of upper-layer excitatory neurons and the molecular state of microglia are preferentially affected in autism. Moreover, our results show that dysregulation of specific groups of genes in cortico-cortical projection neurons correlates with clinical severity of autism. These findings suggest that molecular changes in upper-layer cortical circuits are linked to behavioral manifestations of autism.
Autism spectrum disorder (ASD) affects 1 of 59 children in the United States. Although bulk transcriptomic tissue studies revealed convergence of disease pathology on common pathways (1–3), the cell type-specific molecular pathology of ASD is unclear. We aimed to gain insight into cell type-specific transcriptomic changes by performing unbiased single-nucleus RNA sequencing (snRNA-seq) (4) of 41 postmortem tissue samples including prefrontal cortex (PFC) and anterior cingulate cortex (ACC) from 15 ASD patients and 16 controls (Fig. 1A and data S1). Samples in the control and ASD groups were between 4 and 22 years old and were matched for age, sex, RNA integrity number, and postmortem interval (fig. S1A; P > 0.1, Mann-Whitney U test). None of the ASD patients were diagnosed with intellectual disability; however, half of the ASD patients had a history of seizures, a common comorbidity in ASD. To compare changes in ASD to those in patients with sporadic epilepsy only, we generated additional snRNA-seq data from eight PFC samples from patients with sporadic epilepsy and seven age-matched controls (data S1).
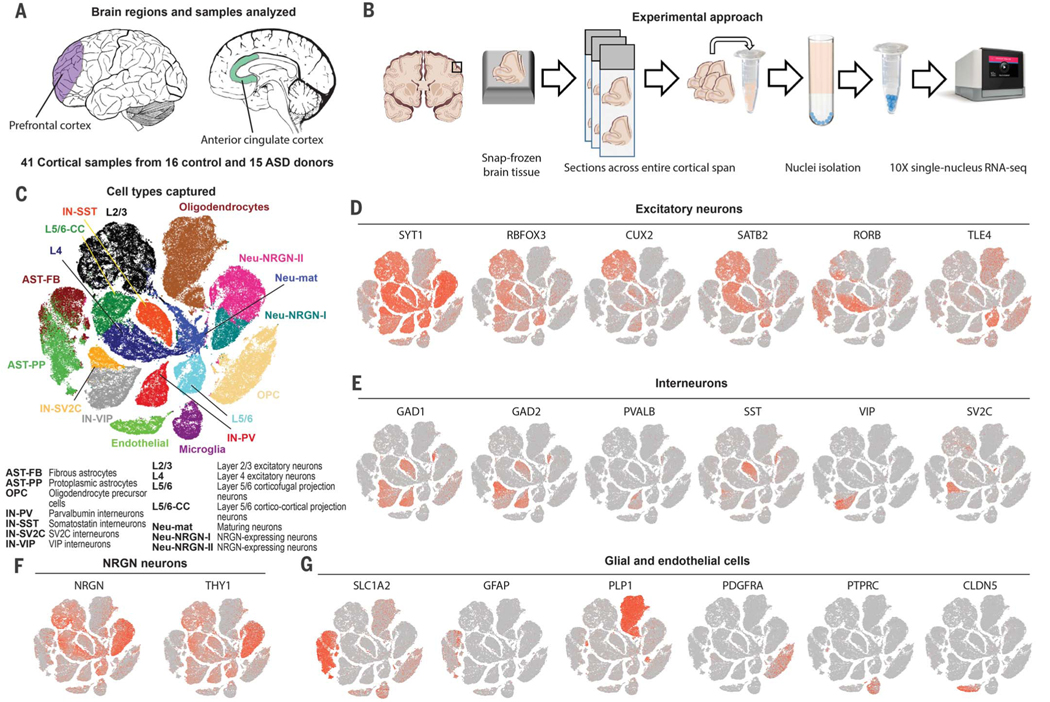
Fig. 1. Overview of the experimental approach and snRNA-seq dataset.
(A) Cortical regions analyzed with snRNA-seq including the PFC and ACC regions. (B) Experimental approach to snap-frozen tissue sample processing and nuclei isolation. (C) Unbiased clustering of snRNA-seq data. Cell types were annotated according to expression of known marker genes. (D) Expression of excitatory neuronal subtype markers. (E) Inhibitory neuronal subtype marker expression. (F) Markers of NRGN-expressing neurons. (G) Markers of glial cell types and endothelial cells.
We processed tissue samples for nuclei isolation and snRNA-seq using the 10× Genomics platform (Fig. 1B). We generated 104,559 single-nuclei gene expression profiles—52,556 from control subjects and 52,003 from ASD patients (data S2)—and detected a median of 1391 genes and 2213 transcripts per nucleus, a yield that is in agreement with a recent snRNA-seq study (5). Numbers of genes and transcripts were uniform between control and ASD samples (fig. S1B). Additionally, we generated 21,984 single-nucleus profiles sampled from patients with epilepsy and controls. The multiplet nuclei capture rate was comparable to single-cell RNA-seq analysis using the 10× platform (fig. S1C). The libraries were sequenced to 86% average saturation (fig. S1D and data S1).
We next performed unbiased clustering of nuclear profiles from ASD and control samples combining both cortical regions (Fig. 1C). Clustering was not driven by experimental batch or individual samples (fig. S1E). We annotated clusters according to expression of known cell type markers (data S3) and identified 17 cell types, including subtypes of excitatory neurons, interneurons (Fig. 1, D to F), and astrocytes (Fig. 1G). We observed that neurons expressed more genes and transcripts than glia (fig. S1F). Certain cell types, such as layer 4 excitatory neurons, were enriched in one of the two cortical regions (fig. S1G), and there were relatively more protoplasmic astrocytes in ASD samples (fig. S1, H and I, and fig. S2, A to C). Clustering was consistent when cells with high unique molecular identifier counts were removed (fig. S2, D and E) or when using Seurat to perform clustering (fig. S2, F and G). We used in situ RNA hybridization to validate the increased density of protoplasmic astrocytes and to confirm the expression of markers for neurogranin (NRGN)–expressing neurons and subtypes of astrocytes (fig. S3, A to D).
We tested whether our findings were representative of observations from bulk sequencing studies by performing whole-tissue RNA isolation and sequencing. Bulk gene expression changes in our ASD patient cohort correlated with relative changes from a published RNA-seq dataset (3) (fig. S3E). Our bulk RNA-seq analysis yielded a significant number of common differentially expressed genes (DEGs) (fig. S3F). We calculated whole-tissue nuclear RNA expression by aggregating all single-nucleus profiles in each sample. When nuclear RNA levels were correlated with mRNA levels across all samples, we observed a positive correlation for 93% of genes and a significant correlation for 37% of genes (Pearson r ≥ 0.31, P < 0.05) (fig. S3G).
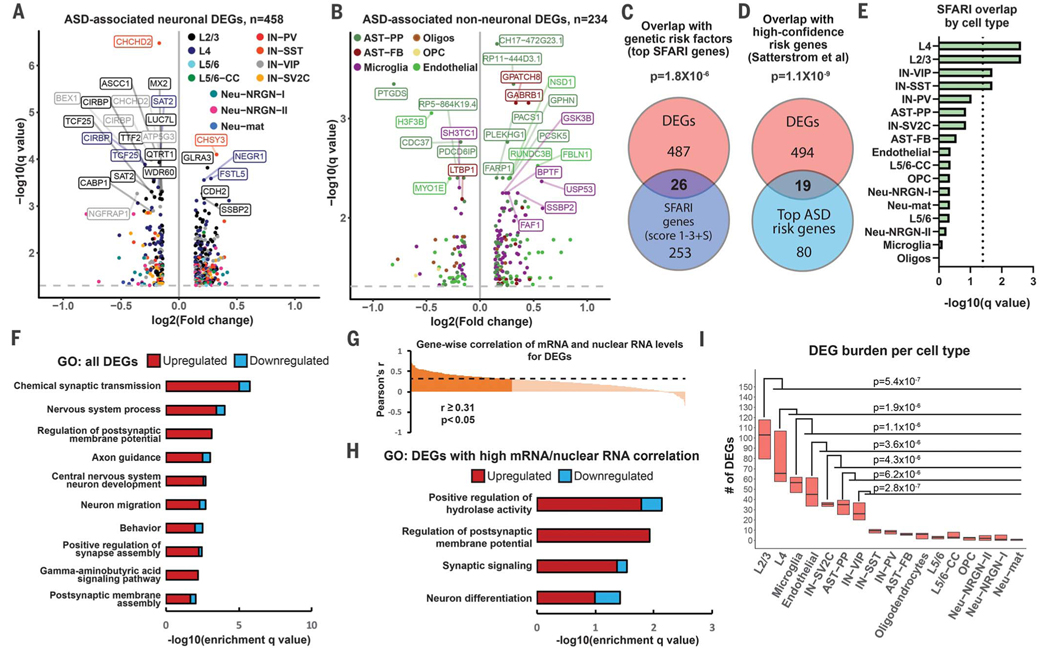
To identify genes dysregulated in ASD in a cell type–specific manner, we compared nuclear profiles from ASD and control subjects for each cell type using a linear mixed model (LMM) (see supplementary materials). We detected 692 differential expression events (q value < 0.05; expression level change ≥ 10%) in 513 unique DEGs, of which 79% (407 of 513) were differentially expressed in a single cell type (data S4). Gene expression changes were of smaller magnitude than expected from the bulk RNA-seq analysis, possibly because of dropout events. Only 17% of DEGs were among markers of specific cell types, suggesting cell type–specific dysregulation of ubiquitously expressed genes. The top differentially expressed neuronal genes were down-regulated in L2/3 excitatory neurons and vasoactive intestinal polypeptide (VIP)–expressing interneurons (Fig. 2A). The top genes differentially expressed in non-neuronal cell types were up-regulated in protoplasmic astrocytes and microglia (Fig. 2B). We analyzed the intersection between our gene list and the list of 851 genes that have evidence of genetic association with ASD from the SFARI database (6). Of 513 DEG genes, 75 (13%) were found in the SFARI database (P = 1.9 × 10⁻¹⁷, hypergeometric test) (fig. S3H), including 26 top SFARI genes (Fig. 2C). Additionally, we found significant overlap with high-confidence ASD-associated genetic risk factors (7, 8) (Fig. 2D and fig. S3I). SFARI genes were most overrepresented in L2/3 and L4 excitatory neurons, followed by VIP and somatostatin (SST)–expressing interneurons (Fig. 2E). Gene Ontology (GO) analysis demonstrated that chemical synaptic transmission, axon guidance, neuronal migration, and γ-aminobutyric acid (GABA) signaling were among the top dysregulated pathways (Fig. 2F). We observed enrichment in similar GO terms when only neuronal DEGs were used (fig. S4A), but no GO terms were identified for glial DEGs, suggesting convergence on the same cellular pathways in neuronal but not glial cell types. Similar pathways were enriched for DEGs with high nuclear RNA–mRNA correlation (Fig. 2, G and H), and DEGs common to several cell types were associated with the development of neuronal projections and adhesion (fig. S4B). By downsampling the data to compare the same number of nuclei across all cell types, we found that L2/3 excitatory neurons had the largest number of DEGs (Fig. 2I), followed by L4 excitatory neurons and microglia. The number of DEGs did not correlate significantly with the number of genes expressed in a given cell type (Pearson r = 0.27, P = 0.3). Thus, our results point to enrichment of ASD molecular changes in cellular components of upper-layer cortical circuits.
Fig. 2. Cell type–specific gene expression changes in ASD.
(A and B) Volcano plots for cell type–specific genes differentially expressed in neuronal (A) and non-neuronal cells (B). (C) Overlap between DEGs and top ASD genetic risk factors from the SFARI database (gene scores 1 to 3 and syndromic). (D) Overlap between cell type–specific DEGs and high-confidence ASD genetic risk factors based on whole-exome sequencing (35,584 ASD subjects). (E) Overlap between SFARI genes and DEGs; dotted line indicates statistical significance (q < 0.05). (F) Top biological pathways enriched for DEGs identified across all analyzed cell types. Bars represent numbers of up- and down-regulated genes in each GO term. (G) Correlation between mRNA and nuclear RNA for DEGs in the same tissue samples. (H) GO analysis for DEGs with significant mRNA–nuclear RNA correlation. (I) Burden analysis on downsampled data. P values were calculated by comparing numbers of DEGs between cell types (Mann-Whitney U test).
We then investigated specific gene expression changes in neuronal (Fig. 3A) and glial subtypes. Hierarchical clustering of cell types based on relative changes of gene expression between ASD and control samples (Fig. 3B) revealed that cell types clustered on the basis of developmental lineage. Among the top genes dysregulated in L2/3 and L4 neurons, we observed genes important for synaptic function, such as STX1A, SYN2, and NRXN1, as well as the transcription factors TCF25, SOX5, and RBFOX3, which are crucial for brain development (Fig. 3, C and D). TCF25 was also down-regulated in VIP interneurons, as was the transcription factor AHI1 and the synaptic gene RAB3A (fig. S4C). Microglia from ASD samples were enriched for genes associated with microglial activation and transcriptional factors regulating developmental processes (fig. S4D). We observed similar dysregulation of developmental transcription factors in protoplasmic astrocytes, as well as up-regulation of cell motility (fig. S4E). Deconvolution of bulk transcriptomic data from ASD patients (supplementary text) suggested that astrocytes in ASD are in an activated state and dysregulate genes necessary for amino acid transport (fig. S4, F and G). A number of genes were dysregulated in a region-dependent manner (fig. S4H and data S4) and were enriched in processes associated with neuron differentiation and cell migration (Fig. 3E). These included genes in L2/3 neurons, L4 neurons (Fig. 3, F and G), and interneurons (fig. S4I). Overall, our data point to dysregulated development and synaptic signaling in components of upper-layer cortical circuitry, as well as changes in the cellular state of microglia and protoplasmic astrocytes.
Fig. 3. Gene expression changes across specific cell types in ASD.
(A) Schematic of cortical neurons with known layer localization. Color boxes refer to cell types identified in Fig. 1C. (B) Hierarchical clustering based on log-transformed relative (fold) changes [versus control (CNTR)] of DEGs in each cell type. (C) Violin plots for top genes differentially expressed in L2/3 neurons in ASD. Genes dysregulated in sporadic epilepsy are indicated in orange. Fold changes (ASD versus control) are indicated under gene names. (D) Violin plots for top genes differentially expressed in L4 neurons in ASD. (E) GO analysis of genes differentially expressed specifically in PFC and ACC. (F and G) Examples of top region-specific DEGs dysregulated in L2/3 and L4 neurons. Asterisk denotes statistically significant (q < 0.05) change in gene expression between ASD and control in either the PFC or ACC.
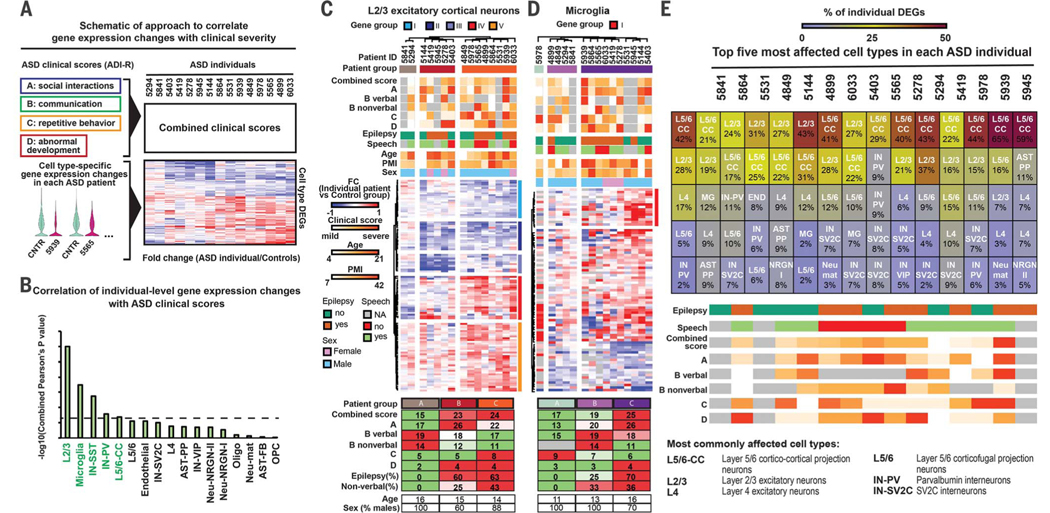
We next tested whether cell type–specific changes correlated with the clinical severity of ASD. We obtained Autism Diagnostic Interview–Revised (ADI-R) scores that measured impairment of behavioral domains in ASD (Fig. 4A). We correlated patient ADI-R scores with relative changes of DEGs and observed that changes in L2/3 neurons and microglia were the most predictive of clinical severity (Fig. 4B). We found that patients with different degrees of clinical severity clustered according to dysregulation of L2/3 neuron and microglia DEGs (Fig. 4, C and D). Genes most correlated with clinical severity (fig. S5, A and B) were not among the top ASD DEGs, which suggests that the degree of dysregulation is not an accurate predictor of correlation with clinical symptoms. We next compared single-cell profiles from individual ASD patients to control profiles across all clusters to identify cell types that are recurrently affected across multiple patients (Fig. 4E and fig. S5, C and D). These included upper (L2/3) and deep layer (L5/6-CC) cortico-cortical projection neurons, whereas corticofugal L5/6 projection neurons were not enriched in ASD DEGs. These results highlight the convergence of ASD-associated changes on cortico-cortical projection neurons across layers. Furthermore, whole-exome sequencing identified potentially deleterious genetic variants that correlated with reduced expression of corresponding genes (data S5), suggesting a potential link between genomic variations and transcriptional dysregulation in individual ASD patients.
Fig. 4. Correlation of cell type–specific gene dysregulation in ASD patients with clinical severity.
(A) Strategy for correlating individual-level DEGs and clinical severity. ADI-R subscores were ranked and combined. ASD cases were compared to the combined control profiles in each cell type to generate individual fold changes. (B) Cell types ranked by correlation of DEGs with combined clinical scores. Cell type DEGs in green were significantly (P < 0.05) correlated with clinical severity. (C and D) Hierarchical clustering of ASD patients based on individual fold changes in gene expression level in L2/3 neurons (C) and microglia (D). Average clinical scores, prevalence of epilepsy, proportion of nonverbal subjects, and age and gender composition are shown below the heat maps. (E) Analysis of cell types most enriched for transcriptional changes in individual ASD patients.
Because epilepsy is often a comorbidity of ASD, we analyzed shared and divergent molecular changes in ASD and sporadic epilepsy. We analyzed snRNA-seq data from PFC samples from eight epilepsy patients and seven matched controls (fig. S6, A to C). We found that epilepsy shared only 10% of all identified cell type–specific gene expression changes we observed in ASD, including 20% of the genes dysregulated in L2/3 neurons (fig. S6, D to F). GO analysis of DEGs detected in ASD, but not epilepsy, identified synaptic transmission, axon guidance, and brain development as enriched pathways (fig. S6G). Changes associated with epilepsy comorbidity in the ASD group were enriched in L5/6 corticofugal projection neurons and parvalbumin interneurons (fig. S6H). Therefore, the majority of molecular changes and core dysregulated pathways we identify in ASD samples are the result of primary ASD pathogenesis and not seizure activity.
Previous studies suggested convergence of ASD on specific cell types during fetal development (9, 10). We found that cell types with shared developmental lineages exhibit convergent transcriptional changes in adult ASD patients, and that the expression of synaptic and neurodevelopmental genes in layer 2/3 cortical neurons is especially affected. This implies that disturbances of gene regulatory programs during development cascade into molecular pathology in specific mature neural cell types.
Our results show that specific sets of genes in upper-layer projection neurons and microglia correlate with the clinical severity of ASD. By analyzing a cohort of patients with sporadic epilepsy, we were able to disentangle seizure-associated and primary ASD–associated gene expression changes. The ASD-specific genes highly correlated with clinical phenotypes represent high-priority therapeutic targets for ASD. Future studies involving larger patient cohorts, including whole-exome sequencing and improved single-cell technologies, will allow for more precise identification of ASD-driven molecular changes and their association with deleterious genetic variants. Our data describing transcriptomic changes across cortical cell types in ASD, highlighting the most implicated cell types, genes, and pathways, can be interrogated though an interactive web browser: https://autism.cells.ucsc.edu (11).
Supplementary Material
ACKNOWLEDGMENTS
We thank NIH NeuroBioBank, the University of Maryland School of Medicine Brain and Tissue Bank, and especially A. LeFevre and O. Spicer for help with obtaining tissue samples and sample information. We thank S. Sanders, N. Parikshak, E. Eichler, and M. State for insightful comments on the manuscript.
Funding: Supported by Simons Foundation Pilot award 515488 and NIMH award 1U01MH114825-01 (A.R.K.); Quantitative Biosciences Institute’s BOLD & BASIC Fellowship (D.V.); postdoctoral fellowships from the Deutsche Forschungsgemeinschaft (DFG) (SCHI 1330/1-1) and the National Multiple Sclerosis Society Dave Tomlinson Research Fund (FG-1607-25111) (L.S.); a Gruss Lipper postdoctoral fellowship (Y.P.); postdoctoral fellowships from the European Molecular Biology Organization (ALTF_393-2015) and DFG (MA 7374/1-1) (S.M.); NINDS award P01NS08351 and the Wellcome Trust (D.H.R.); and NIH postdoctoral fellowship F32NS103266 (A.B.).
Footnotes
Competing interests: Authors declare no competing interests.
Data and materials availability: All data are available in the supplement; raw data are available through the Sequence Read Archive, accession number PRJNA434002. Analyzed data and visualization are available at https://autism.cells.ucsc.edu.
REFERENCES AND NOTES
- 1.Voineagu I. et al. , Nature 474, 380–384 (2011). [DOI] [PMC free article] [PubMed] [Google Scholar]
- 2.Parikshak NN et al. , Nature 540, 423–427 (2016). [DOI] [PMC free article] [PubMed] [Google Scholar]
- 3.Gupta S. et al. , Nat. Commun 5, 5748 (2014). [DOI] [PMC free article] [PubMed] [Google Scholar]
- 4.Lake BB et al. , Science 352, 1586–1590 (2016). [DOI] [PMC free article] [PubMed] [Google Scholar]
- 5.Lake BB et al. , Nat. Biotechnol 36, 70–80 (2018). [DOI] [PMC free article] [PubMed] [Google Scholar]
- 6.Abrahams BS et al. , Mol. Autism 4, 36 (2013). [DOI] [PMC free article] [PubMed] [Google Scholar]
- 7.Sanders SJ et al. , Neuron 87, 1215–1233 (2015). [DOI] [PMC free article] [PubMed] [Google Scholar]
- 8.Satterstrom FK et al. , bioRxiv 484113 [preprint]. 1 December 2018. [Google Scholar]
- 9.Parikshak NN et al. , Cell 155, 1008–1021 (2013). [DOI] [PMC free article] [PubMed] [Google Scholar]
- 10.Willsey AJ et al. , Cell 155, 997–1007 (2013). [DOI] [PMC free article] [PubMed] [Google Scholar]
- 11.Nowakowski TJ et al. , Science 358, 1318–1323 (2017). [DOI] [PMC free article] [PubMed] [Google Scholar]
Associated Data
This section collects any data citations, data availability statements, or supplementary materials included in this article.


