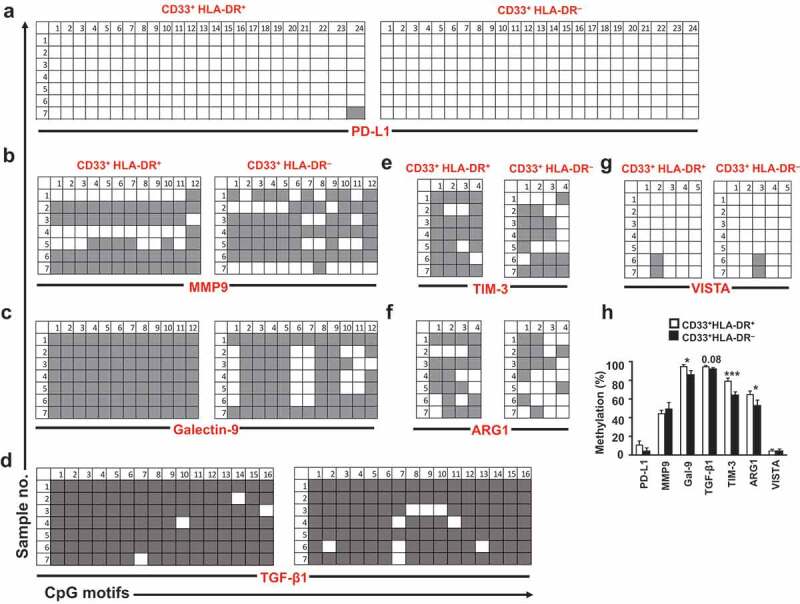
Figure 3.

DNA methylation status of different genes in circulating CD33+HLA-DR– cells and antigen-presenting cells
Representative plots show the DNA methylation status in PD-L1 (a), MMP9 (b), galectin-9 (denoted as Gal-9) (c), TGF-β1 (d), TIM-3 (e), ARG1 (f) and VISTA (g) in the sorted CD33+HLA-DR+ and CD33+HLA-DR– cells as analysed by bisulphite sequencing of the gDNA. Methylation status of individual CpG motifs is shown in a colour-coded manner: white indicates unmethylation and grey indicates methylation. Bar plot shows the overall average methylation percentage of all genes investigated (h). Results obtained from 10 donors and expressed as mean ± SEM.
