Abstract
Purpose:
The sphingosine-1-phosphate receptor 1 (S1PR1) is an important biomarker for imaging inflammation in the central nervous system (CNS). Herein we report our recent evaluation of four 18F-labeled S1PR1 tracers (18F-TZ43113, 18F-TZ35104, 18F-TZ4877, and 18F-TZ4881) in a rat model of multiple sclerosis (MS).
Procedures:
MicroPET studies of each tracer’s uptake and kinetics were performed in the experimental autoimmune encephalomyelitis (EAE) rat model of MS to quantify upregulated S1PR1 expression in the lumbar spinal cord of EAE rats. Western blot analysis was conducted to confirm the differences in the expression of S1PR1 protein level in EAE and sham rats. Radiometabolite analysis was performed for the most promising candidate in rats.
Results:
All four S1PR1 tracers detected increased S1PR1 levels in response to neuroinflammation in the lumbar spinal cord of EAE rats, which was supported by western blot results. The ranked order of tracer uptake in rat spinal cord was 18F-TZ4877>18F-TZ4881>18F-TZ35104>18F-TZ43113. 18F-TZ4877 had the highest uptake of the four tracers and showed good kinetic modeling fits in rat spinal cord using an image-based method of arterial blood input function. Radiometabolite analysis of 18F-TZ4877 showed good in vivo stability with no major radiometabolite accumulation in the brain.
Conclusion:
Among these four new PET tracers, 18F-TZ4877 showed the most favorable profile for assessing S1PR1 expression in the EAE rat model of MS. Further characterization of these radiotracers in other models of neuroinflammation is warranted to identify a promising 18F-labeled tracer for imaging S1PR1 in vivo.
Keywords: Sphingosine-1-phosphate receptor 1, PET radioligands, neuroinflammation, F-18
Introduction
Sphingosine 1-phosphate (S1P) is a membrane-derived bioactive lysophospholipid which plays critical regulatory roles in inflammatory diseases in multiple organ systems through modulating its five S1P receptor subtypes 1–5 (S1PR1–5) [1, 2]. Among the five S1PR1 subtypes, S1PR1 is the most abundant; it is highly expressed in inflammatory cells and activated glial cells [3, 4]. Dysregulation of S1PR1 signaling plays a key pathophysiological role in inflammatory diseases of the central nervous system (CNS) [5, 6, 7]. The nonselective S1P modulator, fingolimod is the first approved oral therapeutic drug for treating relapsing MS. It is phosphorylated in vivo where it binds all S1P receptor subtypes except S1PR2. Fingolimod prevents lymphocyte egress from lymphoid tissues into the circulation and CNS, and also reduces brain volume loss, lesion numbers and disease severity in patients with multiple sclerosis (MS) [8, 9, 10]. The mechanism of action for fingolimod’s anti-inflammatory and neuroprotective effects are associated with modulation of microglial activation [11, 12].
Positron emission tomography (PET) is a highly sensitive, noninvasive tool that can directly quantify alterations of target proteins in living subjects and can be used for both diagnosis and imaging response to therapy. We previously reported increased uptake of the S1PR1 specific radiotracer 11C-CS1P1, also called 11C-TZ3321 at sites of neuroinflammation in three rodent models of inflammatory diseases; increase uptake of 11C-CS1P1 corresponded with increased S1PR1 expression in inflamed tissues [13, 14, 15]. Our exploratory investigational new drug application (exploratory IND) for use of 11C-CS1P1 in human subjects was recently approved by United States Food and Drug Administration (FDA), the first in man study is ongoing. Because the longer half-life of 18F-fluorine (T1/2 = 109.8 min) permits longer imaging sessions for higher target-to-reference ratios and places fewer time constraints on tracer production and distribution, we have our continued efforts to identify 18F-labeled S1PR1 ligands. The S1PR1 tracer 18F-TZ35110 had increased liver uptake in a mouse model of lipopolysaccharide (LPS) induced inflammation and specifically bound to S1PR1 in the liver, but had low brain uptake [16]. Structural optimization of 18F-TZ35110 identified several 18F-labeled S1PR1 ligands (18F-TZ43113, 18F-TZ35104, 18F-TZ4877, and 18F-TZ4881) with improved brain uptake in preliminary studies of normal animals [17, 18]. Herein, we report the in vivo characterization of S1PR1 tracers in the rat EAE model of MS, and radiometabolite studies of the tracer 18F-TZ4877 in rats.
Materials and Methods
Radiochemistry
18F-labeling and synthesis of standards and precursors of the previously reported S1PR1 ligands (Table 1), TZ43113 (IC50 = 9.7 nM) [17, 18], TZ35104 (IC50 = 6.7 nM), TZ4877 (IC50 = 14.1 nM), and TZ4881 (IC50 = 15.4 nM) [18], followed previously published procedures. Quality control analysis was performed on final radiolabeled products for animal studies. In brief, an aliquot (200 μL) of each tracer was authenticated by co-injection with non-radiolabeled standard compound on an analytical HPLC system (Agilent SB-C18, 5 μm, 4.6×250 mm) with a mobile phase of acetonitrile/0.1 M ammonium formate buffer (pH 4.5) at a flow rate of 1.0 mL/min.
Table 1.
S1PR1 radioligands with high binding potency and good selectivity
The rat EAE model of MS and microPET studies
All animal experiments were conducted in compliance with the Guidelines for the Care and Use of Research Animals under protocols approved by Washington University’s Institutional Animal Care and Use Committee (IACUC).
The rat EAE model of MS provides a reliable and repeatable tool to evaluate the ability of newly-synthesized S1PR1 tracers to quantify increased S1PR1 expression in EAE-induced neuroinflammation. The EAE rat model was generated and the severity of symptoms was scored following our published procedure [15]. MicroPET scans in EAE and sham rats (n=3–4 in each group for each tracer) were performed using an Inveon PET/CT system (Siemens Inc., Knoxville, TN) under 1.5 – 2 % isoflurane/oxygen inhalation anesthesia, with the rat placed in transaxial position and centered with the T13 vertebral spine in the field of view. Following a CT scan for anatomical coregistration, each rat received a bolus intravenous injection of the S1PR1 tracer (15–22 MBq). A list mode protocol (1 × 3, 6 × 2, 9 × 5, 6 × 10, 4 × 30, 2 × 60 s, 2 × 2, 10 × 5 min) was used with 60-min dynamic data acquisition.
PET image data were analyzed using Inveon Research Workstation software IRW 4.2 (Siemens Inc., Knoxville, TN). The regions of interest (ROI), the lumbar spinal cord and bilateral common carotid arteries, were drawn over the co-registered PET/CT images [14]. ROI time-activity curves (TACs) were expressed as %ID/g. ROI kinetics were further analyzed using a two-tissue compartment model (2TCM) using the ROI over bilateral common carotid arteries for image-derived arterial blood input function [19, 20, 21].Volume of distribution (VT) was estimated using IRW 4.2. Parameters of tracer uptake, including average %ID/g values 10–60 min post tracer injection and VT, in EAE rat lumbar spinal cord versus sham were compared using a two-tailed t-test. A P value < 0.05 was considered statistically significant.
Quantitative western blot analysis of S1PR1 protein level in EAE and sham rat lumbar spinal cord
Rats were euthanized after microPET scans. Lumbar spinal cord was dissected, snap-frozen and stored at −80 °C until use. In brief, approximately 100 mg of tissue was weighed and placed in RIPA Lysis and Extraction Buffer containing 1X protease inhibitor cocktail (ThermoFisher, Waltham, MA) at 100 mg/mL and homogenized using a TissueRuptor (Qiagen, Germantown, MD) on ice, followed by centrifugation at 17,000 × g for 30 min at 4 °C. The supernatant was collected and the total protein concentration was measured using Micro BCA™ Protein Assay Kit (ThermoFisher, Waltham, MA). Samples were then incubated with standard Laemmli buffer and 50 mM DTT at 75 °C for 10 min. Denatured samples were size separated on 12% Mini-PROTEAN® TGX™ Gels in 1X Tris/Glycine/SDS buffer (BioRad, Hercules, CA) at 200 volts. Proteins were then transferred to 0.2 μm nitrocellulose membrane using 1X Tris/Glycine buffer containing 20% methanol. After transfer, the membrane was blocked with 5% milk in PBS for 2 h at room temperature, beta Actin Loading Control Monoclonal Antibody (BA3R) (ThermoFisher, Waltham, MA) and rabbit anti-S1PR1 antibody (Alomone, Jerusalem, Israel) were used for β-actin loading control and S1PR1 detection. Goat anti-mouse IgG-HRP sc-2005 and goat anti-rabbit IgG-HRP sc2004 (Santa Cruz, Dallas, TX) were used to detect bound primary antibodies. The amount of targeted protein was detected by developing with Pierce™ ECL Western Blotting Substrate (ThermoFisher, Waltham, MA). The quantification of S1PR1 and β-actin protein was performed using ImageJ, the level of S1PR1 was normalized to the expression of β-actin for each sample, and unpaired student t-test was performed to compare the level of S1PR1 between EAE and sham groups.
Radiometabolite analysis of rat plasma and brain
HPLC radiometabolite analysis of rodent samples was performed as an acute procedure, with both blood and brain collected at set time points post-injection. Adult male Sprague Dawley (SD) rats were intravenously injected with ~37 MBq tracer. Rats were euthanized under surgical plane anesthesia by terminal exsanguination. Blood was collected directly from left ventricle in a heparinized syringe. Plasma was separated from red cells by centrifugation, solvent deproteinated and centrifuged again. The whole brain was removed and manually homogenized in cold PBS. An aliquot of the brain homogenate was solvent extracted, deproteinated, and centrifuged. The supernatant from the solvent extracts of rat plasma and brain samples were collected for HPLC analysis. An aliquot of the supernatant was injected onto HPLC system composed of an Agilent SB C-18 analytical HPLC column (250 mm × 4.6 mm, 5 μ) and a UV detector with 254 nm wavelength. The mobile phase was acetonitrile/0.1 M ammonium formate buffer pH 4.5, (70/30, v/v) with a flow rate of 0.76 mL/min. The HPLC eluent was collected, and fractions were counted in a gamma counter, and results were background and decay-corrected.
Results
Radiochemistry
Radiosyntheses of 18F-TZ35104, 18F-TZ4877, 18F-TZ4881, and 18F-TZ43113 were achieved with 40 ± 5% radiochemical yield and high molar activity (> 45 GBq/μmol, decay corrected to the end of radiosynthesis), with a radiochemical purity of > 99 %, and chemical purity of > 95 %.
MicroPET studies in the EAE rat model
18F-TZ43113 penetrates the blood-brain barrier (BBB) in normal rats [17] but was not previously evaluated for in vivo S1PR1 specificity using the EAE rat model of MS. Here, MicroPET imaging in rats with EAE-induced neuroinflammation was used to determine if 18F-TZ43113 and the other tracers could differentiate increased S1PR1 expression in EAE rat lumbar spinal cord. TACs showed 18F-TZ43113 uptake increased by ~38 % in EAE groups compared to shams (EAE 0.47 ± 0.05 vs sham 0.34 ± 0.05, average %ID/g value, 10–60 min post injection, n = 4, P < 0.05, Figure 1). However, the relatively low uptake of 18F-TZ43113 prevents clear visualization of rat spinal cord.
Figure 1.
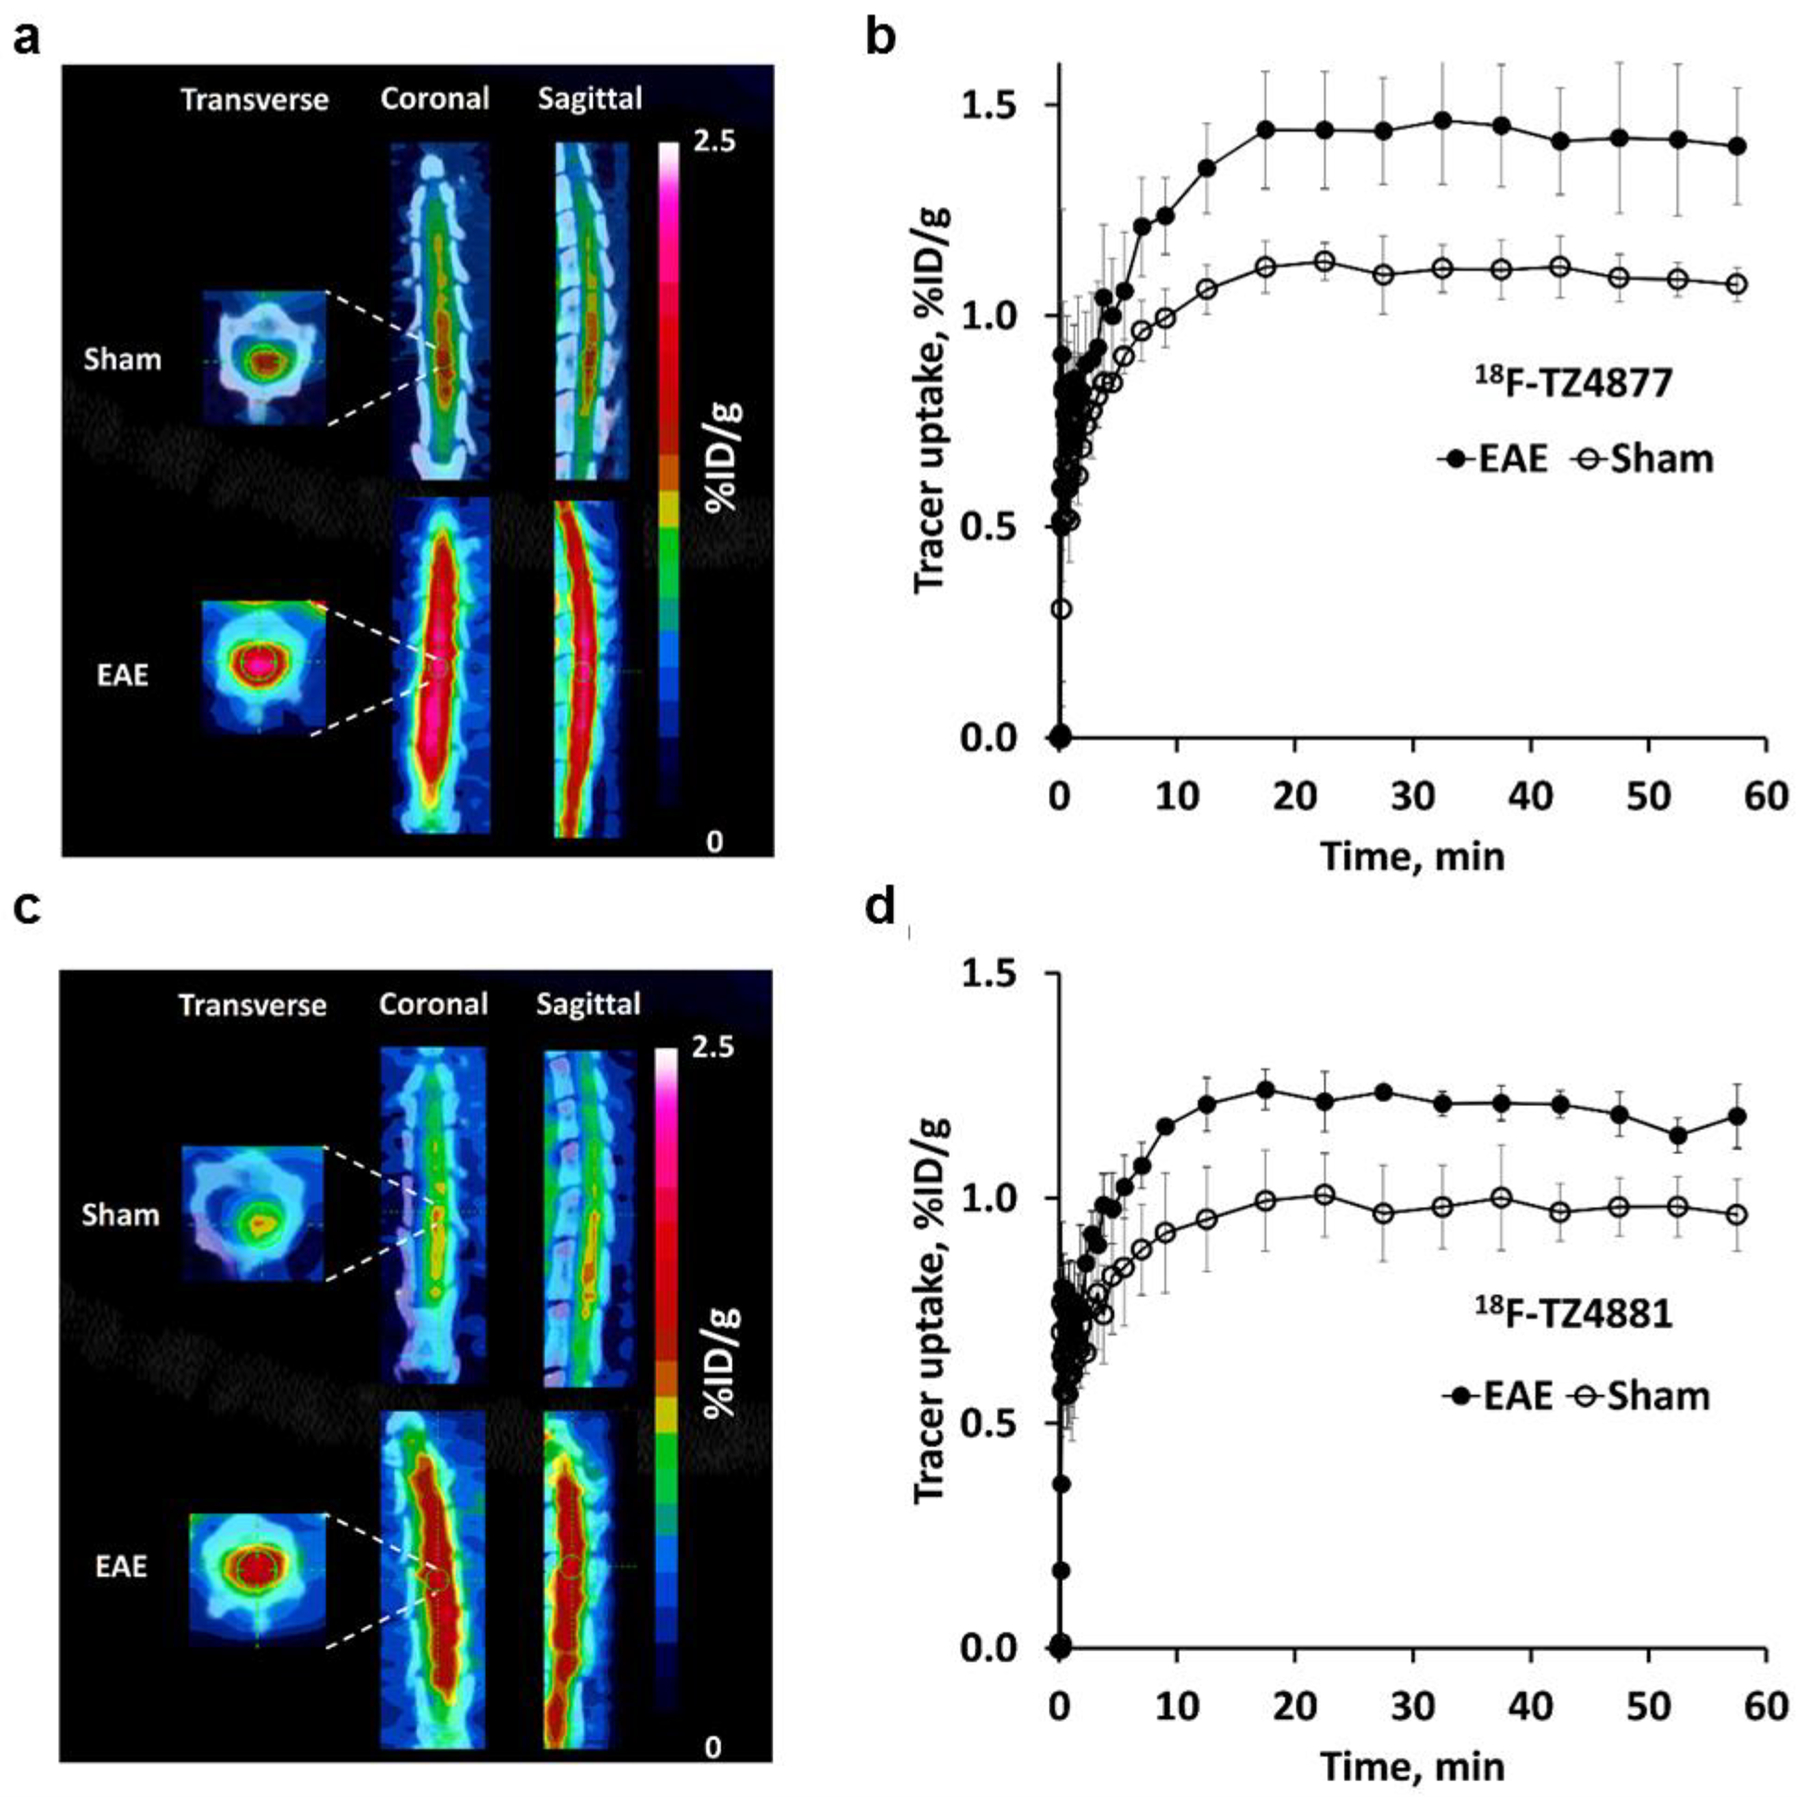
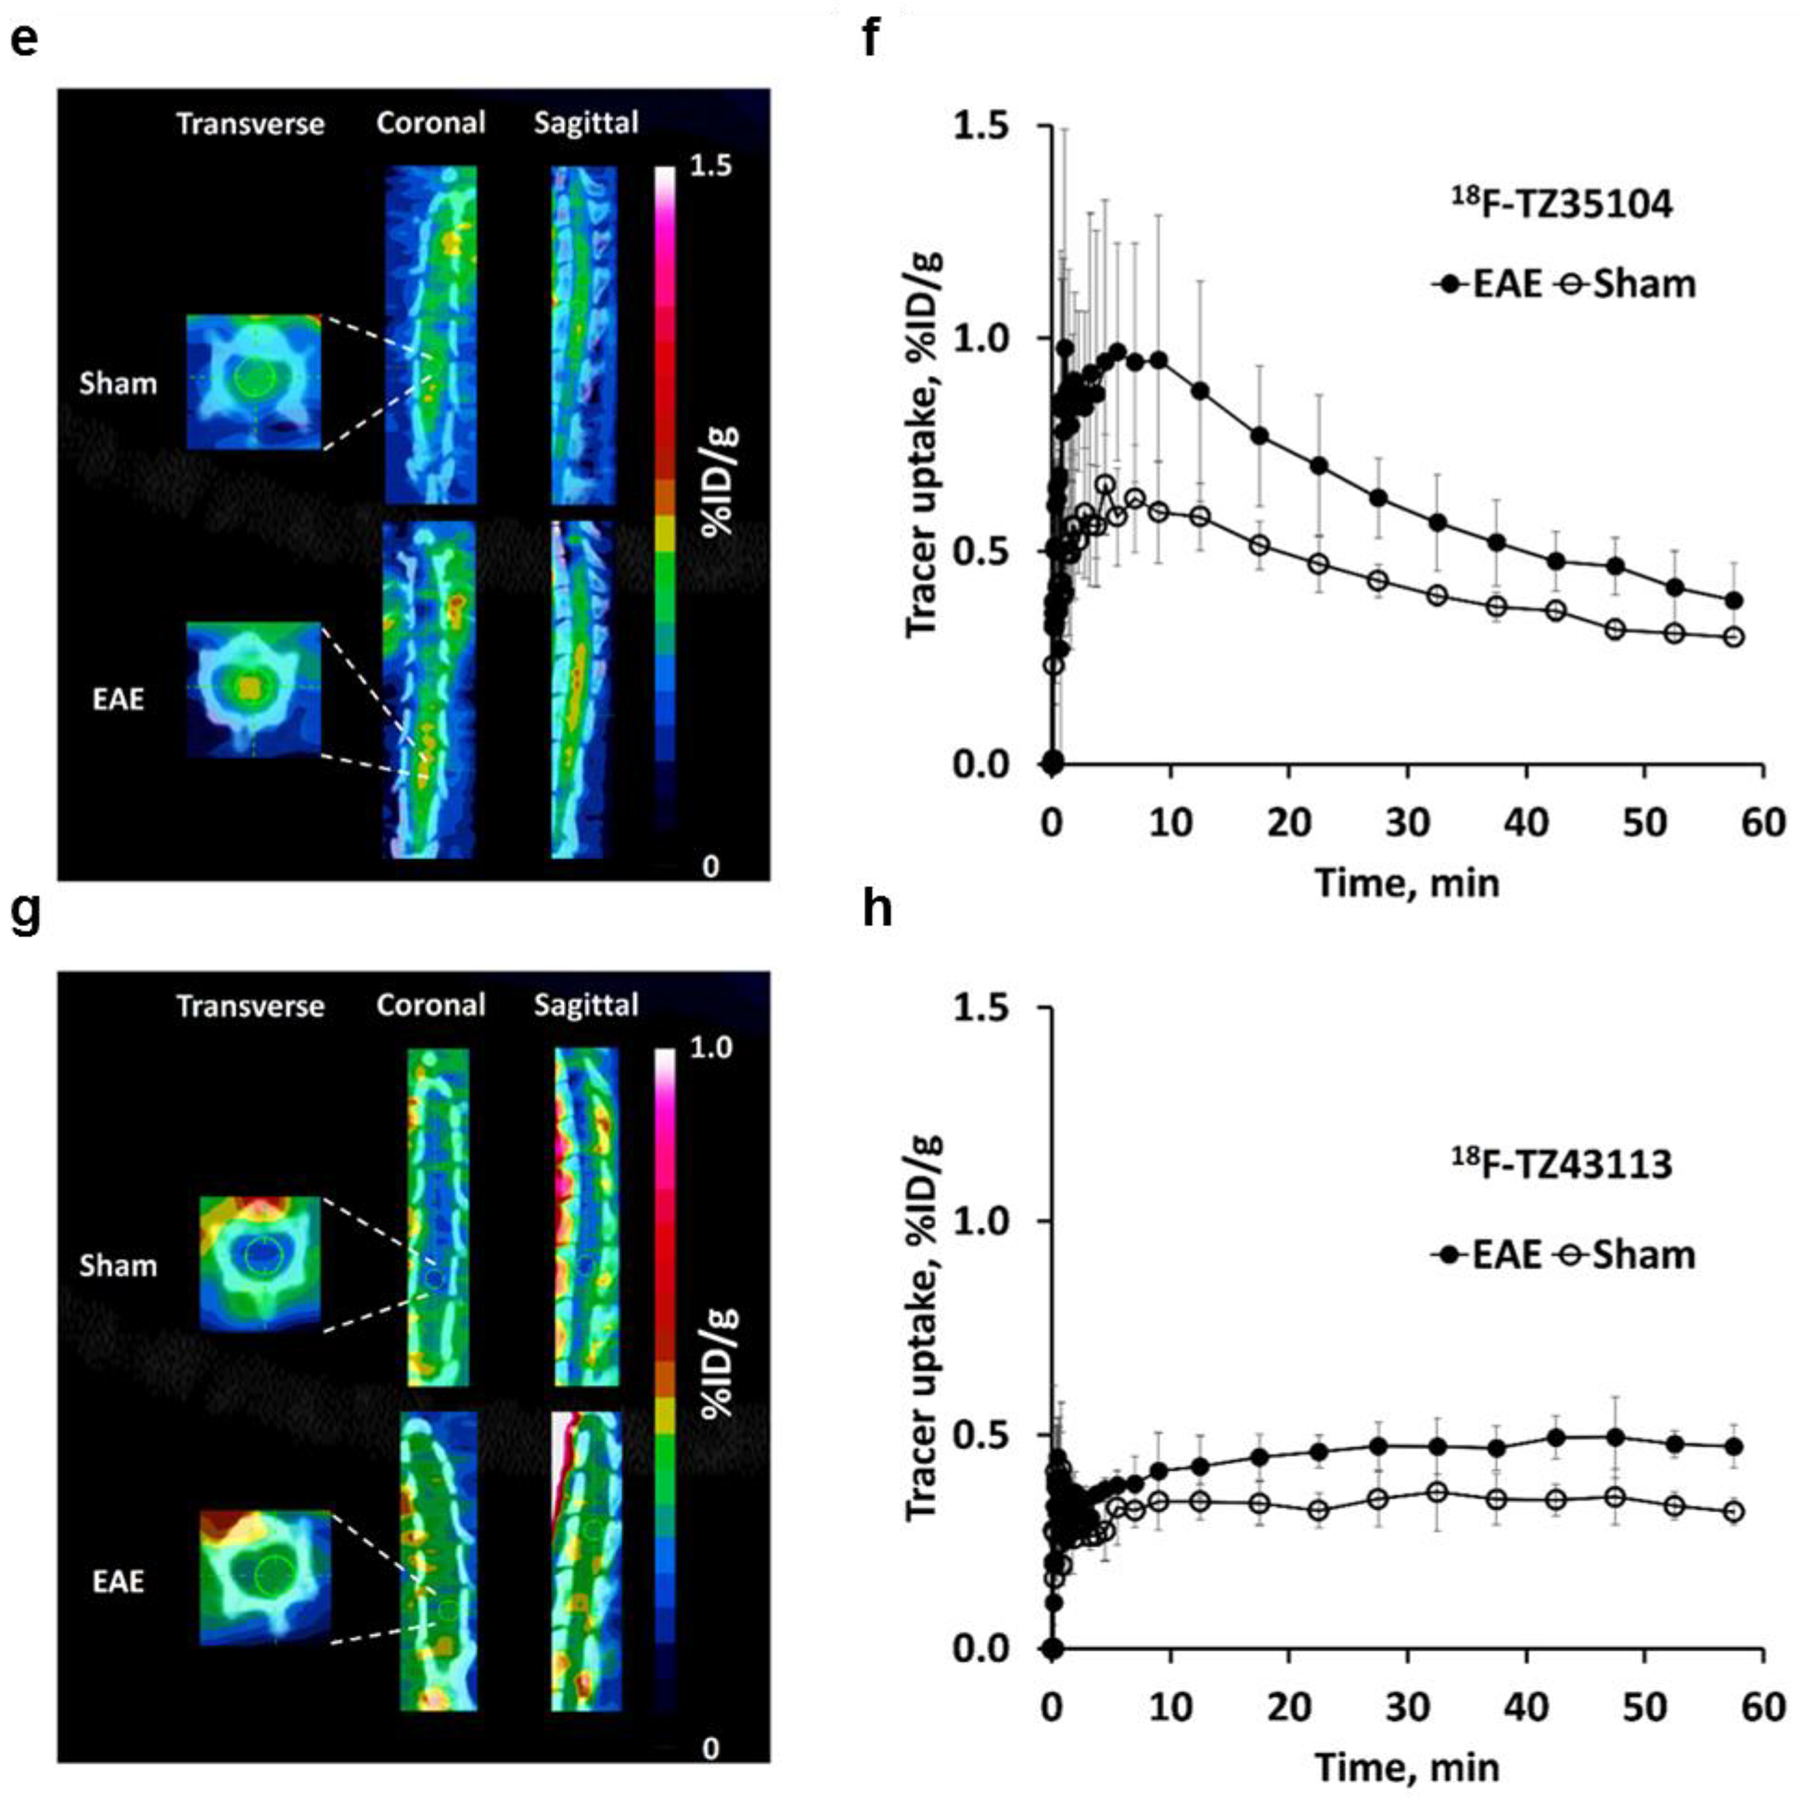
MicroPET studies of 18F-TZ4877 (a&b), 18F-TZ4881 (c&d), 18F-TZ35104 (e&f) and 18F-TZ43113 (g&h) in the EAE rat model. Representative microPET/CT images and time-activity curves for each tracer showed significantly increased uptake in EAE rat lumbar spinal cord, compared to shams. Images are summed from 0–60 min. The error bars are standard deviation (SD). n = 3–4 for each group. EAE, experimental autoimmune encephalomyelitis.
Fortunately, the other three tracers, 18F-TZ35104, 18F-TZ4877, and 18F-TZ4881, were able to provide better visualization of rat lumbar spinal cord (Figure 1). 18F-TZ35104 had higher initial tracer uptake than 18F-TZ43113 (~0.65 %ID/g vs ~0.35 %ID/g for at 5–10 min post injection) with rapid washout kinetics from rat spinal cord; the uptake of 18F-TZ35104 decreased to 0.32 %ID/g at 60 min from 0.65 %ID/g at 5–10 min. Meanwhile, both 18F-TZ4877 and 18F-TZ4881 showed significantly elevated initial tracer uptake and higher tracer retention (average uptake: 1.0–1.1 %ID/g, 10–60 min post injection) than either 18F-TZ35104 or 18F-TZ43113 (Figure 2).
Figure 2.
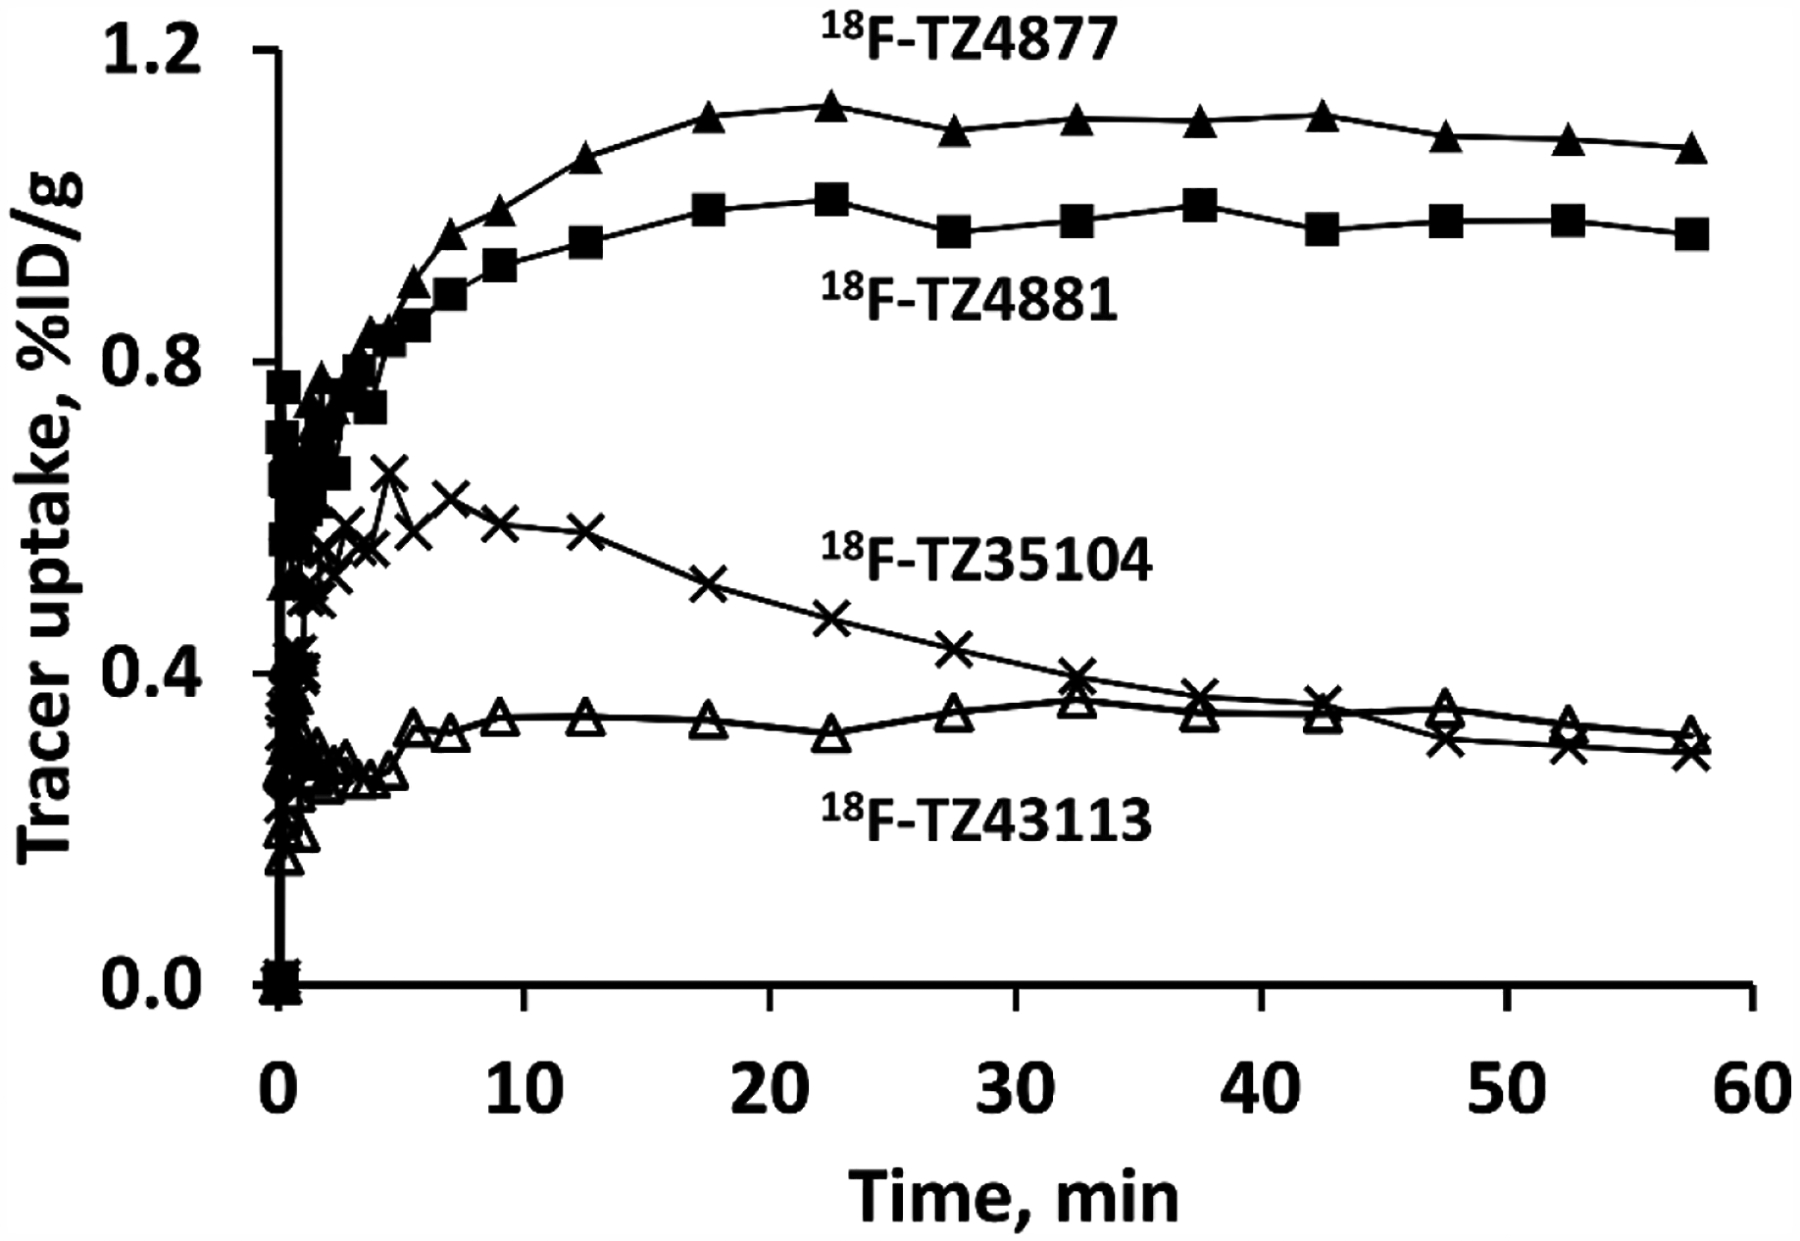
Comparison of tracer uptake of four novel S1PR1 radioligands in sham rat lumbar spinal cord. Time-activity curves of 18F-TZ43113 showed the lowest uptake in rat spinal cord, followed by18F-TZ35104 18F-TZ4881 and 18F-TZ4877.
Notably, rat microPET studies of 18F-TZ35104 revealed an average ~44% increased tracer uptake (EAE 0.58 ± 0.12 vs. sham 0.40 ± 0.04, n = 3, P < 0.05) in EAE rat lumbar spinal cord compared to shams. In comparison, 18F-TZ4877 detected an average ~29% increased tracer uptake in EAE group (EAE 1.42 ± 0.14 vs sham 1.10 ± 0.06, n = 3, P < 0.01), while 18F-TZ4881 showed an average ~23% increase of tracer uptake in EAE rats (EAE 1.20 ± 0.04 vs sham 0.98 ± 0.09, n = 3–4, P < 0.01). The VT estimated from 2TCM for these three S1PR1 radiotracers in EAE and sham rats are presented in Table 2. Representative ROI TACs with 2TCM fits are shown in Figure 3. The tracer kinetic modeling results indicated that 2TCM provided good fits of all three radiotracers. The VT estimated from 2TCM revealed that EAE rats had significantly increased VT values than shams for both of 18F-TZ4877 and 18F-TZ4881, but not 18F-TZ35104.
Table 2.
Tracer uptake of three S1PR1 radioligands in EAE and sham rat spinal cords
| Tracers | Groups | Average uptake | 2TCM | ||
|---|---|---|---|---|---|
| %ID/g | Increase, % | VT, mL/cc | Increase, % | ||
| 18F-TZ4877 | EAE | 1.42 ± 0.14 | 29.09 | 2.18 ± 0.20 | 21.11 |
| Sham | 1.10 ± 0.06 | 1.80 ± 0.20 | |||
| 18F-TZ4881 | EAE | 1.20 ± 0.04 | 22.45 | 2.30 ± 0.13 | 30.68 |
| Sham | 0.98 ± 0.09 | 1.76 ± 0.19 | |||
| 18F-TZ35104 | EAE | 0.58 ± 0.12 | 45.00 | 1.33 ± 0.09 | 10.00 |
| Sham | 0.40 ± 0.04 | 1.21 ± 0.66 | |||
| 18F-TZ43113 | EAE | 0.47 ± 0.05 | 38.24 | N/A | N/A |
| Sham | 0.34 ± 0.05 | N/A |
n = 3–4 in each group for each radioligand.
Figure 3.
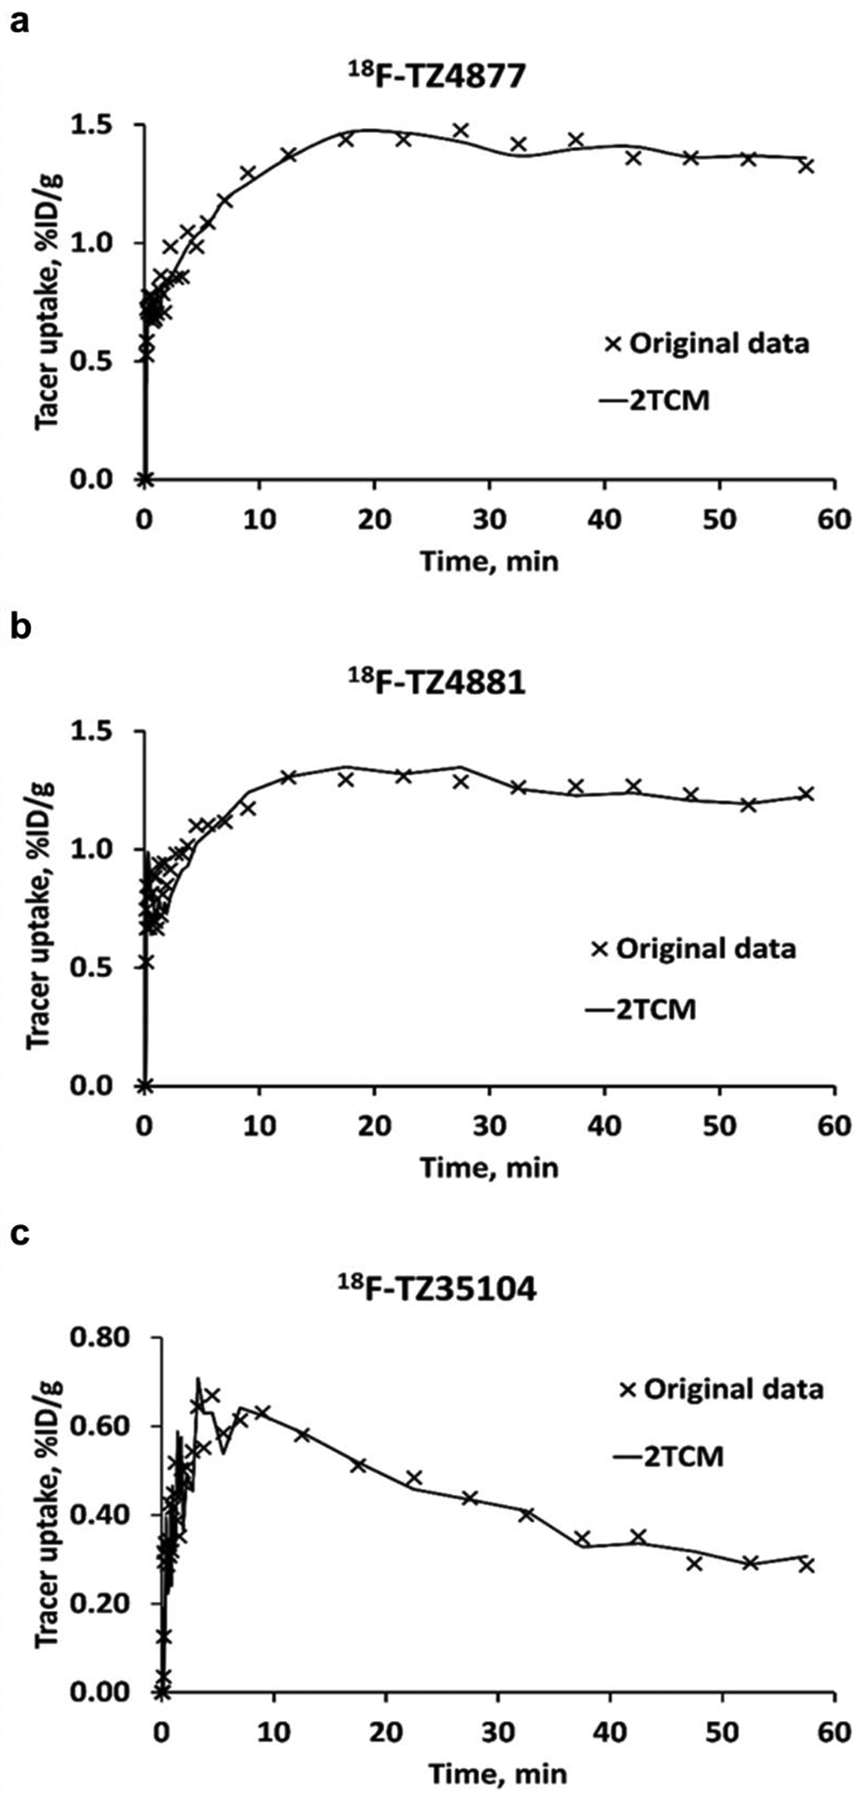
Representative 2TCM fits for 18F-TZ4877 (a), 18F-TZ4881 (b) and 18F-TZ35104 (c) in rat spinal cord. The results indicate that 2TCM provide good fits for these three radioligands. 2TCM, 2-tissue-compartment models.
Quantitative western blot analysis of S1PR1 protein level in EAE and sham rat lumbar spinal cord
Western blot analysis was performed to evaluate the expression of S1PR1 in the spinal cord of EAE and sham rats. Consistent with our previous finding using immunohistochemistry [15], the expression of S1PR1 was approximately 1.3 fold higher in EAE rat spinal cord (1.40 ± 0.07) than shams (1.05 ± 0.05) with a p value of 0.0057 using unpaired t-test (Figure 4), indicating 33% increase of S1PR1 protein level in the EAE rat spinal cord.
Figure 4.
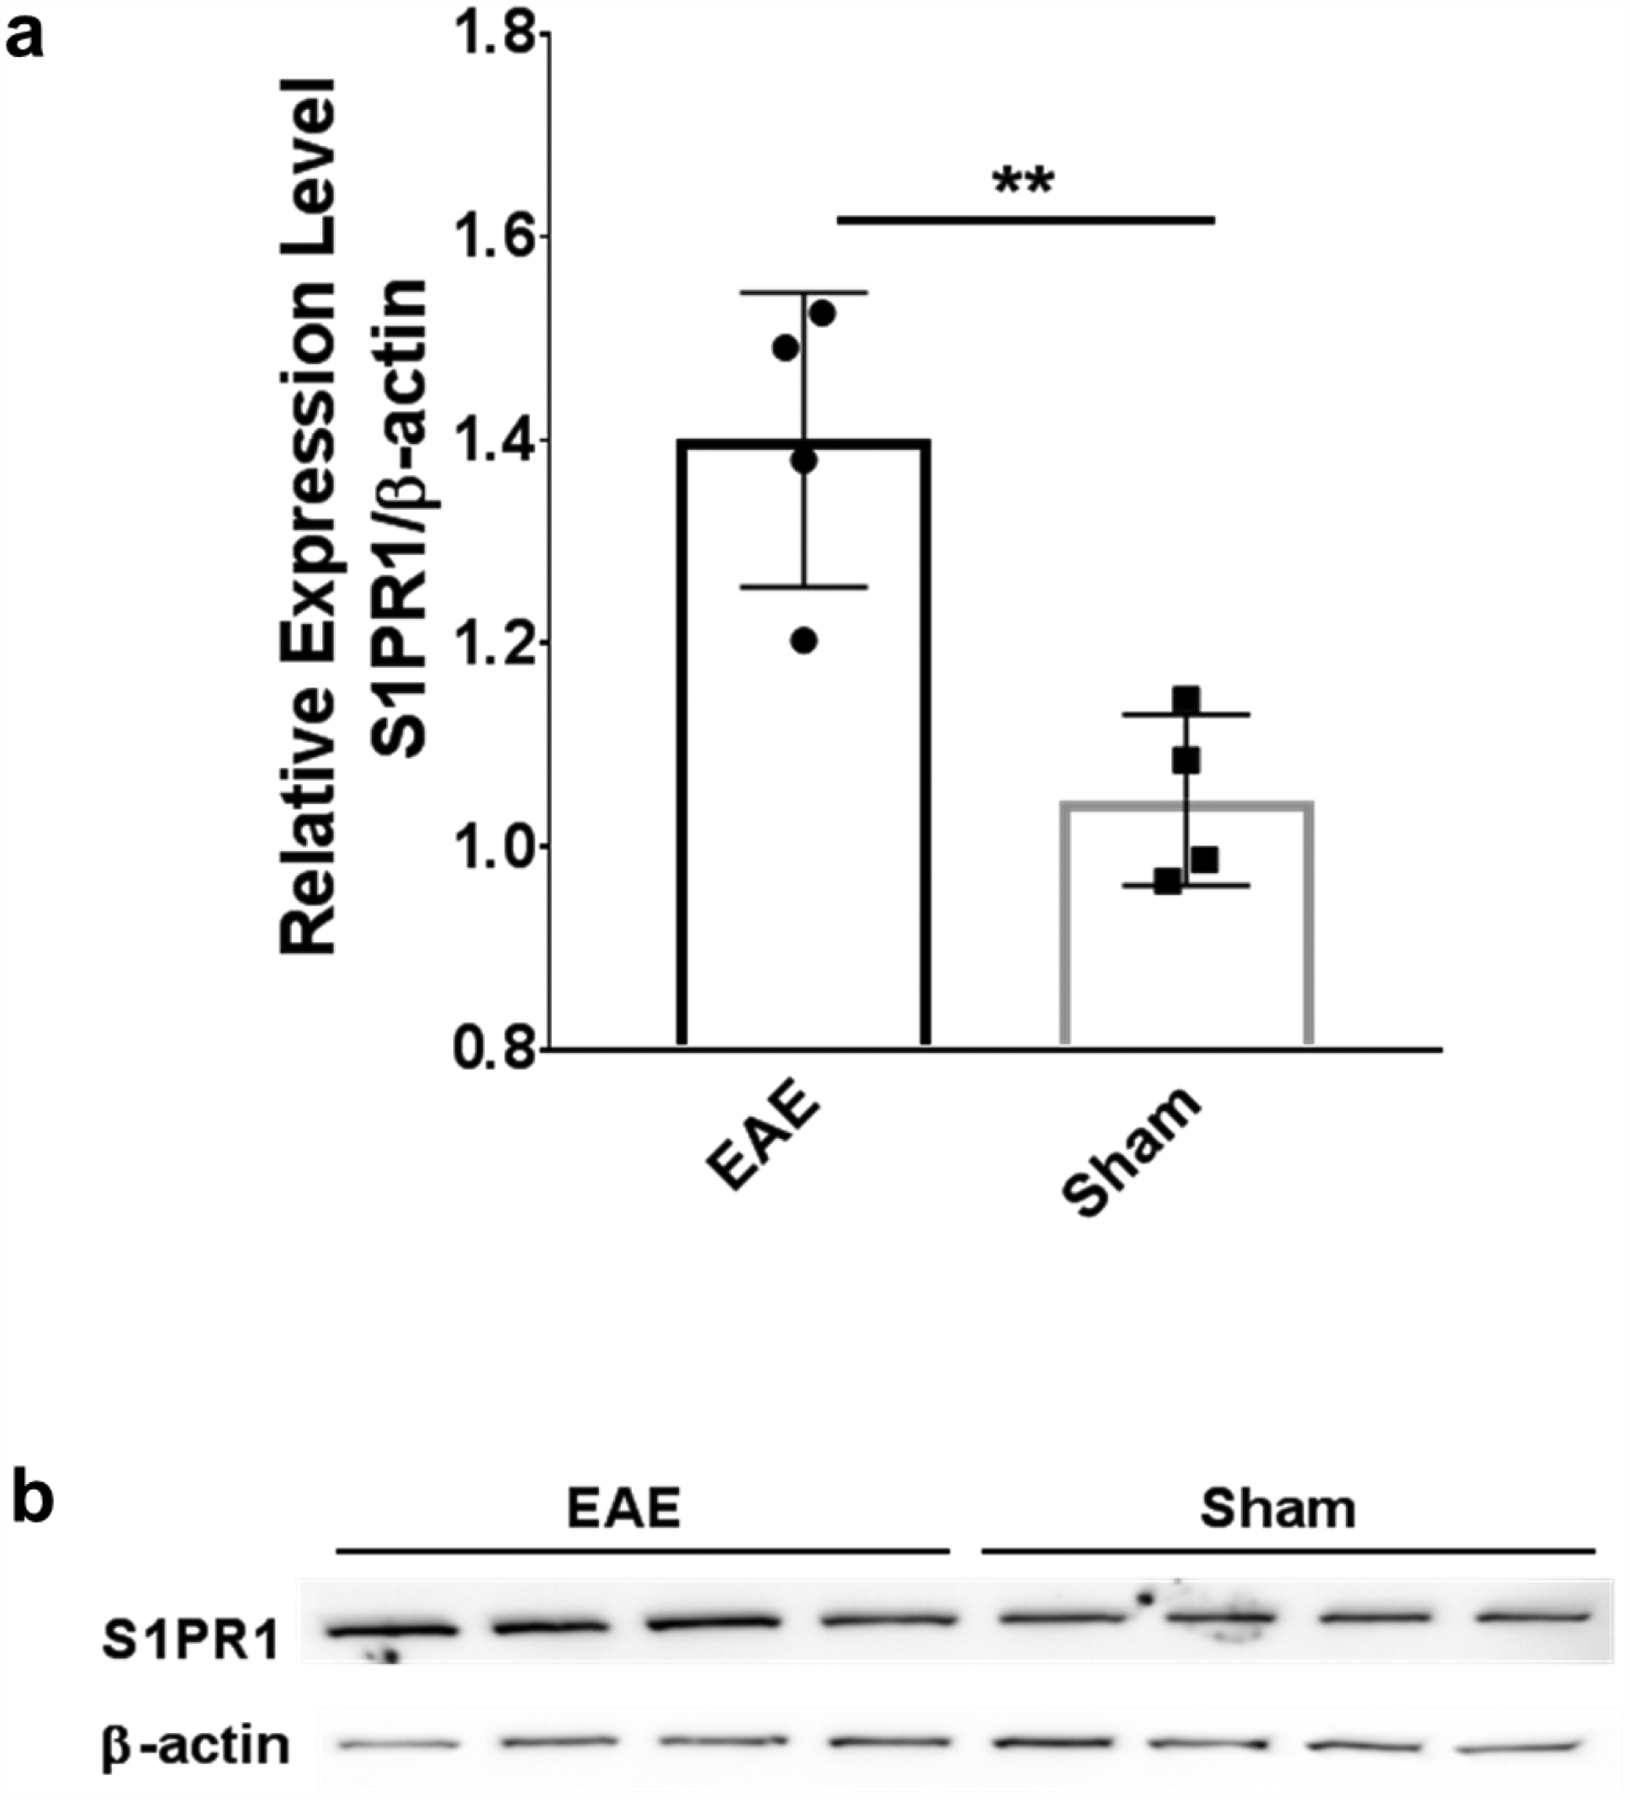
Western blot analysis of S1PR1 expression in the EAE and sham rat spinal cord. (a) The expression of S1PR1 was significantly higher in EAE rat spinal cord compared with shams (1.40 ± 0.07 vs 1.05 ± 0.04, n=4, **p ≤ 0.01); (b) Representative western blot analysis images of S1PR1 expression and β-actin expression in rat spinal cord. Each lane presents one individual animal.
Radiometabolite analysis of rat plasma and rat brain homogenate samples
HPLC radiometabolite analysis of rat blood and brain extracts post injection (p.i.) of the new F-18 radiotracer allows a direct measure of radiometabolites in the brain and plasma and the in vivo stability of the radiotracer (Figure 5). Three radioactive peaks were detected in rat plasma extracts; the percentage of the parent compound 18F-TZ4877 was 75%, 68%, 66%, and 51% at 5, 15, 40 and 60 min p.i. respectively. The level of the lipophilic radiometabolite was 14, 21, 26, and 41% and 7, 6, 5, and 5% for the polar radiometabolite at 5, 15, 40 and 60 min p.i. respectively. The parent 18F-TZ4877 radioactive peak and one hydrophilic radiometabolite peak were detected in the solvent extract of the rat brain homogenate. The parent 18F-TZ4877 was measured at 78%, 89%, 65%, and 68% at 5, 15, 40 and 60 min p.i. respectively, while the hydrophilic radiometabolite with a retention time of ~3 min, was 6, 2, 10, and 14% at 5, 15, 40 and 60 min p.i. respectively. No lipophilic radioactive peak was detected in brain. The percentage of the parent 18F-TZ4877 was relatively stable from 5 min to 60 min, while the percentage of the polar metabolite showed no increase. This could be caused by the low activity of in the HPLC sample injection. However, the percentage of each radioactive peak in the brain extract at different time points was consistent with overall stability and the trend of 18F-TZ4877 metabolism in the rat plasma, highlighting the importance of human metabolite analysis for radiotracers in clinical application.
Figure 5.
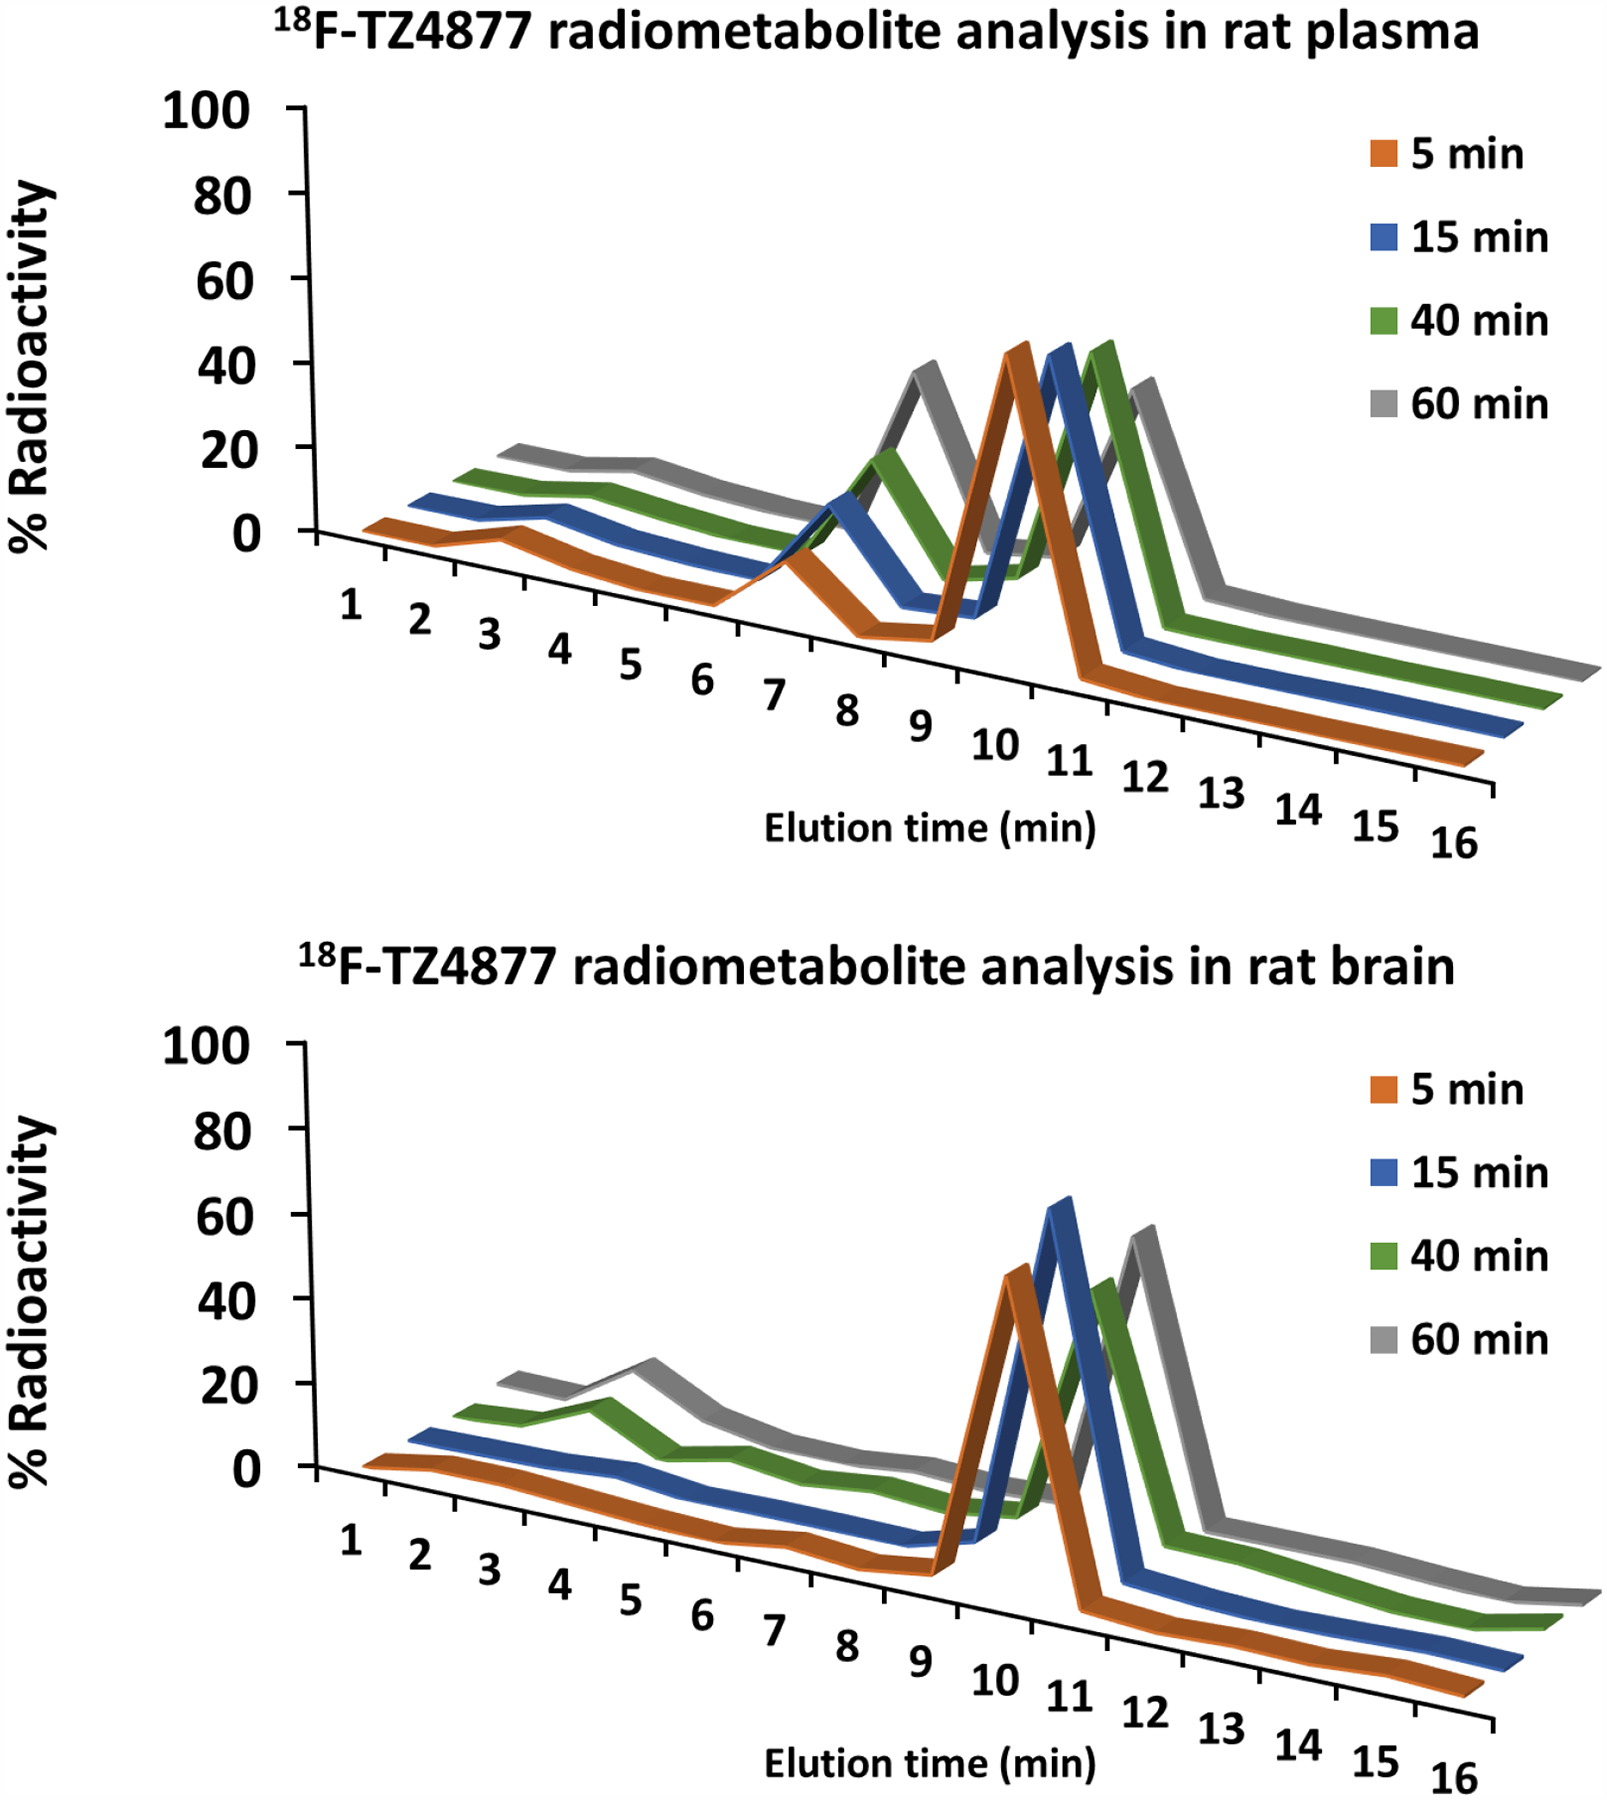
Radiometabolite analysis of rat arterial plasma and rat brain homogenate extracts post injection of 18F-TZ4877.
Discussion
Herein, we present our in vivo characterization of four 18F-labeled S1PR1 PET tracers to determine if they have suitable properties for imaging neuroinflammation and S1PR1 expression in CNS. The properties for an ideal CNS PET radiotracer have been thoroughly discussed previously [22, 23], including high binding affinity, good selectivity, the capability of crossing BBB, favorable in vivo kinetics, lack of accumulation of radiometabolites in the brain, etc. Building on our previously reported preliminary results, the current efforts focused on using PET for differentiating S1PR1 expression under neuroinflammation in a rodent model of MS vs. shams and in vivo stability and metabolite analysis of the most promising candidate.
The myelin basic protein (MBP) induced EAE rat model used in our current and previous studies presents acute and severe neuroinflammation in rat spinal cord, especially the lumbar section, with good reproducibility [15]. Immunohistochemistry studies demonstrated that S1PR1 protein expression is upregulated at the inflamed site of human MS brains and EAE rat spinal cords [10, 15]. We used western blot, a more quantitative method, and detected 33% increase of S1PR1 protein level in EAE rat lumbar spinal cord.
The initial evaluation was performed using 18F-TZ43113, and revealed significantly increased uptake in rat lumbar spinal cord of the EAE rats compared to shams, which was consistent with 11C-TZ3321 [15]. The relatively low uptake of 18F-TZ43113 in EAE rat spinal cord (0.3–0.4 %ID/g) failed to provide an adequate signal to noise ratio for high quality of PET visualization neuroinflammation. 18F-TZ35104 has a better binding affinity and a smaller topological polar surface area (TPSA) value (TPSA = 63.4; for 18F-TZ43113, the TPSA value is 91.4) which is more favorable as a CNS tracer [24]. The results from microPET imaging of EAE-induced neuroinflammation in rats suggested that 18F-TZ35104 was able not only to detect the increase of S1PR1 expression in EAE rat spinal cord, but also showed higher initial uptake (0.6 – 0.7% ID/g) compared to 18F-TZ43113. However, improvement of in vivo visualization was limited, which might be attributed to the fast washout of 18F-TZ35104, as shown in Figure 1.
Introduction of polyethylene glycol (PEG) chains into the molecular structures of PDE10A PET tracers improved tracer retention in PDE10 enriched striatum [25]; thus we followed a similar strategy for the newer ligands 18F-TZ4877 and 18F-TZ4881, which contain PEG chain(s) and have high binding potency toward S1PR1. Our microPET studies results revealed that both 18F-TZ4877 and 18F-TZ4881 successfully visualized increased S1PR1 expression in EAE rat lumbar spinal cord compared to the shams (Figure 1). Furthermore, these two tracers had remarkably higher initial tracer uptake (~1.5 %ID/g at 20 min) and high tracer retention (>1.0 %ID/g at 60 min) in the rat spinal cord, indicating that introducing PEG chains into the molecular structure improved the tracer washout kinetics and increased retention in rat spinal cord. Kinetic modeling studies of these three radiotracers found that 18F-TZ35104 had a large variation of VT estimates by 2TCM, while 18F-TZ4877 and 18F-TZ4881 had better reproducibility of VT estimates. The modeling data supported the use of carotid artery ROI as an alternative of direct arterial blood input for S1PR1 radiotracer PET image analysis although further investigation with arterial blood input function is needed to confirm the feasibility of this image-based method.
Subsequent radiometabolite analysis was performed for the promising candidate 18F-TZ4877 in rat plasma, as well as in rat brain tissue samples. The percentage of the parent compound was 50–70% at 60 min post injection of tracer in rat plasma (51%) and brain (68%) extracts (Figure 4), indicating good in vivo stability. Two radiometabolite peaks (a lipophilic one and a hydrophilic one) were identified by HPLC in the rat plasma. In the brain tissue samples, the lipophilic metabolite was not detected; only a relatively small percentage of hydrophilic radiometabolite was observed. Hydrophilic radiometabolites in the brain have been previously reported for other 18F-fluoroethoxyphenyl containing tracers, and could be 18F-fluroethanol, 18F-fluroacetaldehyde, or 18F-fluroacetic acid [26]. Due to the relatively small percentage of the hydrophilic radiometabolite (6, 2, and 10% at 5, 15, and 40 min p.i., respectively) and the lack of binding to S1PR1, its impact on PET measures of S1PR1 should be limited. In addition, PET images without CT co-registration (shown in the Supplemental) indicate no obvious bone uptake/defluorination of 18F-TZ4877. Human radiometabolite analysis is warranted to provide precision PET quantification and modeling for S1PR1 expression in the brain. In addition, further optimization of 18F-TZ4877 to identify a new ligand without any hydrophilic radioactive metabolites that enter the brain will be given the highest priority.
Tremendous efforts have been recently reported on the development of second generation S1PR1 agonists for therapeutic purposes [27, 28, 29], underlining the urgent need for S1PR1 tracers to evaluate target engagement and therapeutic efficacy of new S1PR1 drug candidates. Unfortunately, no 18F-labeled S1PR1 tracer has been reported that is suitable for clinical use. Currently, 18-kDa translocator protein (TSPO)–binding tracers are the most widely used radiopharmaceuticals for imaging neuroinflammation; 11C-(R)-PK11195 PET has been used to evaluate microglial response in fingolimod-treated MS patients [30]. Unfortunately, the Ala147Thr genotype polymorphism of TSPO influences the brain uptake of most of TSPO tracers, resulting in the need for genetic prescreening to prevent high within-group variation [31], this creates substantial complexity for clinical studies. An 18F-labeled S1PR1 tracer suitable for clinical use would be a valuable tool to assess S1PR1 expression in MS, as well as changes in response to therapy. It could quantitatively measure S1PR1 levels in vivo and provide a noninvasive tool to evaluate target occupancy and therapeutic efficacy of new S1PR1 drug candidates.
Conclusion
Among the four 18F-labeled tracers, 18F-TZ4877 was the most suitable tracer for quantifying S1PR1 expression in rat studies. The subsequent HPLC radiometabolite analysis of 18F-TZ4877 in rat plasma and brain extracts showed good in vivo stability and with only low radiometabolite levels in the brain. Further characterization using other models of neuroinflammation is needed to confirm the lead candidate 18F-labeled S1PR1 tracer for human use.
Supplementary Material
Acknowledgement
This work was supported by the USA National Institutes of Health (NS075527, NS103957, NS103988 and EB025815). The 18F-fluorine used this study was provided by Washington University Cyclotron Facility. The animal studies were conducted in Washington University Preclinical Imaging Facility. The authors would like to thank the staff of the Cyclotron Facility and the Preclinical Imaging Facility. The authors also thank Lynne Jones for manuscript editing.
Footnotes
Publisher's Disclaimer: This Author Accepted Manuscript is a PDF file of a an unedited peer-reviewed manuscript that has been accepted for publication but has not been copyedited or corrected. The official version of record that is published in the journal is kept up to date and so may therefore differ from this version.
Disclosure
The authors declare that they have no conflict of interest.
References
- 1.Proia RL, Hla T (2015) Emerging biology of sphingosine-1-phosphate: Its role in pathogenesis and therapy. J Clin Invest 125:1379–1387. [DOI] [PMC free article] [PubMed] [Google Scholar]
- 2.Blaho VA, Hla T (2014) An update on the biology of sphingosine 1-phosphate receptors. J Lipid Res 55:1596–1608. [DOI] [PMC free article] [PubMed] [Google Scholar]
- 3.Lee MJ, Van Brocklyn JR, Thangada S, et al. (1998) Sphingosine-1-phosphate as a ligand for the G protein-coupled receptor EDG-1. Science 279:1552–1555. [DOI] [PubMed] [Google Scholar]
- 4.Karuppuchamy T, Behrens EH, Gonzalez-Cabrera P, et al. (2017) Sphingosine-1-phosphate receptor-1 (S1P1) is expressed by lymphocytes, dendritic cells, and endothelium and modulated during inflammatory bowel disease. Mucosal Immunol 10:162–171. [DOI] [PMC free article] [PubMed] [Google Scholar]
- 5.Maceyka M, Spiegel S (2014) Sphingolipid metabolites in inflammatory disease. Nature 510:58–67. [DOI] [PMC free article] [PubMed] [Google Scholar]
- 6.Tsai HC, Han MH (2016) Sphingosine-1-phosphate (S1P) and S1P signaling pathway: Therapeutic targets in autoimmunity and inflammation. Drugs 76:1067–1079. [DOI] [PubMed] [Google Scholar]
- 7.Garris CS, Wu L, Acharya S, et al. (2013) Defective sphingosine 1-phosphate receptor 1 (S1P1) phosphorylation exacerbates TH17-mediated autoimmune neuroinflammation. Nat Immunol 14:1166–1172. [DOI] [PMC free article] [PubMed] [Google Scholar]
- 8.Tintore M, Vidal-Jordana A, Sastre-Garriga J (2019) Treatment of multiple sclerosis - success from bench to bedside. Nat Rev Neurol 15:53–58. [DOI] [PubMed] [Google Scholar]
- 9.La Mantia L, Tramacere I, Firwana B, Pacchetti I, Palumbo R, Filippini G (2016) Fingolimod for relapsing-remitting multiple sclerosis. Cochrane Database Syst Rev 4:CD009371. [DOI] [PMC free article] [PubMed] [Google Scholar]
- 10.Van Doorn R, Van Horssen J, Verzijl D, et al. (2010) Sphingosine 1-phosphate receptor 1 and 3 are upregulated in multiple sclerosis lesions. Glia 58:1465–1476. [DOI] [PubMed] [Google Scholar]
- 11.Noda H, Takeuchi H, Mizuno T, Suzumura A (2013) Fingolimod phosphate promotes the neuroprotective effects of microglia. J Neuroimmunol 256:13–18. [DOI] [PubMed] [Google Scholar]
- 12.Hunter SF, Bowen JD, Reder AT (2016) The direct effects of fingolimod in the central nervous system: Implications for relapsing multiple sclerosis. CNS Drugs 30:135–147. [DOI] [PMC free article] [PubMed] [Google Scholar]
- 13.Jin H, Yang H, Liu H, et al. (2017) A promising carbon-11-labeled sphingosine-1-phosphate receptor 1-specific PET tracer for imaging vascular injury. J Nucl Cardiol 24:558–570. [DOI] [PubMed] [Google Scholar]
- 14.Liu H, Jin H, Yue X, et al. (2017) PET study of sphingosine-1-phosphate receptor 1 expression in response to vascular inflammation in a rat model of carotid injury. Mol Imaging 16:1536012116689770. [DOI] [PMC free article] [PubMed] [Google Scholar]
- 15.Liu H, Jin H, Yue X, et al. (2016) PET imaging study of S1PR1 expression in a rat model of multiple sclerosis. Mol Imaging Biol 18:724–732. [DOI] [PMC free article] [PubMed] [Google Scholar]
- 16.Rosenberg AJ, Liu H, Jin H, et al. (2016) Design, synthesis, and in vitro and in vivo evaluation of an 18F-labeled sphingosine 1-phosphate receptor 1 (S1P1) PET tracer. J Med Chem 59:6201–6220. [DOI] [PMC free article] [PubMed] [Google Scholar]
- 17.Luo Z, Rosenberg AJ, Liu H, Han J, Tu Z (2018) Syntheses and in vitro evaluation of new S1PR1 compounds and initial evaluation of a lead F-18 radiotracer in rodents. Eur J Med Chem 150:796–808. [DOI] [PMC free article] [PubMed] [Google Scholar]
- 18.Luo Z, Han J, Liu H, et al. (2018) Syntheses and in vitro biological evaluation of S1PR1 ligands and PET studies of four F-18 labeled radiotracers in the brain of nonhuman primates. Org Biomol Chem 16:9171–9184. [DOI] [PMC free article] [PubMed] [Google Scholar]
- 19.Liptrot M, Adams KH, Martiny L, et al. (2004) Cluster analysis in kinetic modelling of the brain: a noninvasive alternative to arterial sampling. Neuroimage 21:483–493. [DOI] [PubMed] [Google Scholar]
- 20.Zhou Y, Resnick SM, Ye W, et al. (2007) Using a reference tissue model with spatial constraint to quantify [11C]Pittsburgh compound B PET for early diagnosis of Alzheimer’s disease. Neuroimage 36:298–312. [DOI] [PMC free article] [PubMed] [Google Scholar]
- 21.Zhou Y, Ye W, Brasic JR, Crabb AH, Hilton J, Wong DF (2009) A consistent and efficient graphical analysis method to improve the quantification of reversible tracer binding in radioligand receptor dynamic PET studies. Neuroimage 44:661–670. [DOI] [PMC free article] [PubMed] [Google Scholar]
- 22.McCluskey SP, Plisson C, Rabiner EA, Howes O (2020) Advances in CNS PET: the state-of-the-art for new imaging targets for pathophysiology and drug development. Eur J Nucl Med Mol Imaging 47:451–489. [DOI] [PMC free article] [PubMed] [Google Scholar]
- 23.Pike VW (2016) Considerations in the development of reversibly binding PET radioligands for brain imaging. Curr Med Chem 23:1818–1869. [DOI] [PMC free article] [PubMed] [Google Scholar]
- 24.Rankovic Z (2015) CNS drug design: Balancing physicochemical properties for optimal brain exposure. J Med Chem 58:2584–2608. [DOI] [PubMed] [Google Scholar]
- 25.Li J, Zhang X, Jin H, et al. (2015) Synthesis of fluorine-containing phosphodiesterase 10A (PDE10A) inhibitors and the in vivo evaluation of F-18 labeled PDE10A PET tracers in rodent and nonhuman primate. J Med Chem 58:8584–8600. [DOI] [PMC free article] [PubMed] [Google Scholar]
- 26.Zoghbi SS, Shetty HU, Ichise M, et al. (2006) PET imaging of the dopamine transporter with 18F-FECNT: A polar radiometabolite confounds brain radioligand measurements. J Nucl Med 47:520–527. [PubMed] [Google Scholar]
- 27.Guerrero M, Urbano M, Roberts E (2016) Sphingosine 1-phosphate receptor 1 agonists: A patent review (2013–2015). Expert Opin Ther Pat 26:455–470. [DOI] [PubMed] [Google Scholar]
- 28.Roberts E, Guerrero M, Urbano M, Rosen H (2013) Sphingosine 1-phosphate receptor agonists: A patent review (2010–2012). Expert Opin Ther Pat 23:817–841. [DOI] [PubMed] [Google Scholar]
- 29.Park SJ, Im DS (2017) Sphingosine 1-phosphate receptor modulators and drug discovery. Biomol Ther (Seoul) 25:80–90. [DOI] [PMC free article] [PubMed] [Google Scholar]
- 30.Sucksdorff M, Rissanen E, Tuisku J, et al. (2017) Evaluation of the effect of fingolimod treatment on microglial activation using serial PET imaging in multiple sclerosis. J Nucl Med 58:1646–1651. [DOI] [PubMed] [Google Scholar]
- 31.Owen DR, Yeo AJ, Gunn RN, et al. (2012) An 18-kDa translocator protein (TSPO) polymorphism explains differences in binding affinity of the PET radioligand PBR28. J Cereb Blood Flow Metab 32:1–5. [DOI] [PMC free article] [PubMed] [Google Scholar]
Associated Data
This section collects any data citations, data availability statements, or supplementary materials included in this article.


