

Abstract
Neonatal life marks the apogee of murine thymic growth. Over the first few days after birth, growth slows and the murine thymus switches from fetal to adult morphology and function; little is known about the cues driving this dramatic transition. Here we show for the first time the critical role of vascular endothelial growth factor (VEGF) on thymic morphogenesis beyond its well-known role in angiogenesis. During a brief window a few days after birth, VEGF inhibition induced rapid and profound remodeling of the endothelial, mesenchymal and epithelial thymic stromal compartments, mimicking changes seen during early adult maturation. Rapid transcriptional changes were seen in each compartment after VEGF inhibition, including genes involved in migration, chemotaxis and cell adhesion as well as induction of a pro-inflammatory and pro-adipogenic signature in endothelium, pericytes and mesenchyme. Thymocyte numbers fell subsequent to the stromal changes. Expression patterns and functional blockade of the receptors VEGFR2 and NRP1 demonstrated that VEGF mediates its pleiotropic effects through distinct receptors on each microenvironmental compartment of the developing mouse thymus.
Introduction
The thymus is the exclusive site in which conventional T cells develop from multipotent hematopoietic stem and progenitor cells. The microenvironment orchestrating this process is composed of rare populations of stromal cells forming a complex epithelial, mesenchymal and endothelial network. Thymic epithelial cells (TECs) define two major regions of the thymic microenvironment: the cortex, where distinct cortical TECs (cTECs) provide signals for T-cell commitment, positive selection, proliferation and survival of early thymocyte populations, and the medulla consisting of medullary TECs (mTECs) crucial for inducing maturation and central immune tolerance (reviewed by (1) and (2, 3)). The development of the thymic microenvironment begins with the emergence of epithelial cells from the third pharyngeal pouch endoderm, as early as embryonic day 9 (E9) in mice and the 6th week of gestation in humans (4–6). The coordinated expression of a complex transcriptional network within the epithelium (reviewed by (7)) and signaling pathways from the surrounding mesenchyme (8, 9) drives the development, specification and maturation of the TEC compartment. Interactions between TECs and hematopoietic cells colonizing the thymus continue to shape the thymic microenvironment from embryonic through postnatal development (10, 11).
The remodeling of the thymus architecture in the fetal to early postnatal stage of development is accompanied by a burst of organ growth from thymocyte proliferation. However, by three to four weeks after birth in mice thymic growth markedly slows; weeks later, the gradual loss of TECs and their progressive replacement by adipocytes mark the onset of age-related thymic involution resulting in a decline in thymocyte production and immune competence (12, 13).
While many studies on the thymic microenvironment focus on the mechanisms of thymic involution in later life (14–19) and strategies to regenerate the thymic epithelium (20–26), little is known about the processes operating immediately after birth when the robust growth of the fetal thymus rapidly slows to achieve homeostasis of the organ in the young animal. In particular, while the role of TECs throughout thymic development is well known, the interactions of the other components of the microenvironment, the mesenchyme and vasculature are largely unknown.
Previous studies from our group showed that VEGF-dependent angiogenesis occurs during the profound growth of the thymus in the first few days after birth, with rapid conversion to mature VEGF-independent vasculature by 7–10 days (27). VEGF inhibition in the neonate not only leads to maturation of the vasculature, but dramatically reduces thymocyte numbers during steady state and blocks the robust reconstitution after transplantation of the non-irradiated host (28). The mechanisms by which VEGF mediates changes in thymic growth and architecture are not known.
In this report, we show that VEGF is expressed in the neonatal thymus by all non-hematopoietic lineages and its inhibition solely during this period induces rapid changes in all three stromal compartments of the thymus; these changes largely recapitulate the maturation of these cell types seen during the transition days later from the neonatal to the young adult thymus. The microenvironmental changes occur prior to the loss of thymocytes, and include not only a loss of cTECs relative to mTECs but also depletion of CD146+CD140aneg cells, a population of pericytes we show are largely restricted to the neonatal thymus. Importantly, we show that based on receptor expression and receptor blockade, VEGF drives the fetal/neonatal phenotype of the thymus through distinct VEGFR2- and NRP1-dependent pathways in thymic endothelial and mesenchymal cells respectively. Inhibition of VEGF in neonates rapidly induces transcriptional changes in all stromal compartments demonstrating the profound global impact of VEGF on the developing thymus.
Materials and Methods
Animals
C57Bl/6J mice (The Jackson Laboratory) were kept in specific pathogen-free facilities at the University of California Los Angeles (UCLA). UCLA’s Institutional Animal Care and Use Committee approved all protocols. Unless otherwise specified “neonate” refers to one day old mice and “adult” refers to 4–6-week-old mice.
Thymic stroma isolation
The protocol described by (29–31) was modified to isolate murine stromal cells as follows. Thymic lobes were dissected from freshly euthanized mice and the connective tissue and fat attached to the thymi was gently removed. Thymi were then minced into small pieces and placed in 10 ml of RPMI with 10% Fetal Bovine Serum (FBS) (“R10”) and thymocytes were removed by vigorous pipetting and transferred to a new tube for further analysis. After repeating this procedure, residual thymic chunks were then incubated in 5 ml of R10 containing Liberase TM (Roche) 0.02% w/v and DNase I (Millipore Sigma) 0.05% w/v at 37 °C for 20 minutes with intermittent gentle agitation. In general, the thymi required four 20-minute cycles to dissociate completely. At the end of each cycle, supernatant containing stromal cells was collected and kept on ice, and fresh enzyme was added to the remaining undigested thymus pieces. After complete dissociation, all supernatants containing stromal cells in suspension were run through a 70 μm filter and any undigested tissue fragments were mashed with the help of a syringe plunger. The resulting stroma-enriched cell suspension was centrifuged at 1,500 rpm for 5 mins at 4°C, washed and re-suspended in 1X PBS with 0.5% bovine serum albumin and 2mM EDTA. For further depletion of thymocytes, cells were incubated with anti-mouse CD45 MicroBeads before magnetic depletion through a large cell column (Miltenyi Biotec).
VEGF inhibition
In all experiments C57Bl/6J neonates received an intra-peritoneal injection of either Aflibercept (Regeneron Pharmaceuticals, Tarrytown, NY) a fusion protein of VEGF receptor 1 and 2 or hFC control, both drugs at 25mg/kg, on day 1 and day 4 of life. Mice were euthanized at day 3 (48 hours following the first injection) or day 8 (one week following the first injection) of life. To overcome inter-litter variability, experimental and control mice from the same litter were used in each experiment. A drop in mouse body and thymus weight compared to control confirmed successful delivery of medication into the experimental mice, as previously reported in a study where VEGF inhibition was achieved in neonatal mice (32). Thymocytes and stromal cells were analyzed at the end of each experiment.
VEGF receptor blockade
Experimental C57Bl/6J mice received DC101 (ImClone), a VEGFR2 neutralizing antibody (57mg/kg) and/or anti-NRP1 (10mg/kg, Genentech) for 3 or 7 consecutive days. Control mice received hFC control antibody (10mg/kg, Genentech) at the same time points. Thymi were harvested from all mice at day 4 and day 8 following the initial injection and processed to obtain thymocytes and stromal cells.
Immunofluorescent staining for flow cytometry
The enriched thymic stromal fraction was centrifuged at 1,500 rpm and resuspended in 1X PBS with 0.5% bovine serum albumin and 2mM EDTA prior to antibody staining. Cells were incubated with fluorochrome-conjugated antibodies against CD3, CD4, CD8, TER-119 (Biolegend) and CD45 (BD Biosciences) to exclude remaining thymocytes and red blood cells (“Hem+” cells), and anti-CD326 (EpCAM), anti-Ly-51, anti-CD140a (PDGFRα), anti-CD146 (Mel-CAM) and anti-CD31 (PECAM-1) (Biolegend) for stromal cell analysis. Cells were analyzed on the LSRII Fortessa (BD Biosciences) and isolated using the FACS AriaII (BD Biosciences). All gating was performed following exclusion of doublets (SSC-H/SSC-W and FSC-H/FSC-W) and dead cells using 4’,6-diamidino-2-phenylindole dihydrochloride DAPI (Thermo Fischer). Data was analyzed using FlowJo software (Tree Star).
RNA extraction and RT-PCR analysis
RNA was extracted using the RNeasy micro kit (Qiagen). Complementary DNA (cDNA) was prepared using the Omniscript reverse transcriptase kit (Qiagen). cDNA from 200 cells was interrogated by semi-quantitative PCR for each of the following genes: mouse krt5 (5’-GGGAAGGAGTTGGACCAGTC-3’ [forward] and 5’-CCAAACCCATCGCCCGATTC-3’ [reverse]) Pdgfra (5’- CCTGGCGCAAGGAAAAATTGT-3’ [forward] and 5’- AGGATACCGTAAGACGAGACC-3’ [reverse]). Actb (5’- GGCTGTATTCCCCTCCATCG [forward] and 5’-TGTACCGTAACAATGGTTGACC-3’ [reverse]). HotStar Taq Polymerase (Qiagen) was used for PCR reactions, which was performed under the following conditions: denaturation at 95°C for 15 seconds, annealing at 60 °C for 1 minute, elongation at 72 °C for 1 minute and a final elongation cycle of 72 °C for 10 minutes for 40 cycles. Additional semi-quantitative PCR for gene expression was performed using TaqMan primers (Applied Biosystems, Thermo Fischer Scientific) for Aire and Col6a3 using Rpl13a as the loading control and the following conditions: 50 °C for 2 minutes and 95 °C for 10 minutes holding stage, 95 °C for 15 seconds and 60 °C for 1 minute for 40 cycles and a final elongation step at 72 °C for 10 minutes. For RT-qPCR, 5ng of RNA for each population was reverse transcribed to cDNA using QuantiTect Reverse Transcription Kit (Qiagen). cDNA was then pre-amplified using PreAmp Master mix (Applied Biosystems, Thermo Fischer Scientific). qPCR was performed using using Taqman primers on a ViiA 7 Real-time PCR machine (Applied Biosystems, Thermo Fischer Scientific) to test the expression of Foxn1, Dll4, Fgf7, Fgf10, Cxcl12, Ccl25, Il7, Flt1, Kdr, Nrp1, Vegfa; Rpl13a and Hsp90 were used as the two housekeeping genes. Ct values for each gene were normalized to the geometric mean of the two house-keeping genes. Data was analyzed using the comparative Ct method (33).
Ki-67 and Annexin staining
Thymocytes were isolated after mincing the thymus and 1.106 cells were resuspended in PBS with 0.5% bovine serum albumin and 2mM EDTA. Extracellular staining was performed as described above with the following conjugated antibodies: anti-lineage markers (B220, CD11b, TER119, Ly6-G/Ly6-C, BD Biosciences), CD117 (BD Biosciences and eBiosciences), CD44, CD3, CD45, CD25 (BD Biosciences) CD4 and CD8 (Biolegend). Following extracellular staining, cells were washed in PBS with 0.5% bovine serum albumin and 2mM EDTA. Ki67-BV605 staining (Biolegend) was performed using the Foxp3 transcription factor fixation/permeabilization kit (eBiosciences). For cell death analysis, following cell surface staining, thymocytes were incubated with Annexin V-APC (Biolegend) in Annexin V binding buffer (Biolegend), and were analysed within an hour on a LSRII Fortessa (BD Biosciences).
Histochemistry
5 μm sections of neonatal and adult thymi were paraffin embedded and stained with hematoxylin and eosin (H&E) for morphologic analysis. For immunohistochemistry staining, thymi from both neonatal and adult mice were embedded in optimal cutting temperature (OCT) medium before being frozen at −80°C, prior to cutting. Cryostat sections (Leica Biosystems) of thymi were immobilized on Super-Frost Plus slides (Thermo Fisher Scientific) and were air-dried for 20 minutes before being fixed in neutral buffered formalin 10% (Richard-Allen Scientific). Slides were then washed in phosphate buffered saline (PBS) and the endogenous peroxidase was quenched with a 10-minute incubation in 3% freshly prepared hydrogen peroxide solution. This step was followed by a 20-minute incubation in rodent blocker M (Biocare Medical). Slides were then washed in PBS, and incubated in PBS with Tween 20 (PBST) containing 5 % normal donkey serum. Sections were next incubated overnight with either rat monoclonal anti CD31 (1:100, BD Biosciences) or rabbit polyclonal anti CD31 (1:100, Abcam), followed by treatment with biotinylated donkey anti-rat or anti-rabbit IgG respectively and then incubated with streptavidin Alexa 488 for an hour. Slides were washed with PBS between every incubation. In preparation for staining with the second antibody, sections were incubated in PBST containing 5% normal horse serum for 30 minutes followed by treatment with the secondary antibody, which was either rabbit polyclonal anti-CD146 (1:200, Abcam) or rat monoclonal anti-mouse CD140a conjugated APC (1:100, Biolegend) for 3 hours. Sections were then incubated with horse anti-rabbit and anti-rat peroxidase polymer respectively. The sections were finally washed with PBST and incubated in tyramide signal amplification Alexa-594 (1:100, Thermo Fisher Scientific). All images were acquired using Apotome microscope with software Axiovision 4.8 (Zeiss).
RNA-Sequencing and Bioinformatics
Whole transcriptome profiling (RNA-Seq) of each thymic stromal subset was performed with thymii obtained from B6.SJL neonates treated on postnatal day 1 (P1) with Aflibercept (Curascript, Orlando, FL) or hFC control (Regeneron Pharmaceuticals, Tarrytown, NY) (both drugs at 25mg/kg) and harvested 48h post treatment (P3). cTEC, mTEC, CD146+ pericytes, CD140a+ thymic mesenchymal cells and endothelial cells were isolated by FACS as described above and lysed with Qiazol lysis reagent (Qiagen). RNA was extracted using miRNeasy Micro Kit as per manufacturer’s intructions (Qiagen). Two or four independent pools were used to generate RNA-Seq libraries for control or treated mice, respectively. Total RNA was quantified using the Agilent 6000 pico kit and Agilent 2100 Bioanalyzer Instrument (Agilent Technologies, Santa Clara, CA). RNA sequencing and library preparation were performed in the Technology Center for Genomics and Bioinformatics (UCLA) as follows: cDNA generation and amplification was made using the Ovation RNA-Seq System V2 (cat# 7102–32, NuGEN Technologies, San Carlos, CA); library preparation was done using the KAPA LTP kit (# KK8232, Kapa Biosystems/Roche, Wilmington, MA), according to manufacturer’s instructions. The work flow consisted of mRNA enrichment, cDNA generation, end repair to generate blunt ends, A-tailing, adaptor ligation and PCR amplification. A total of 30 libraries (5 cell types, duplicated controls, 4 replicates for treated mice) were multiplexed and sequenced in four different lanes of the flow cell. Raw sequence files are available at NCBI’s Gene Expression Omnibus (GSE126681). Sequencing was performed on the HiSeq3000 System for a paired-ended 150bp run (Illumina).
The STAR ultrafast universal RNA-seq aligner v2.6 (34) was used to generate the genome index and perform paired-end alignments. Reads were aligned to a genome index that includes both the genome sequence (GRCm38 primary assembly) and the exon/intron structure of known gene models (Gencode M18 genome annotation). Alignment files were used to generate gene-level count summaries with STAR’s built-in gene counter. Only protein-coding genes in the Gencode M18 annotation were considered (>75% of total counts for all samples). Independent filtering was applied as follows: genes with less than one average count per sample, count outliers or low mappability were filtered out for downstream analysis (35). Counts were normalized per-sample in units of FPKMs after correcting for gene mappable length and sample total counts.
Differential expression analysis was performed with DESeq2 (36). For VEGF-Trap analyses, count data were fitted to additive models using Batch and Treatment as explanatory factors to correct for litter-specific changes, for each cell type. A gene was classified as differentially expressed if p-value < 0.01 (likelihood ratio test) and log2 fold-change >0.5. These tests yielded 402, 333, 253, 160 and 247 genes significantly regulated by VEGF-Trap in Endothelial, CD146+, CD140a+, cTEC and mTEC cells respectively (Supplemental Table 1). Principal component analysis (Figure 6) was performed with the function prcomp in R (https://www.R-project.org/) using variance-stabilized data as input. Boxplots of selected VEGF-Trap regulated genes (Figure 6, Supplemental Figure 3) and signature genes (Figure 7) were visualized in Matlab using z-scores from variance-stabilized data within each compartment. Cell-type specific genes were identified using a pair-wise model with two levels to test for differences between gene expression in one cell-type as compared to all other subsets. Genes were classified as cell-type specific if the estimated fold change was higher than four-fold, adjusted p-value < 0.01 (Wald test) and the minimum expression in all samples for the target cell type was 5 FPKMs. This analysis yielded 313, 198, 352, 215 and 563 genes specifically expressed in Endothelial, CD146+ pericytes, CD140a+thymic mesenchymal cells, cTECs and mTECs, respectively (Supplemental Table 1). Functional enrichment was performed with Metascape (http://metascape.org) using Gene Ontology (GO) biological processes annotations in mouse. Bubble charts (Figure 6 and Supplemental Figure 3) show the relative enrichment of each ontology term in each cell type re-scaled between 0 and 1 (1 representing the maximum enrichment using a -log10 hypergeometric adjusted p-value). Absolute enrichment values are provided in Supplemental Table 1. The network of ontology terms in Supplemental Figure 3 was computed in-house and visualized with Cytoscape (37). Nodes with the same color are specific ontologies in the same GO generic class, and are labeled using a representative member or generic name (Supplemental Table 1). Node size is proportional to statistical significance (hypergeometric p-value as provided by Metascape). Edge thickness is proportional to between-node similarity and was computed in-house in Matlab (version release 2017a, The MathWorks, Inc) using Kappa statistics (38), and reflects the overlap between the gene sets annotated in both ontology terms. All plots in Figure 6 and Supplemental Figure 3, were generated in Matlab (MATLAB, version release 2017a).
Figure 6. VEGF regulates key signaling pathways within the neonatal thymic stroma.
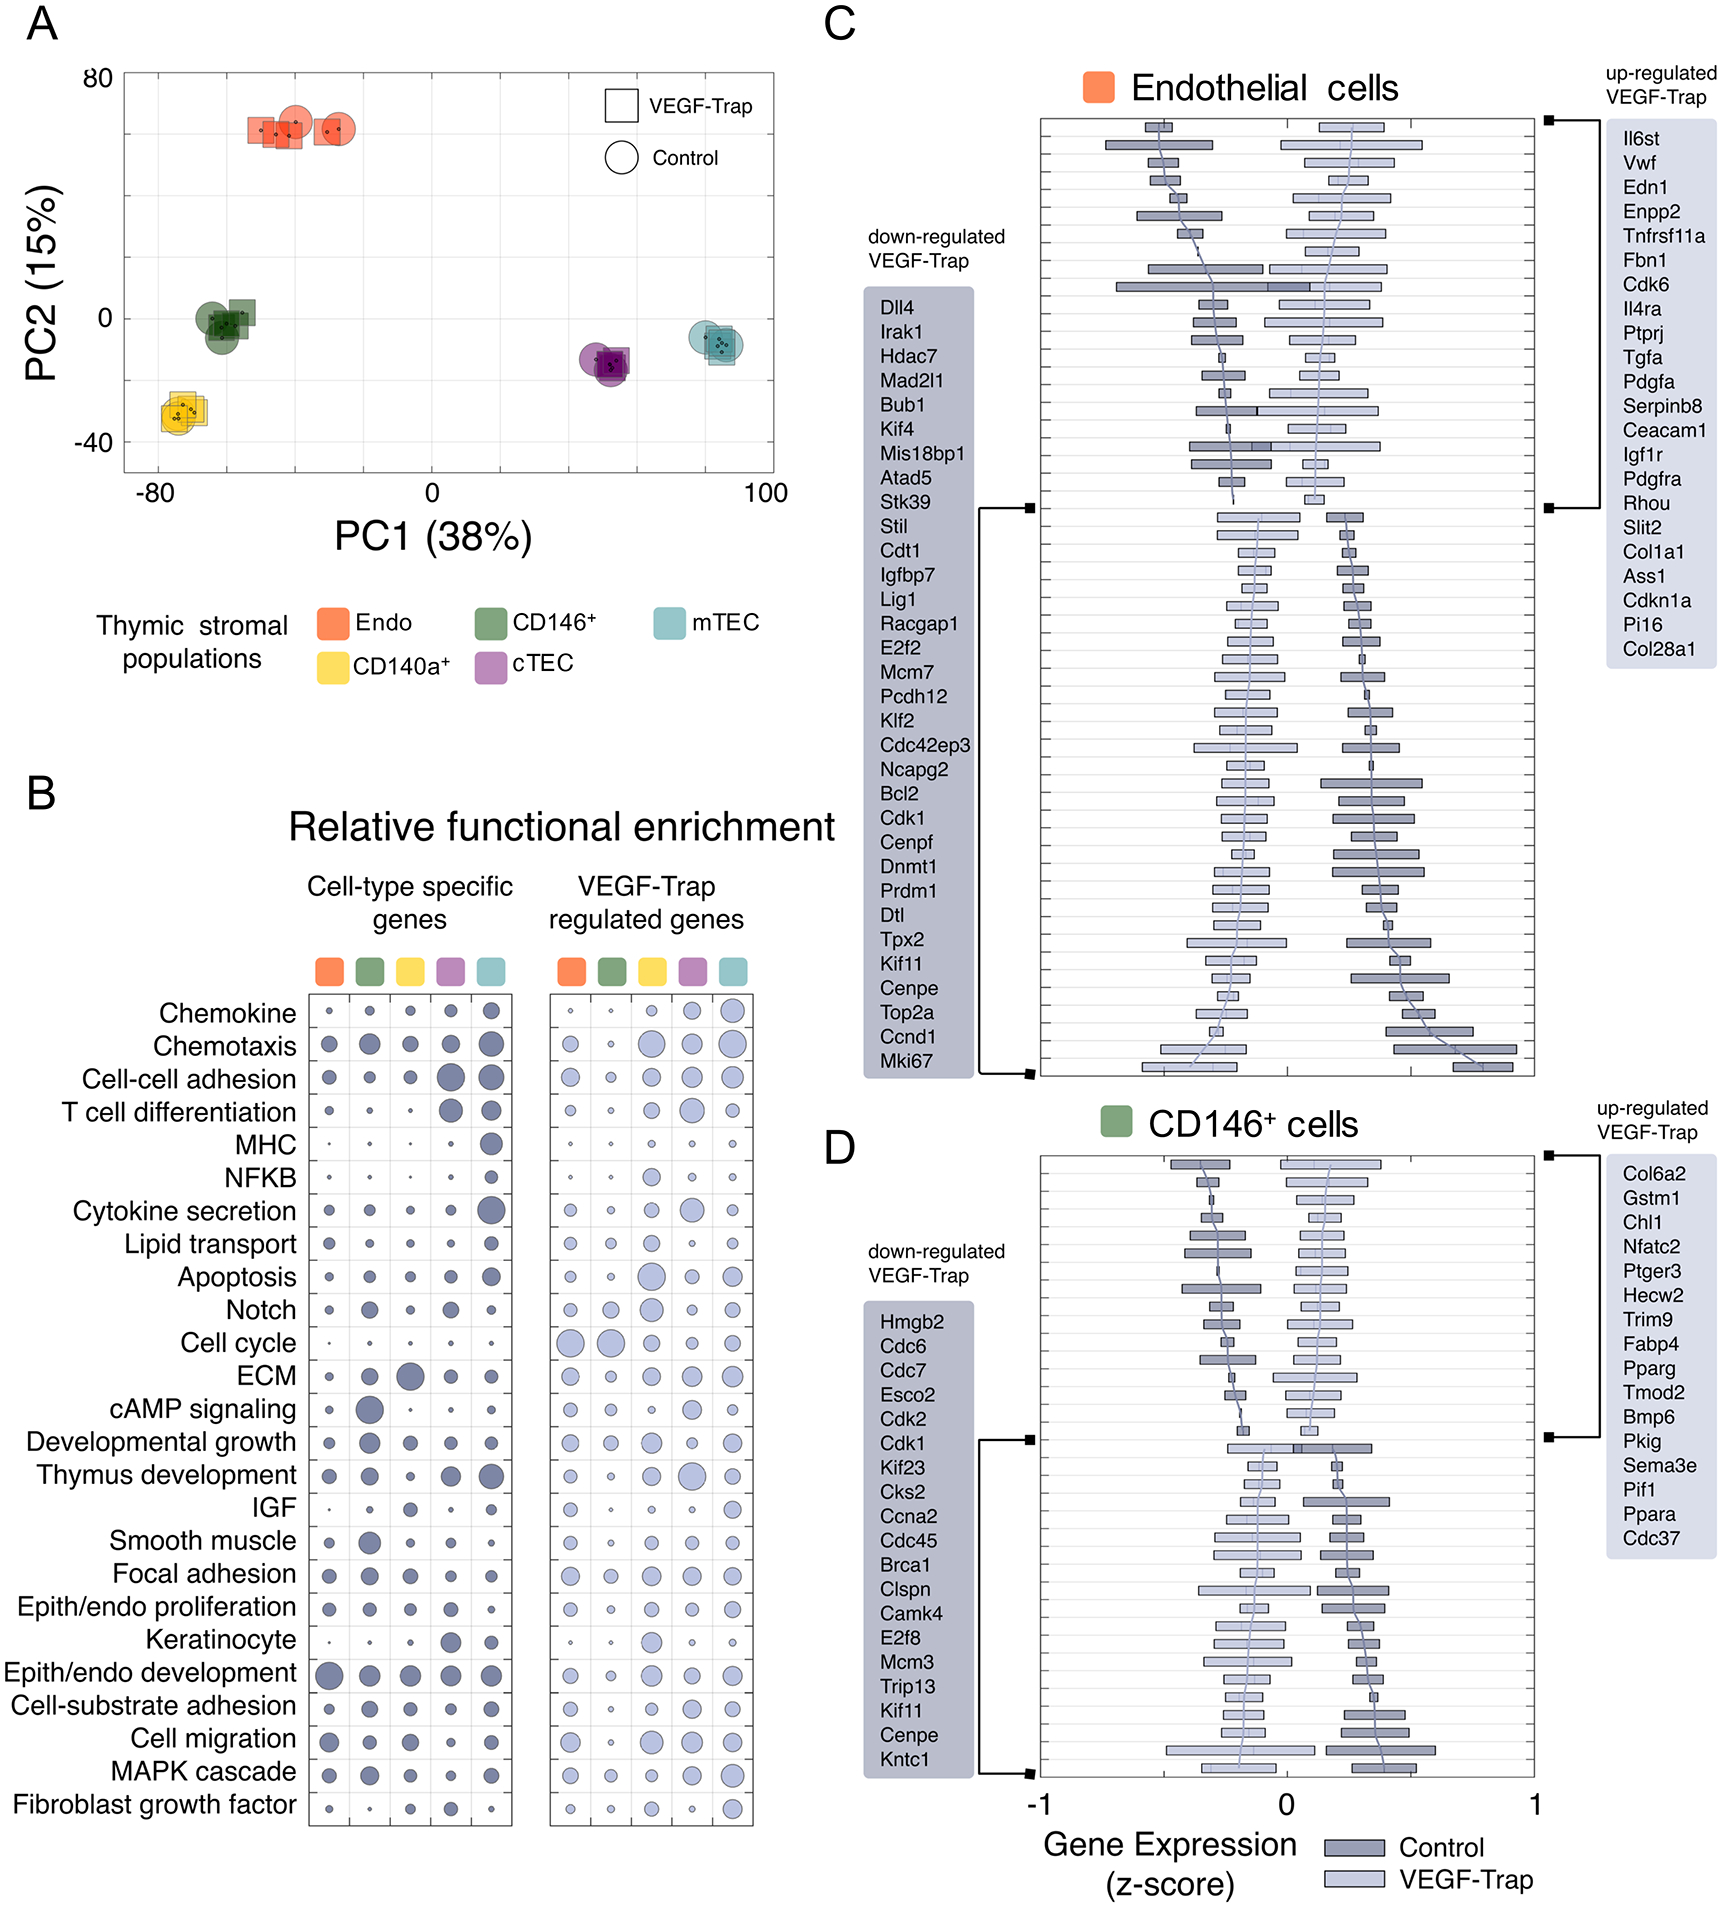
(A) Principal component analysis of gene expression in stromal cell subsets from control and VEGF-Trap treated neonates analyzed at P3. Each symbol represents an individual biological replicate for the corresponding cell type and treatment. Shown is the samples’ clustering using the first two principal components (PC1/PC2) and percent of variance explained by each component as computed using unfiltered, whole-transcriptome expression levels. (B) Functional enrichment results for cell-type specific (left) and VEGF-Trap regulated (right) genes. Shown at left are selected Gene Ontology categories with significant enrichment in at least one gene set. The size of each circle in the bubble chart represents, for each gene set, the relative enrichment as compared to the most significant term for the gene set (-log10 p-value scale). (C-D) Gene-wise boxplots of expression z-score distributions for selected genes regulated by VEGF-Trap in endothelial cells (C) and CD146+ pericytes (D). Each box represents a gene’s z-score distribution for all samples in one experimental group (Control n = 2, VEGF-Trap n = 4). Line plots connect the mean z-score for all genes in each experimental group. For each cell type, selected genes are shown ranked from strongest up- (top) or down-regulation (bottom) after VEGF-Trap treatment, and official mouse gene symbols are shown. Similar boxplots for CD140a+ and TECs are included in Supplemental Figure 3B.
Figure 7. Cell-type specific signature genes regulated by VEGF in thymic stromal populations.
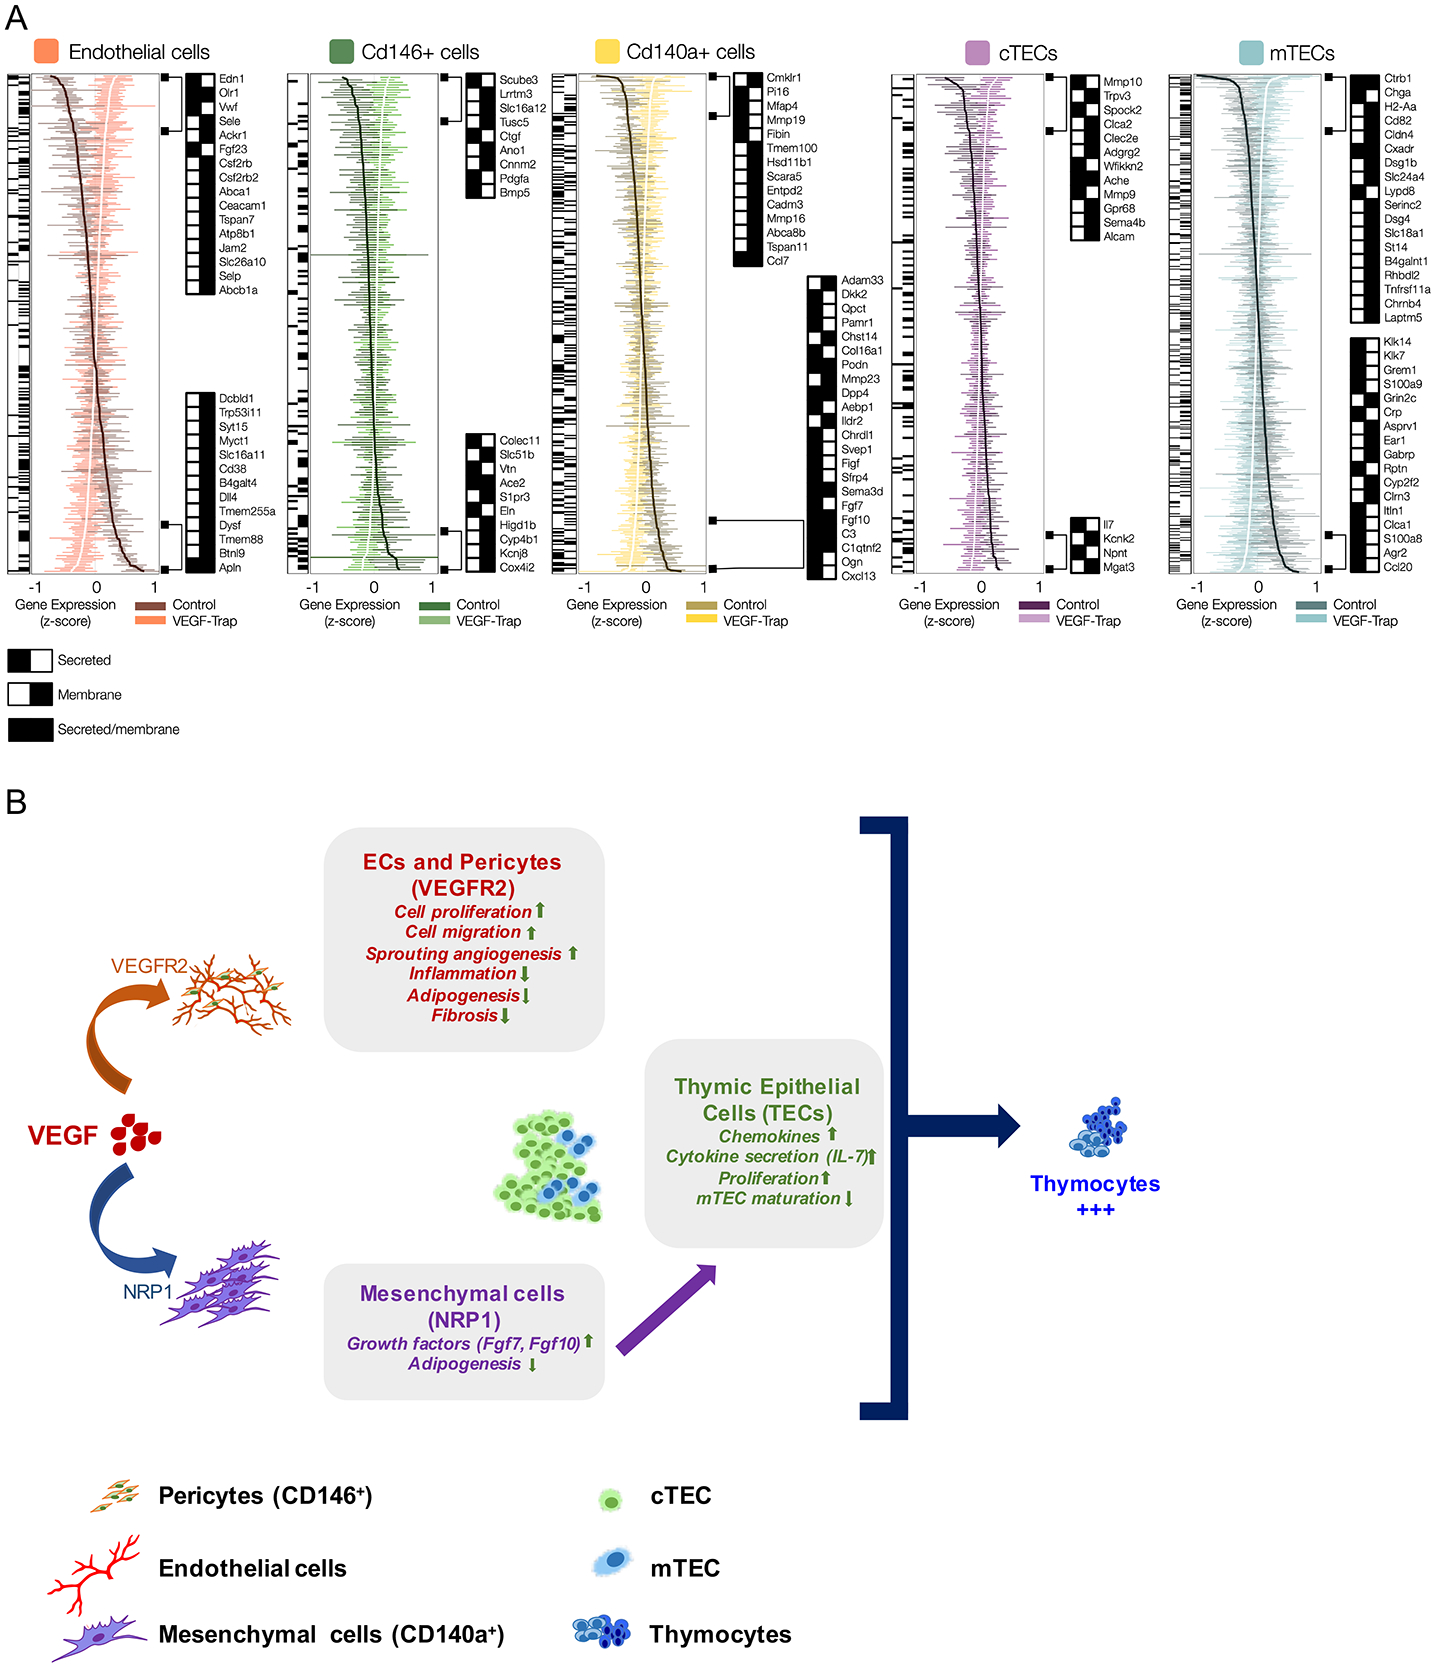
(A) Gene-wise boxplots of expression z-score distributions for signature genes identified in this study in all thymic stromal populations. Each box represents a gene’s z-score distribution for all samples in one experimental group (Control n = 2, VEGF-Trap n = 4). Line plots connect the mean z-score for all genes in each experimental group. For each cell type, the most regulated genes are shown ranked from highest up- (top) or down-regulation (bottom), 48 hours after VEGF-Trap treatment, and official mouse gene symbols are shown. Black/white heatmaps for all and selected genes provide secreted/membrane classifications from Uniprot, Protein Atlas and transmembrane TMHMM predictions. (B) Working model shows the impact on each thymic compartment of VEGF during neonatal life, based on data from VEGF inhibition and VEGF receptor blockade studies. Vascular and perivascular changes are mediated by VEGF directly through VEGFR2 (orange arrow), and the impact on TEC differentiation is mediated indirectly through NRP1, most likely through paracrine mechanisms (purple arrow) triggered through NRP1 signaling in CD140a+ mesenchyme (blue arrow). Importantly, all the stromal changes are seen within 48 hours of VEGF inhibition whereas thymocyte effects are delayed several days later, suggesting VEGF acts on thymocytes indirectly through the microenvironment. Blockade of both VEGFR2 and NRP1 is necessary for the reduction in thymocyte proliferation and survival, demonstrating the pleiotropic role of VEGF. Of note, this model does not preclude other interactions between the vascular and mesenchymal compartments.
Statistical Analysis
Descriptive Statistics such as number of observations, mean and standard deviation were reported and presented graphically for quantitative measurements. For comparing between two experimental groups, unpaired t test was used. Transformation of the data was performed if normality assumption was violated before statistical testing. For all statistical investigations, tests for significance were two-tailed. A p-value of less than the 0.05 significance level was considered to be statistically significant. Statistical analyses were carried out using statistical software SAS version 9.4 (SAS Institute Inc. 2013) and Prism6 (GraphPad).
Results
Isolation and characterization of rare thymic stromal populations from the neonatal thymus
The thymus is dominated numerically by hematopoietic cells (thymocytes) with stromal cells representing only ~1% of all cells in the organ. To identify and quantify the rare subpopulations of thymic stroma we used a modified version of the protocol previously described by Gray and colleagues (29–31). Gentle enzymatic digestion of postnatal day 1 (P1) wild-type (WT) mouse thymus followed by a magnetic-based CD45 depletion allowed us to enrich for neonatal stromal cells for further characterization (Figure 1A, 1B). Within the stromal cell gate, thymic epithelial cells (TECs) were identified by their expression of the epithelial cell adhesion molecule (EpCAM aka CD326) and were further subdivided into cortical thymic epithelial cells (cTECs) (mean=46.2% ± 4.2) and medullary thymic epithelial cells (mTECs) (mean=48.54% ± 4.2), based on high versus low/negative Ly51 expression, respectively (29, 39) (Figure 1A, 1C). Platelet endothelial cell adhesion molecule (PECAM-1 aka CD31) expression allowed the isolation of endothelial cells, representing 5.9 to 9.5% (mean= 7.78% ± 1.5) of the non-epithelial (EpCAMneg) stromal fraction (Figure 1A, 1D).
Figure 1. Identification and isolation of epithelial, mesenchymal and endothelial subpopulations of the neonatal thymic microenvironment.
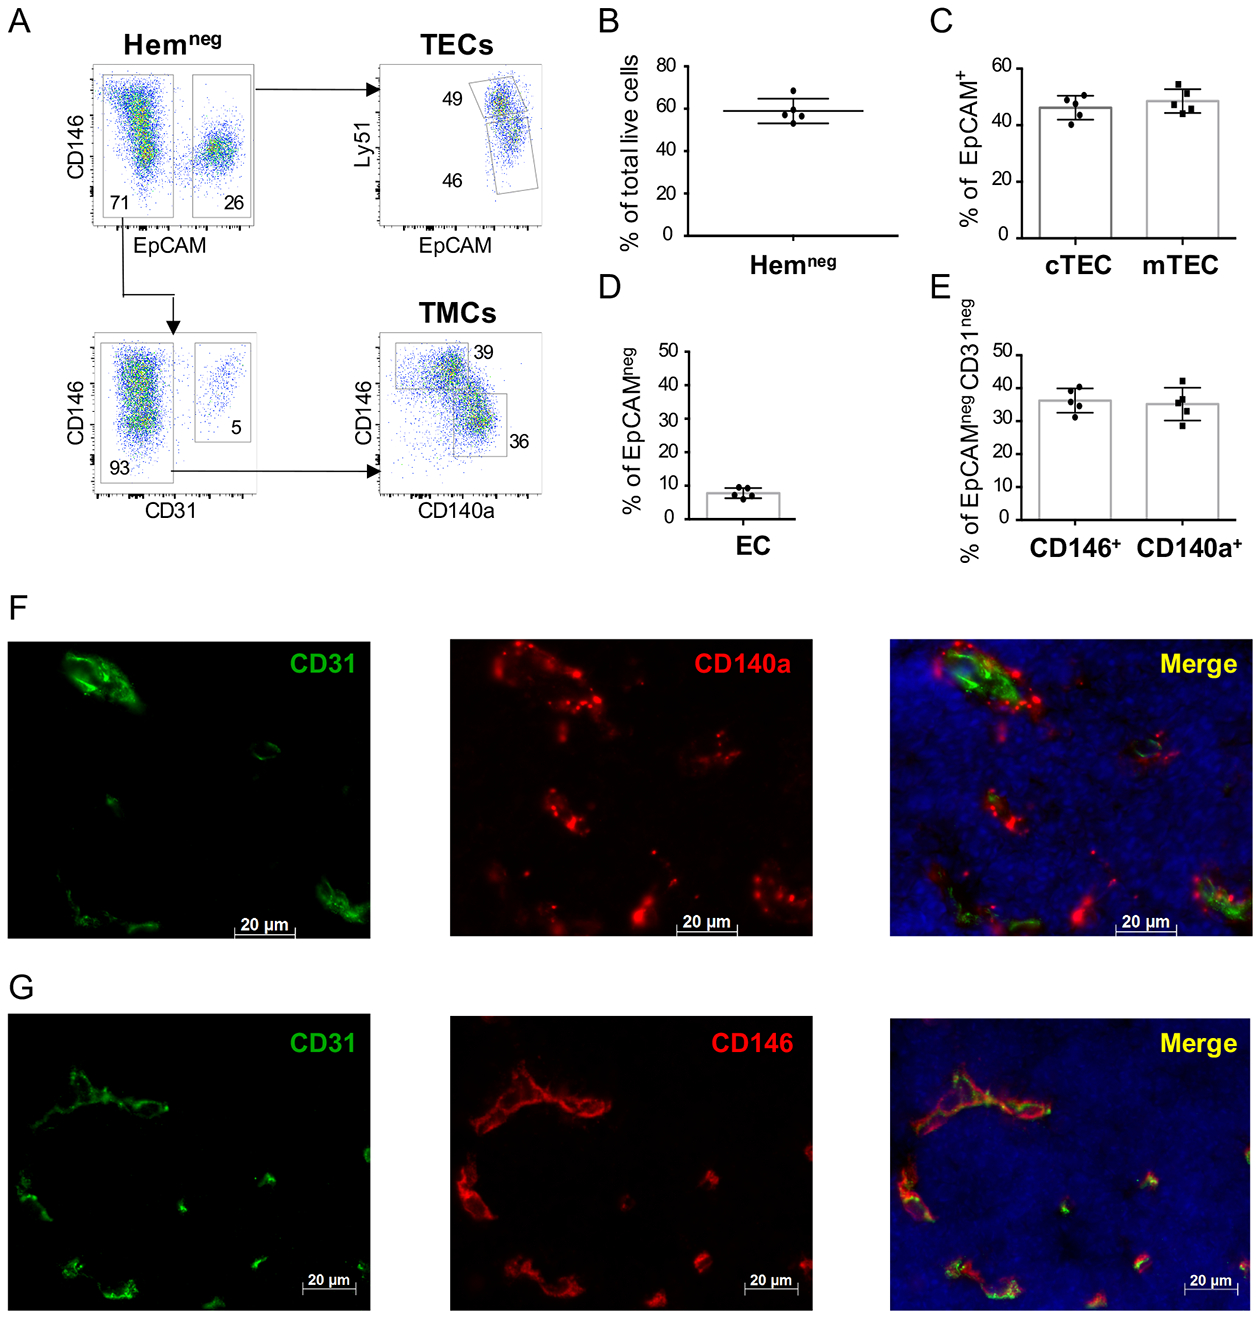
(A) Representative flow cytometry plots show the strategy for the segregation of thymic stromal subsets from neonatal (P1-P2) wild type (WT) thymi. After digestion and partial depletion of CD45+ cells using magnetic beads, live (DAPIneg) cells are gated as follows: stromal cells are defined initially by absent expression of the hematopoietic markers CD3, CD4, CD8, CD45 and TER119 markers (“Hemneg”) (top left panel). Within the Hemneg gate, epithelial cells are defined as EpCAM+ (top left panel), and are then subdivided into cTECs (Ly51+) and mTECs (Ly51lo/neg) (top right panel). Endothelial cells are defined as CD31+ cells within the EpCAMnegHemneg gate (lower left panel). Thymic mesenchymal cells (TMCs) are identified based on exclusion of hematopoietic, epithelial and endothelial populations (Hemneg EpCAMnegCD31neg) and express either CD146 or CD140a (lower right panel). Numbers represent the frequency of each population from their respective gates. (B-E) Bar graphs show a summary of the flow cytometry data in (A); (B) Percentage of all cells that fall into the “Hemneg” gate (defined as CD3−CD4−CD8−CD45−TER119− cells); (C) Percentage of cTEC and mTEC cells (within the HemnegEpCAM+ gate); (D) Percentage of Endothelial cells (ECs) (defined as CD31+) within the HemnegEpCAMneggate, (E) Percentage of CD146+ and CD140a+ mesenchymal cells within the HemnegEpCAMnegCD31neg gate. (n=5 P1 WT neonates analyzed separately in each experiment; data representative of >5 independent experiments). Error bars represent SD. (F-G) Immunofluorescence staining of representative thymic sections from P1 WT neonatal mice showing (F) the expression of CD140a (red), CD31 (PECAM) (green) markers and DAPI nuclear staining (blue), and (G) CD146 (red), CD31 (green) markers and DAPI (blue). All slides were obtained at 40X magnification. Scale bars=20μm.
Analysis of the non-endothelial, non-epithelial stromal fraction revealed the presence of two distinct subsets of thymic mesenchymal cells (TMCs) in the neonate. The thymus has been previously reported to contain mesenchymal cells that express the platelet-derived growth factor receptor alpha (PDGFRα aka CD140a), which are essential for the homeostasis, growth and function of TECs (40–43). CD140a+ TMCs represented only 28.6 to 42.2% of the EpCAMnegCD31neg stromal cells of the neonatal thymus (mean= 35.2% ± 4.9) (Figure 1A and Figure 1E). A separate population of cells expressing the melanoma cell adhesion molecule (aka CD146) was detected in the TMC population (Figure 1A) representing 31.2 to 40.4% of the EpCAMnegCD31neg stromal fraction in P1 neonates (mean=36.2% ± 3.7) (Figure 1E).
Stromal populations were isolated from neonatal thymus using the above flow cytometry strategy and validated using qPCR for cell specific genes. Consistent with previous studies (44–47) both cTECs and mTECs expressed Krt5 (keratin 5), but only mTECs expressed Aire (Supplemental Figure 1A). Foxn1 and Dll4 expression was also confined to TECs (particularly cTECs) (Supplemental Figure 1B).
Both CD146+ and CD140a+ thymic mesenchymal cells expressed Col6a3 (Collagen VI alpha chain 3), a microfibrillar protein also expressed by bone marrow mesenchyme (48) (Supplemental Figure 1A). High Fgf-7 and Fgf-10 expression was found on CD140a+ thymic mesenchymal cells, as expected (41), but expression of these genes was barely detectable on CD146+ cells (Supplemental Figure 1B).
Immunohistochemistry of thymic tissue showed that distribution of the two mesenchymal subsets was quite distinct (Figure 1F, G). CD140a+ cells were localized either loosely around larger blood vessels or were interspersed in thymic parenchyma and unassociated with vasculature (Figure 1F). In contrast, CD146+ cells were located exclusively in perivascular locations in close proximity to endothelial cells, a feature characteristic of “pericytes” previously identified in other tissues (49–51) (Figure 1G).
The murine thymic microenvironment undergoes distinct structural and functional changes during early postnatal maturation
We next determined the qualitative and quantitative changes that occur in the thymic stroma between the immediate postnatal period and early adulthood. At the time of birth the murine thymus is dominated histologically by the cortex with only small islands of medulla, whereas in adult mice the medulla represents the majority of the TEC compartment (27, 30, 52) and Supplemental Figure 2A. In line with the histological appearance, flow cytometry demonstrated a marked decrease in the frequency of cTECs relative to mTECs in young adults (5 weeks old) as compared to neonates (mean cTEC in adults=2.52% ± 0.48 of EpCAM+ cells; mean cTEC in neonates = 49.2% ± 1.2 of EpCAM+ cells), (Figure 2A, 2C and 2D). Thus, the cTEC:mTEC ratio fell significantly during maturation from neonates to young adults (p≤0.0001) (Supplemental Figure 2B).
Figure 2. Phenotypic and structural changes in stromal subsets mark the transition from neonatal to young adult thymus.
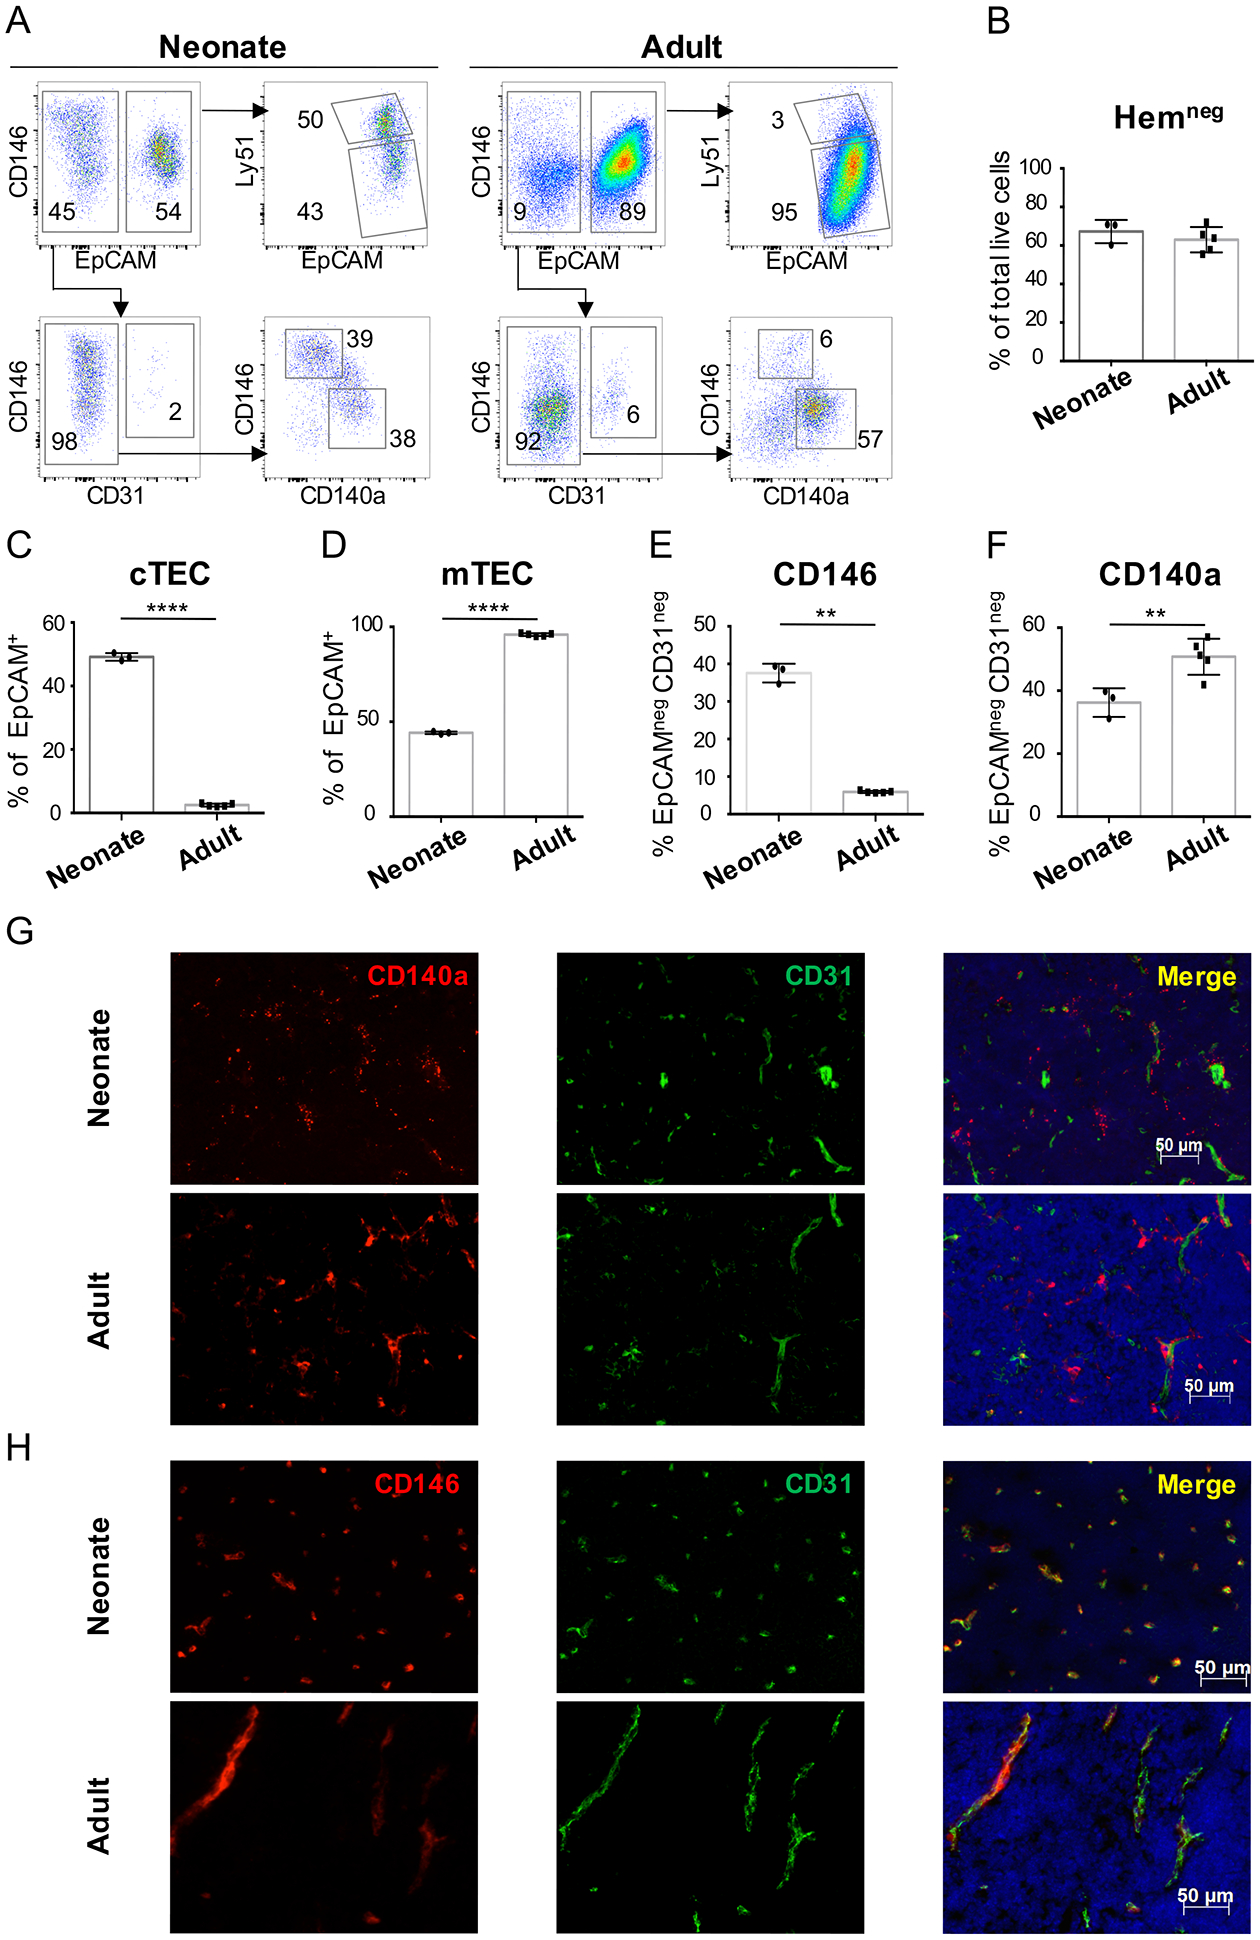
(A) Dot plots show representative flow cytometry analysis of thymus from neonatal (P1) and young adult (5-week-old) WT mice, after digestion and CD45 depletion and gating on CD3−CD4−CD8−CD45−TER119− cells. (B) Percentage of Hemneg gate (CD3−CD4−CD8−CD45−TER119−) within the live cell gate after CD45 depletion (C) Percentage of cTEC and (D) mTEC cells within the HemnegEpCAM+ gate; (E) Percentage of CD146+ and (F) CD140a+ mesenchymal cells within the HemnegEpCAMnegCD31neg gate. Data representative of > 5 independent experiments (n=3 neonates and n=5 adults). Error bars represent SD. (G-H) Immunofluorescent staining of thymic sections from neonatal (P1) and young adult (7-week-old) WT mice show the expression of (G) CD140a (red), CD31 (green) and DAPI (blue) and (H) CD146 (red), CD31 (green) and DAPI (blue). Magnification 20X. Scale bars=50μm.
Within the mesenchymal compartment, CD146+ and CD140a+ cells were present at similar frequencies in neonates (Figure 2A, 2E and 2F). In contrast, while CD140a+ frequency changed little, CD146+ cells were rare in the young adult thymus (Figure 2A, 2E and 2F), resulting in a significant increase in CD140a+:CD146+ ratios with maturation (p≤0.0001) (Supplemental Figure 2B).
In both age groups CD140a+ thymic mesenchymal cells were found interspersed in the thymic parenchyma with similar frequency (Figure 2G). CD146+ cells surrounded almost every capillary in the neonatal thymus, but were largely absent in young adults (Figure 2H), confirming that the increase in CD140a:CD146 ratio during maturation is due to a loss of CD146+ cells.
In addition to changes in the frequency of TEC subsets, gene expression of isolated cell types, particularly cTECs, also changed with maturation. Cxcl12, which encodes for a chemokine known to be important for thymocyte differentiation, proliferation and β-selection (53–55), was expressed exclusively in cTECs and significantly decreased within this population during the transition between neonate and young adult thymus (p≤0.05) (Supplemental Figure 2C). Expression of Ccl25, a chemokine crucial for thymocyte migration and Il-7, an essential cytokine for T cell differentiation and proliferation, also trended lower in cTECs during maturation (Supplemental Figure 2C). Hence, during postnatal development, relative loss of cTECs is combined with a decline in the expression of key factors essential for migration, proliferation and differentiation of thymocytes in the cTECs that remain.
Expression of Fgf7 and Fgf10 (key factors known to support TEC development (41)) in CD140a+ thymic mesenchymal cells was not affected during the transition between neonatal and young adult thymus (Supplemental Figure 2C).
Therefore, in addition to changes in the thymic endothelium (27) our data show that other thymic stromal compartments undergo dramatic changes during the transition from neonatal to young adult stages of development.
VEGF inhibition depletes early thymocyte stages
We have previously shown that thymocyte numbers are dramatically reduced by VEGF inhibition applied during the first few days of neonatal life; no effect is seen with inhibition given after the first 10 days. Because Vegfa is expressed by all thymic stromal cell subsets (46) (Figure 3A), we used a pharmacological (lineage-agnostic) approach to assess how the global inhibition of VEGF alters thymopoiesis in the neonate. We treated P1 mice with either Aflibercept (aka VEGF-Trap), a VEGFR1/R2 fusion protein which acts as a decoy molecule for all VEGF-A isoforms, or an hFC control antibody and analyzed thymi two-days post-injection (P3) (Figure 3B). At this early time point, no significant change in thymocyte numbers was seen (Figure 3C). However, inhibition of VEGF prevented the normal increase in thymocytes numbers seen over the next 5 days (P8) (Figure 3C, p≤0.05).
Figure 3. VEGF blockade in the neonatal thymus decreases thymocyte proliferation and survival.
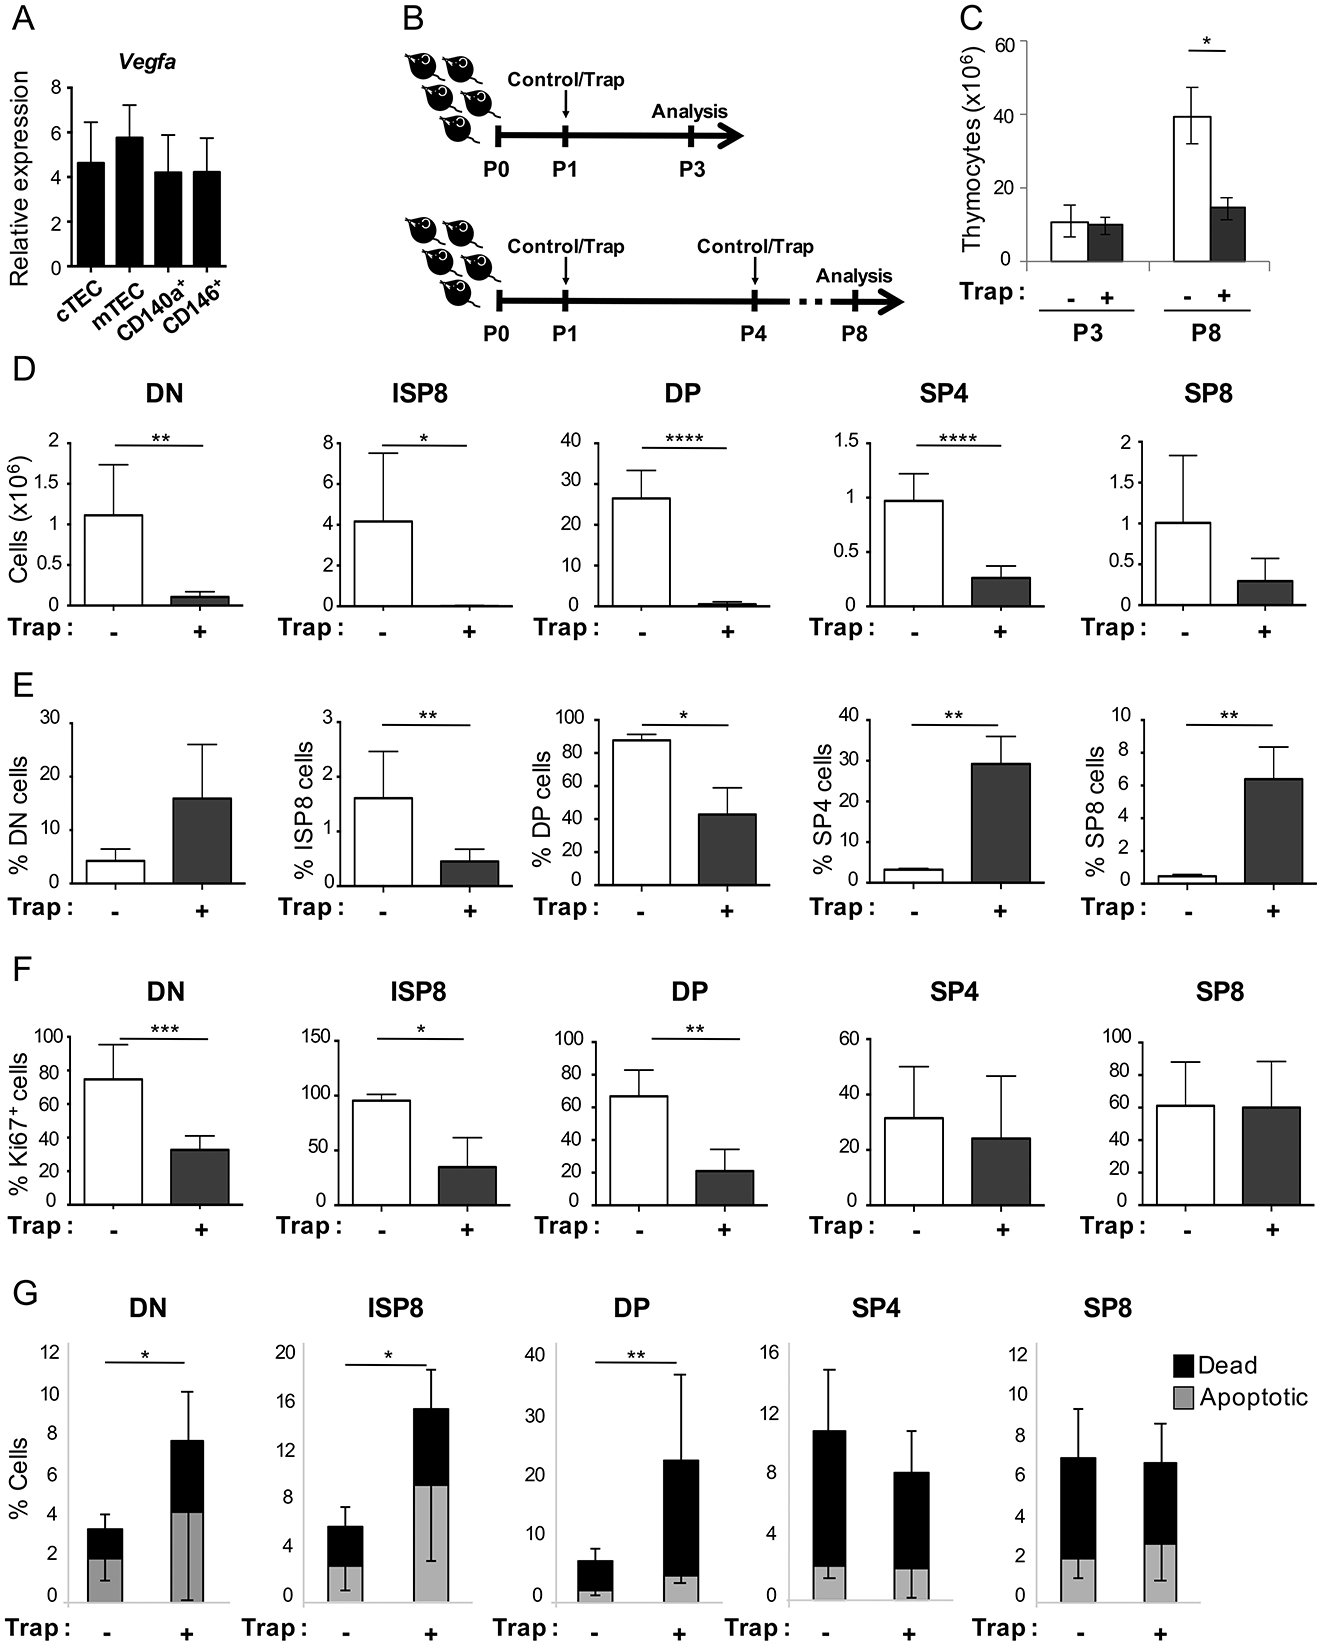
(A) Expression of Vegfa by qRT-PCR in P1 WT neonatal mice, normalized to Rpl13a (± SEM). (n=6–8 mice/experiment, 3 independent experiments are shown). (B) Schematic shows the time line for VEGF-trap treatment and analysis of neonatal WT mice. Control mice received hFc antibody and “Trap” mice received VEGF-Trap (Aflibercept) both at 25 mg/kg and via intraperitoneal (IP) injections. For short-term experiments, neonates received a single IP injection at P1 of either control of VEGF-Trap and thymi were analysed at P3 (upper schema); for extended experiments, neonates received an IP injection at P1 and P4, of either control of VEGF-Trap and thymi were analysed at P8 (lower schema). (C) Bar graphs represent total thymocyte numbers from control (white bars) and VEGF-trap (grey bars) treated neonatal WT mice, analysed at P3 and P8. (P3: control n=3, VEGF-trap n=4 mice; P8: control n=4, VEGF-trap n=5 mice) *p≤0.05 (D) Bar graphs represent the number of DN, ISP8, DP, SP4 and SP8 thymocyte populations in control (white bars) as compared to VEGF-Trap (grey bars) treated mice analyzed at P8. (Double-negative: DN, Immature Single Positive: ISP8, Double-positive: DP, Single-Positive: SP4 and SP8). (E-G) Summary of flow cytometry analysis of CD45+ thymocytes harvested at P8. (E) Percentage of thymocyte subsets within the CD45+ population. (Double-negative: DN, Immature Single Positive: ISP8, Double-positive: DP, Single-Positive: SP4 and SP8). Control (white bars) and VEGF-Trap (grey bars). (F) Percentage of Ki67+ cells in control (white bars) and VEGF-Trap (grey bars). (G) Percentage of dead (black bars) and apoptotic (grey bars) cells. (D-G) *p≤0.05, **p≤0.01, ***p≤0.001, ****p≤0.0001 (control n=8, VEGF-trap n=4 mice). Error bars represent SD.
Thymocyte subset analysis at P8 showed that although absolute numbers of all thymocyte subsets were decreased (Figure 3D), the impact of VEGF-inhibition was most profound on earlier thymocyte stages. VEGF inhibition caused a significant fall in the frequency of immature single positive CD8 (ISP8) thymocytes and double positive (DP) thymocytes (Figure 3E). Secondary to the massive drop in the frequency of DP cells, a corresponding increase was seen in the percentage of single-positive CD4 (SP4) and SP8 thymocytes; the change in DN frequency was not statistically significant (Figure 3E).
Consistent with the above data, Ki67 analysis revealed that VEGF-inhibition significantly decreased proliferation of early thymocyte populations i.e. DN (p≤0.001); ISP8 (p≤0.05); DP (p≤0.001) but did not change proliferation of mature SP4 and SP8 thymocytes (Figure 3F). VEGF inhibition also significantly increased cell death in DN, ISP8 and DP but the more mature SP4 and SP8 were again not affected (Figure 3G).
As Kdr (which encodes VEGFR2 the pro-angiogenic kinase receptor for VEGF-A), is not detected on murine or human thymocytes (27, 35), we reasoned that VEGF does not modulate thymocyte survival and proliferation directly but rather as a secondary effect via the thymic microenvironment. We therefore next analyzed the effects of VEGF inhibition on different thymic stromal populations in neonatal mice.
VEGF inhibition in neonates induced rapid changes in the thymic microenvironment similar to physiologic postnatal maturation
Consistent with its major role in angiogenesis, VEGF inhibition significantly and rapidly reduced the frequency of endothelial cells as early as P3 (p≤0.05), with effects sustained at least until P8 (p≤ 0.05) (Figure 4A). The ratio of cTEC:mTEC was also significantly reduced as early as P3 (p≤ 0.05) persisting at P8 (p≤ 0.01) (Figure 4B), reflecting a shift from predominance of cTECs to mTECs. Proliferation of both TEC subsets decreased with VEGF inhibition (p<0.05) (Figure 4D).
Figure 4. VEGF inhibition in neonates induces changes to TEC and TMC compartments similar to developmental maturation.
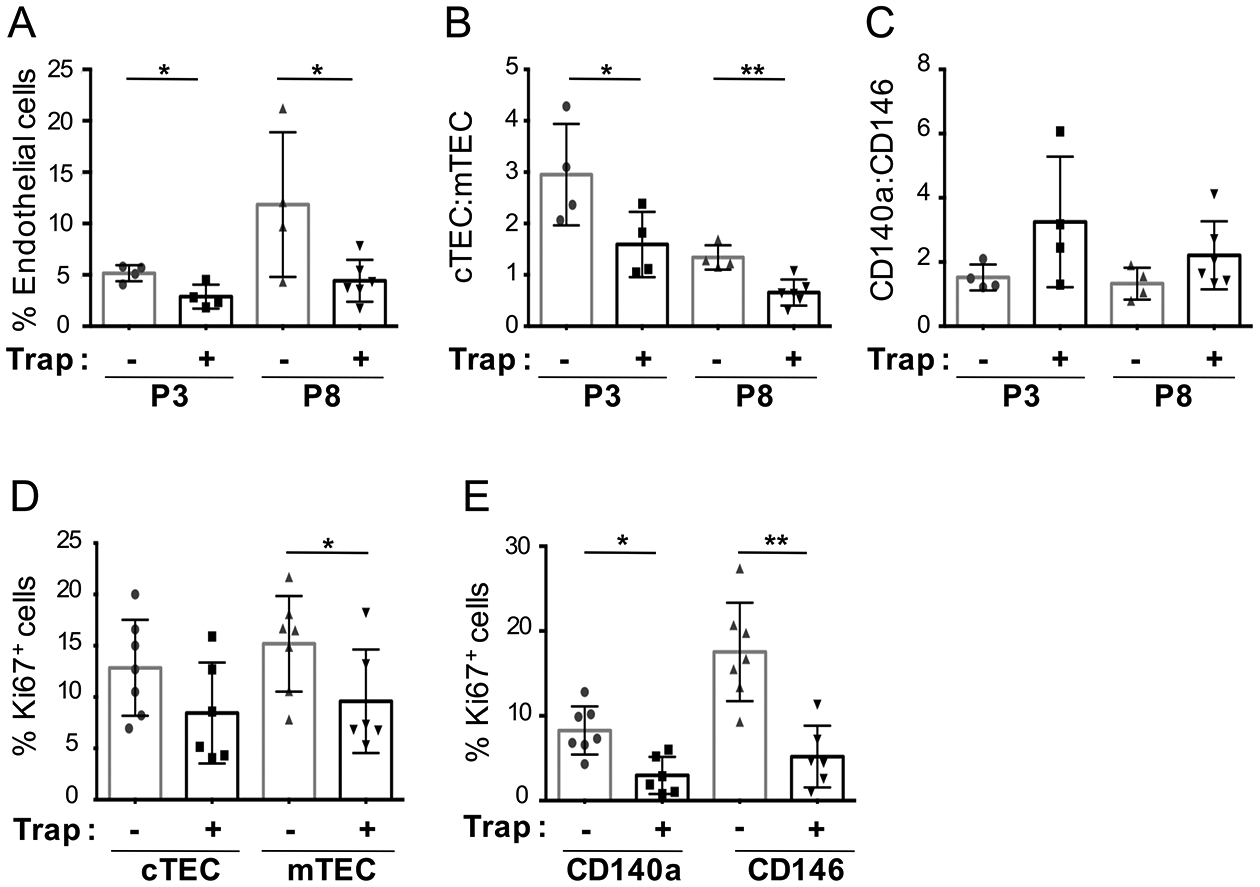
(A) Percentage of endothelial cells, in mice treated with control or VEGF-Trap and analyzed by FACS at P3 and P8. (B-C) Ratio of thymic stromal subsets (TECs and TMCs respectively), in mice treated with control or VEGF-Trap, and analyzed by FACS at P3 and P8 (P3: control n=4, VEGF-Trap n=4; P8: control n=4, VEGF-Trap n=6. (D-E) Cell cycle analysis of TEC and TMC populations (control n=7, VEGF-Trap n=6) based on the percentage of Ki67+ cells from neonatal mice treated at P1 with control or VEGF-Trap and analyzed at P3. (A-E), Error bars represent SD. (*p≤0.05, **p≤0.01, ****p≤0.0001).
Similarly, the ratio of mesenchymal cell subsets changed rapidly following VEGF inhibition. CD140a:CD146 ratios trended higher in VEGF-Trap-treated mice as compared to control, at both P3 and P8 (Figure 4C), and cell cycling of mesenchymal populations was also markedly reduced in VEGF-Trap-treated mice (CD140a+ p<0.05) and (CD146+ cells p<0.01) (Figure 4E). Thus, VEGF inhibition in the neonatal thymus induced rapid changes not only in endothelium, but also in TEC and mesenchymal compartments, as attested by a decrease in cTEC:mTEC ratios and an increase in CD140a:CD146 ratios, and these occurred prior to the decrease in thymopoiesis. Moreover, the stromal changes seen with VEGF inhibition mirrored the physiological changes normally seen during the transition from neonatal to young adult stages of thymic development.
Blockade of specific VEGF receptors recapitulates distinct elements of thymic maturation
VEGFR1 and VEGFR2 are the anti- and pro-angiogenic receptors for VEGF-A, respectively, and Neuropilin-1 (NRP1) has been shown to act as a co-receptor for VEGFR2 (56). High levels of Flt1 (which encodes VEGFR1) and Kdr (which encodes VEGFR2) were found almost exclusively on thymic endothelial cells; only CD146+ pericytes also expressed detectable Kdr, albeit at very low levels relative to endothelium (Figure 5A). However, Nrp1 was expressed at similar levels on CD146+, CD140a+ and endothelial cells. Of note, neonatal TECs did not express detectable levels of Flt1, Kdr or Nrp1 (Figure 5A).
Figure 5. Stromal and thymocyte effects of VEGFR2 and NRP1 blockade.
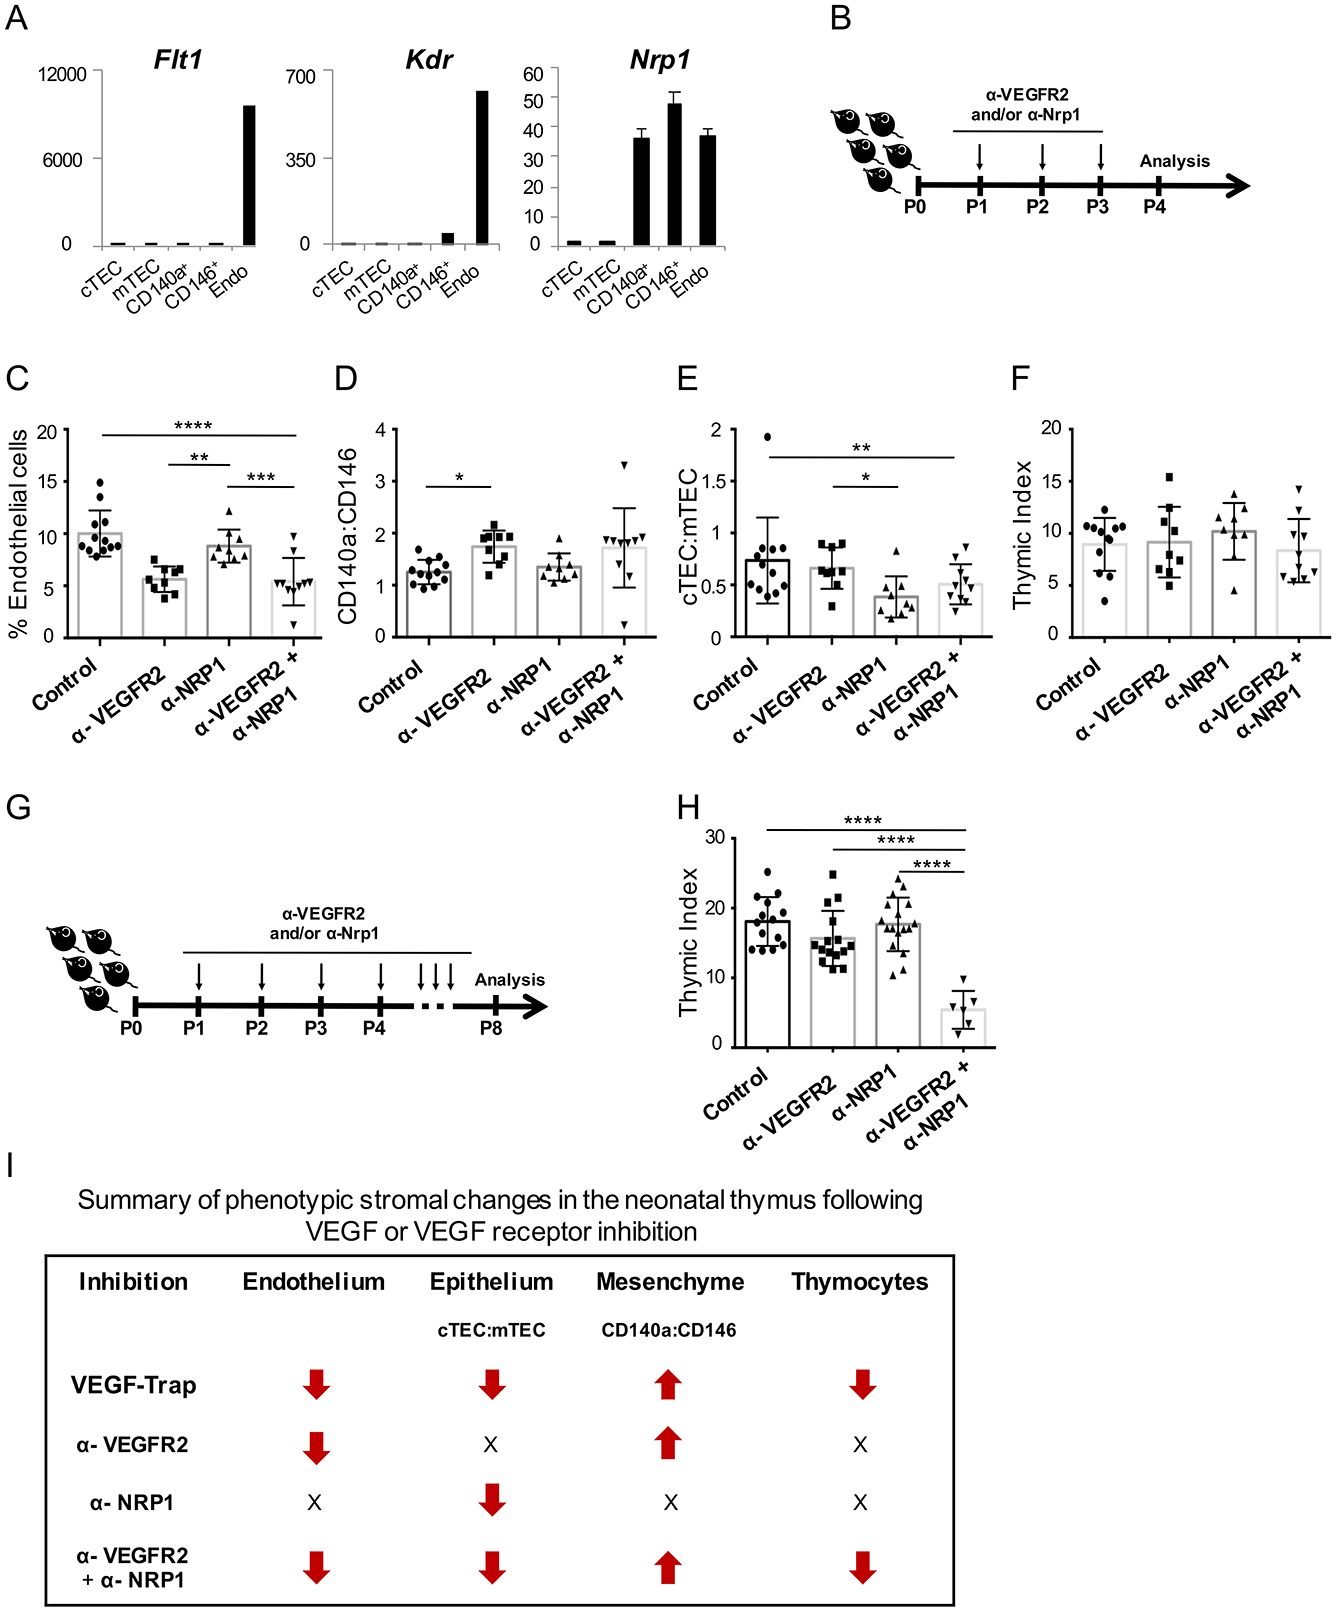
(A) Expression of Flt1, Flk1 and Nrp1 (± SEM) in the neonatal thymic stroma by qRT-PCR (n=2). (B) Schematic of VEGFR2 and NRP1 blockade for data in (C-F). (C) Percentage of thymic stromal cells that were endothelial (CD31+) (n≥9 mice/group). (D-E) Bar graphs show the ratio of cTEC:mTEC (n≥9 mice/group) and CD140a:CD146 respectively. (F) Thymic index (number of thymocytes (x106)/body weight (grams)) from treated neonatal mice at P4. (G) Schematic of VEGFR2 and NRP1 blockade in neonates, analyzed at P8. (H) Bar graph shows the thymic index from neonatal mice analyzed at P8. (I) Summary of phenotypic changes within each stroma subset and thymocytes, following VEGF-Trap or VEGF-receptor blockade. Arrows indicate the increase or decrease in frequency (% endothelial cells), ratios (epithelium and mesenchyme) or thymocyte numbers relative to control samples; X= no change. Error bars represent SD. *p<0.05, **p<0.01, ***p<0.001, ****p<0.0001.
To determine which receptor(s) are necessary for VEGF’s effect on the thymic microenvironment, we treated neonatal mice daily with control or blocking antibodies to VEGFR2 (α-VEGFR2) and/or NRP1 (α-NRP1) (Figure 5B). After 3 days of treatment, VEGFR2 blockade produced a significant drop in endothelial cells (p≤0.0001). NRP1 blockade alone had no effect on endothelial cells and did not further reduce their frequency when added to VEGFR2 blockade (Figure 5C).
VEGFR2 blockade also affected thymic mesenchyme, increasing the CD140a:CD146 ratio (p<0.05 for control versus α-VEGFR2); however, no effect was seen on mesenchymal cell ratios with α-NRP1 with or without α-VEGFR2 (Figure 5D). Interestingly however, α-NRP but not α-VEGFR2, significantly decreased the cTEC:mTEC ratio (p<0.01); adding α-VEGFR2 to α-NRP did not further change TECs (Figure 5E).
We next examined whether VEGFR2 and/or NRP1 blockade recapitulated the effects of VEGF inhibition on thymocytes (Figure 3). Similar to treatment with VEGF-Trap, no significant changes to the thymocyte compartment were detected early (P4) with blockade of either receptor alone or in combination (Figure 5F). However, a significant decrease in thymocyte numbers was again found at P8, but only in neonates treated with the combination of α-VEGFR2 and α-NRP1 (p≤0.0001) (Figure 5G, 5H). Thus, VEGF’s effects on each stromal compartment are mediated differentially through VEGFR2 and NRP1, and are summarized in Figure 5I.
VEGF inhibition induces distinct transcriptional changes in stromal populations
To evaluate the earliest transcriptional impact on each compartment of the neonatal thymus after VEGF inhibition, we performed RNA-Seq on stromal subpopulations from 3-day old (P3) mice that were treated 48 hours earlier with VEGF-Trap or control. Principal component analysis (PCA) showed that the global transcriptional profile of each stromal compartment remained similar in P3 mice whether treated with VEGF-Trap or control, demonstrating that the phenotypic identity of each population remained unchanged (Figure 6A). Unsupervised analysis of cell population-specific genes using pooled data from control- and VEGF-Trap-treated animals, recapitulated the specificity of known signature genes for each population (e.g. for TECs: Foxn1, Epcam, Krt5, Dll4; mTECs: Aire; endothelium: Pecam1; endothelium and pericytes: Mcam; CD140a+ TMCs: Col6a3, Pdgfra, Fgf10 and Fgf7, among others) (Supplemental Table 1). Functional analysis using the pool of all signature genes revealed significant enrichment in a number of functional categories including: cAMP signaling and smooth muscle for CD146+ pericytes; Extra cellular matrix (ECM) in CD140a+ mesenchyme; cell-cell adhesion in both cTECs and mTECs; and cytokine secretion and MHC genes in mTECs (Figure 6B and Supplemental Table 1). Combination of all these pathways formed a connected network that defines the collective functional behavior of the neonatal thymic stroma (Supplemental Figure 3A).
The specific transcriptional responses to VEGF inhibition for each population were examined using two approaches. First the analysis was performed on all genes without regard to the signature gene patterns identified above. Differential expression analysis between treated and control samples revealed moderate transcriptional changes overall (N = 402, 333, 254, 160 and 247 differentially [up or down] expressed genes in endothelial, CD146+, CD140a+, cTEC and mTEC cells respectively, Wald test p-value<0.05) (Supplemental Table 1). Of note, in all stromal populations, functional processes related to cell-cell signaling and tissue integrity (e.g. cell-cell adhesion, extracellular matrix, focal adhesion and epithelium development) were significantly enriched after VEGF inhibition (Figure 6B) (hypergeometric p-value < 0.01, Supplemental Table 1).
As expected, cell cycle-related genes were dysregulated in both endothelium and CD146+ pericytes (cell types which showed the most prominent numerical loss with VEGF-Trap); these genes included those involved in mitotic spindle assembly (Kif11, Kif4, Kif23), cell cycle checkpoint (Clspn, Bub1, Mad2l1), DNA replication (Mcm3, Lig1, Atad5, Cdt1) and cyclin-dependent kinases (Cdks) (Figure 6C, 6D and Supplemental Table 1). Of note, enrichment in cell cycle related genes was not seen in CD140a+ or TECs. VEGF-inhibition also induced changes in endothelial cells in genes associated with vascular permeability and remodeling (Vwf, Enpp2, Ptprj, Tgfa, Pdgfa, Pdgfra, Rhou) (Figure 6C). Interestingly, endothelial cells also consistently upregulated genes involved in thymocyte trafficking and inflammatory response (Il6st, Edn1, Tnfrsf11a, Fbn1, Il4ra).
In addition to the cell cycle genes previously mentioned, CD146+ pericytes also showed consistent up-regulation of mesenchymal-specific genes involved in vascular development and stress response (Col6a2, Chl1, Gstm1, Nfatc2, Ptger3, Fabp4) (Figure 6D). Moreover, genes involved in adipogenesis were enriched after VEGF inhibition in both types of TMCs; in CD146+ cells VEGF inhibition induced up-regulation of Ppar-γ a key activator of adipocyte expansion from adipose progenitor cells in vascular niches via Pdgfrb and Vegf (57) (Figure 6D). A general response by the CD140a+ mesenchyme to impaired vascular growth was reflected by the dysregulation of several genes involved in vascular and tissue remodeling (Ret, Flrt3, Serpina3n, Ptk7, Pgf, Cd151, Stc1) (Supplemental Figure 3B).
Although TECs had no detectable expression for either Kdr or Nrp1, transcriptional changes were seen in these cells within 48 hours of VEGF inhibition with chemokine, chemotaxis, ECM, cell migration and MAPK among the pathways enriched (Figure 6B). cTECs showed a particular enrichment for genes annotated in T-cell differentiation pathways and cytokine secretion (Ccl21a, Skint4, Dpp4, among others) and thymus development, notably Plet1 a marker of early thymic epithelial progenitors (Supplemental Figure 3B). Within the mTEC population, VEGF inhibition triggered a high enrichment in chemokine and leukocyte chemotaxis (e.g. Cd151, Ephb4, Ccl20) (Supplemental Figure 3B).
A separate analysis was performed to see if VEGF inhibition changed expression of cell population-specific i.e. signature genes (Figure 7A). CD146+ TMCs showed mild but consistent upregulation of several secretory genes (Scube3, Ctgf, Pdgfa and Bmp5) all of which are involved in fibrosis and TGF-β signaling and are known to provide differentiation signals from the mesenchyme to the neighboring epithelium in the thymus and epidermis (58, 59). Downregulation of multiple secretory genes involved in tissue and vascular structure (Eln, Ace2 and Vtn) was consistent with a reduced capacity of CD146+ TMCs to support endothelial structure after VEGF inhibition. In CD140a+ cells, Wnt signaling and lymphatic growth genes (Ogn, Ctrp2, Sema3d, Sfrp4, Vegfd, Svep1 and Dkk2) were decreased in CD140a+ TMCs (Figure 7A). Interestingly, both Fgf7 and Fgf10 were also downregulated in this population, revealing that VEGF influences growth factor pathways known to support TECs in CD140a+ TMCs, possibly through NRP1.
While only few cTEC signature genes (notably Il7) were down-regulated, mTECs were found to be more transcriptionally responsive to VEGF inhibition; indeed, we observed a positive shift in the expression of genes encoding membrane markers of mature, terminally differentiated mTECs (H2-Aa, Cd82, Cldn4, Dsg1b, Dsg4, Slc18a1, B4galnt1, Rhbdl2, Tnfrsf11a/RANK, Chrnb4 and Laptm5) (60) (Figure 7A). In addition, changes in mTEC-specific genes involved in ECM structure and thymocyte migration (Ctrb1, Cxadr, Ccl20, S100a8/9 and Klk7/14 among others) were also seen after VEGF inhibition (Figure 7A).
Taken together, these results reveal that removing VEGF from the neonatal thymus induces rapid and distinct structural, functional and transcriptional responses in all stromal subsets. Our transcriptome analysis of a VEGF deprived microenvironment and receptor blockade experiments not only shows that VEGF mediates direct vascular effects (through VEGFR2) in endothelial and pericytes, promoting angiogenesis and preventing inflammatory, adipogenic and fibrotic pathways, but also regulate the epithelial compartment via CD140a+ TMCs (through NRP1). Moreover, while the disturbance of VEGF regulated pathways in each compartment is not enough to later affect thymocytes, combined VEGF inhibition in vascular (endothelial and pericytes), mesenchymal and epithelial thymic stromal cells are necessary for TEC growth, homeostasis and function in thymocyte proliferation and survival, ultimately highlighting the profound and pleiotropic role of VEGF during postnatal thymic development (Figure 7B).
Discussion
We have previously shown that the neonatal thymus secretes high levels of VEGF and that, despite a lack of VEGF receptor expression, thymocyte numbers fall dramatically with VEGF inhibition (27). Thus, in the current study, we focused on the mechanism by which neonatal thymopoiesis is VEGF-dependent. As VEGF is expressed during neonatal life in multiple lineages, we chose to use pharmacologic inhibition and found that removal of this stimulus produces rapid and profound remodeling of the thymus, accelerating maturation of thymic epithelium, inducing medullary dominance over the cortex, and remodeling the vascular and perivascular compartments of the thymus.
While the move to mTEC predominance occurs normally during the transition from a neonate to young adult thymus (27, 52), these changes were significantly accelerated by VEGF blockade. Changes in TECs induced by VEGF inhibition were recapitulated by NRP1 (but not VEGFR2) blockade; thus TEC “maturation” after VEGF inhibition was independent of the VEGFR2-mediated vascular and perivascular responses. The transcriptional up-regulation of hallmark genes of terminally differentiated mTECs with VEGF inhibition could indicate that, through its effects on non-epithelial components, high levels of VEGF in the neonate inhibit mTEC development and maturation.
The lack of either Kdr or Nrp1 expression in TECs suggests strongly that the mechanism for any VEGF effect on TECs is mediated indirectly through a non-epithelial population. Furthermore, the ability of NRP1 but not VGEFR2 blockade to recapitulate the effects on TECs, points to a non-endothelial cellular mediator. We propose that the most likely cell type to mediate VEGF’s effect on TECs is the CD140a+ mesenchyme a population which expresses NRP1 and is known to be essential for embryonic TEC development (41, 42). While the distribution and frequency of CD140a+ thymic mesenchymal cells did not appear to change, VEGF inhibition produced consistent changes in the expression of both signature and non-signature genes in CD140a+ TMCs, notably those involved in cell adhesion, chemotaxis, cell migration pathways, as well as adipogenesis, inflammation and known TEC-supporting growth factors.
In addition to their role in angiogenesis through VEGF binding, Neuropilins have also been identified as co-receptors for Semaphorins, a family of 20 different secreted and membrane bound glycoproteins involved in vasculogenesis, angiogenesis and neuronal axon growth (reviewed by (61)). Class 3 semaphorins (SEMA3) signal through NRP1 and are expressed by all stromal populations in the neonatal thymus, including TECs (62), (63) (and data not shown), but while few studies have shown that semaphorin (expressed by TECs)-neuropilin (expressed by thymocyte) interactions create a repulsive gradient responsible for thymocyte migration (62), (63) little is known about their exact role in the non-epithelial components of the thymic microenvironment. Another possible explanation for the effects of NRP1 blockade on TEC ratios is that this signaling pathway participate to the cross-talk between NRP1-expressing CD140a+ mesenchyme and semaphorin-expressing TECs.
Importantly, a delayed yet dramatic reduction in thymocyte cellularity followed the microenvironmental changes induced by VEGF inhibition. More specifically, early stages of thymopoiesis were significantly affected, as thymocyte precursors suffered both loss of proliferation and increase in apoptosis; no effect on mature thymocytes was observed. T-cell lineage commitment and maximal proliferation occur in the cortex through expression on cTECs of Notch ligands, chemokines and cytokines. Thus, the shift in TEC subsets toward mTEC at the expense of cTECs seen with VEGF inhibition (and normal maturation from neonatal to adult life), might be expected to mediate a reduction in thymocyte output. Not only were cTECs reduced in number but in those cTECs that remained after VEGF inhibition, significant downregulation of several key ligands and chemokines critical for early thymopoiesis was seen, including Dll4 and Il7, and ECM degradation and calcium binding/transport genes were upregulated, adding further to the loss of signals required for normal T-cell progenitor recruitment, thymocyte migration and output (64–66).
It has long been understood that signals from differentiating thymocytes foster the development and maintenance of the TEC compartment (67). It is still possible that VEGF could induce changes on TECs through altering influx or behavior of thymocyte subsets, such as Tregs and immature thymocytes which have been reported to express NRP1 (62, 68, 69). However, given the timing of the effects, (i.e. the reversal of cTEC:mTEC ratios before any change in thymocyte numbers), and also the absence of changes in thymocyte numbers with anti-NRP1, it seems unlikely that thymocytes significantly contribute to VEGF-mediated changes in TECs.
Endothelium showed the strongest transcriptional responses to VEGF inhibition, with a predominance of membrane-bound proteins and genes known to be associated with endothelial transport, angiogenesis and response to vascular damage. Endothelial-derived BMP4 has been previously shown to promote TEC regeneration following irradiation (70). While we did not see a significant increase in Bmp4 transcription in endothelial cells after VEGF-inhibition, Bmp6 expression increased in CD146+ pericytes suggesting the potential involvement of additional ligands in this context.
VEGF and Notch signaling cooperation is instrumental for angiogenesis: indeed VEGFR2 signaling induces DLL4 expression on endothelial tip cells, and promotes Notch-dependent endothelial stalk cell sprouting (reviewed by (71)). Downregulation of markers of tip endothelial cells such as Dll4, Apln and Trp53i11 (72) and up-regulation of markers of stalk endothelial cells (Selp, Jam2, Tspan7, Ackr1, Vwf) was also detected following VEGF inhibition, reflective of a reduction in sprouting angiogenesis (73). Although deletion of Dll4 in TECs (with intact expression in the endothelium) is sufficient to impair (74), one cannot exclude the possibility that alteration of endothelial DLL4 expression might also produce subtle local effects on thymopoiesis (75).
An intriguing finding was the up-regulation of pro-inflammatory and pro-adipogenic genes in endothelial cells and pericytes following VEGF inhibition, notably Ppar-γ which has been previously shown to promote thymic epithelial senescence in both mice and human (76). Inflamm-aging has been being tightly associated with thymic involution (77, 78), and similar features are found in the context of thymic insults such as infections (79, 80). Our data raise the possibility that, in addition to regulating the maturation of the thymic microenvironments, VEGF might have a role in suppression of inflammatory and adipogenic pathways in the neonatal thymus.
Although transcriptomic analysis showed that multiple pathways in all stromal subsets were altered by VEGF inhibition, the magnitude of these early changes were modest. Given the rapidity of the morphological changes seen after VEGF inhibition, it is likely that VEGF also mediates other, as yet unidentified, pathways at a post-transcriptional level.
A previous report showed TEC-specific ablation of Vegfa in embryos disrupted thymic vascular architecture but did not alter peripheral T cell numbers or phenotype; effects on TEC differentiation were not mentioned. As all stromal subsets of the neonatal thymus expressed VEGF, a likely explanation for the lack of impact on thymopoiesis in this model is that VEGF expression from non-TEC populations was unaltered (46). Nonetheless these data support our contention that vascular effects during development are likely insufficient to explain the impact of VEGF on thymopoiesis. Interestingly, within the fetal thymus, levels of Foxn1 have been shown to correlate with thymic vasculogenesis and VEGF expression, in a dosage-dependent manner (81). These findings again demonstrate the complexity of the communication network between the vascular and non-vascular compartments of the thymic stroma.
Importantly, the effects of VEGF inhibition on the neonatal thymic microenvironment we present here have not been seen in the adult thymus, as previously reported by us (27), (28), and others in additional organ systems (kidney, heart, liver) (32), further confirming that VEGF’s effects are specific/restricted to early postnatal development.
Identifying signals driving the growth and differentiation of stromal cells is key in the quest to regenerate the thymic microenvironment and ultimately thymopoiesis. Altogether, our data here provide new evidence on the pleiotropic activity of VEGF within the developing thymic microenvironment, showing for the first time the ability of this potent factor to regulate the growth, function and maturation across the stromal landscape of the thymus.
Supplementary Material
Key points.
VEGF acts directly and indirectly on stromal compartments of the neonatal thymus.
VEGF mediates its pleiotropic effects via both VEGFR2 and NRP1.
VEGF inhibition induces phenotypic and transcriptional neonatal thymic maturation.
Acknowledgements
We gratefully acknowledge the expert technical assistance of Felicia Codrea, Jessica Scholes and Jeffery Calimlim from the UCLA Broad Stem Cell Research Center (BSCRC) Flow Cytometry Core; The Technology Center for Genomics and Bioinformatics (TCGB) at UCLA; The Translational Pathology Core Laboratory (TPCL) at UCLA. We thank Dr. Christopher Seet for valuable discussion and critical reading of the manuscript.
This work was supported by the National Institute of Health (NIH Bethesda, MD) grants RO1 AG049753 (NIA), R21 AI119927 (NIAID), 5P30AG028748 (NIA), UL1TR000124 (NCATS/UCLA CTSI) (D.C), P30CA016042 (NCI) (TCGB and TPCL cores); CIRM RM1-01707 (G.M.C); St. Baldrick’s Fellowship Award (B.T.S).
Abbreviations used in this article:
- cTEC
cortical TEC
- DN
Double Negative
- DP
Double Positive
- EpCAM
Epithelial Cell Adhesion Molecule
- GO
Gene Ontology
- Mel-CAM
Melanoma Cell Adhesion Molecule
- mTEC
medullary TEC
- NRP1
Neuropilin 1
- PCA
Principal Component Analysis
- PDGFRα
Platelet Derived Growth Receptor Alpha
- PECAM-1
Platelet Endothelial Cell Adhesion Molecule-1
- RNA-Seq
RNA Sequencing
- SP
Single Positive
- TEC
Thymic Epithelial Cell
- TMC
Thymic Mesenchymal Cell
- VEGF
Vascular Endothelial Growth Factor
- VEGFR1
Vascular Endothelial Growth Factor Receptor
- VEGFR2
Vascular Endothelial Growth Factor Receptor
Footnotes
Data and materials availability
Raw sequence files are available at NCBI’s Gene Expression Omnibus https://www.ncbi.nlm.nih.gov/geo/query/acc.cgi?acc=GSE126681.
All data is available upon request.
References
- 1.Takahama Y 2006. Journey through the thymus: stromal guides for T-cell development and selection. Nat Rev Immunol 6: 127–135. [DOI] [PubMed] [Google Scholar]
- 2.Anderson G, Jenkinson EJ, and Rodewald HR. 2009. A roadmap for thymic epithelial cell development. Eur J Immunol 39: 1694–1699. [DOI] [PubMed] [Google Scholar]
- 3.Takahama Y, Ohigashi I, Baik S, and Anderson G. 2017. Generation of diversity in thymic epithelial cells. Nat Rev Immunol 17: 295–305. [DOI] [PubMed] [Google Scholar]
- 4.Cordier AC, and Haumont SM. 1980. Development of thymus, parathyroids, and ultimo-branchial bodies in NMRI and nude mice. Am J Anat 157: 227–263. [DOI] [PubMed] [Google Scholar]
- 5.Farley AM, Morris LX, Vroegindeweij E, Depreter ML, Vaidya H, Stenhouse FH, Tomlinson SR, Anderson RA, Cupedo T, Cornelissen JJ, and Blackburn CC. 2013. Dynamics of thymus organogenesis and colonization in early human development. Development 140: 2015–2026. [DOI] [PMC free article] [PubMed] [Google Scholar]
- 6.Norris EH 1938. The morphogenesis and histogenesis of the thymus gland in man: In which the origin of the Hassall’s corpuscles of the human thymus is discovered. Contrib Embryol 27. [Google Scholar]
- 7.Gordon J, and Manley NR. 2011. Mechanisms of thymus organogenesis and morphogenesis. Development 138: 3865–3878. [DOI] [PMC free article] [PubMed] [Google Scholar]
- 8.Owen JJ, McLoughlin DE, Suniara RK, and Jenkinson EJ. 2000. The role of mesenchyme in thymus development. Curr Top Microbiol Immunol 251: 133–137. [DOI] [PubMed] [Google Scholar]
- 9.Revest JM, Suniara RK, Kerr K, Owen JJ, and Dickson C. 2001. Development of the thymus requires signaling through the fibroblast growth factor receptor R2-IIIb. J Immunol 167: 1954–1961. [DOI] [PubMed] [Google Scholar]
- 10.Hilfer SR, and Brown JW. 1984. The development of pharyngeal endocrine organs in mouse and chick embryos. Scan Electron Microsc: 2009–2022. [PubMed] [Google Scholar]
- 11.van Ewijk W, Hollander G, Terhorst C, and Wang B. 2000. Stepwise development of thymic microenvironments in vivo is regulated by thymocyte subsets. Development 127: 1583–1591. [DOI] [PubMed] [Google Scholar]
- 12.Hale LP 2004. Histologic and molecular assessment of human thymus. Ann Diagn Pathol 8: 50–60. [DOI] [PubMed] [Google Scholar]
- 13.Steinmann GG 1986. Changes in the human thymus during aging. Curr Top Pathol 75: 43–88. [DOI] [PubMed] [Google Scholar]
- 14.Blackburn CC, Augustine CL, Li R, Harvey RP, Malin MA, Boyd RL, Miller JF, and Morahan G. 1996. The nu gene acts cell-autonomously and is required for differentiation of thymic epithelial progenitors. Proc Natl Acad Sci U S A 93: 5742–5746. [DOI] [PMC free article] [PubMed] [Google Scholar]
- 15.Chen L, Xiao S, and Manley NR. 2009. Foxn1 is required to maintain the postnatal thymic microenvironment in a dosage-sensitive manner. Blood 113: 567–574. [DOI] [PMC free article] [PubMed] [Google Scholar]
- 16.Cheng L, Guo J, Sun L, Fu J, Barnes PF, Metzger D, Chambon P, Oshima RG, Amagai T, and Su DM. 2010. Postnatal tissue-specific disruption of transcription factor FoxN1 triggers acute thymic atrophy. J Biol Chem 285: 5836–5847. [DOI] [PMC free article] [PubMed] [Google Scholar]
- 17.Hauri-Hohl MM, Zuklys S, Keller MP, Jeker LT, Barthlott T, Moon AM, Roes J, and Hollander GA. 2008. TGF-beta signaling in thymic epithelial cells regulates thymic involution and postirradiation reconstitution. Blood 112: 626–634. [DOI] [PMC free article] [PubMed] [Google Scholar]
- 18.Nehls M, Kyewski B, Messerle M, Waldschutz R, Schuddekopf K, Smith AJ, and Boehm T. 1996. Two genetically separable steps in the differentiation of thymic epithelium. Science 272: 886–889. [DOI] [PubMed] [Google Scholar]
- 19.Nehls M, Pfeifer D, Schorpp M, Hedrich H, and Boehm T. 1994. New member of the winged-helix protein family disrupted in mouse and rat nude mutations. Nature 372: 103–107. [DOI] [PubMed] [Google Scholar]
- 20.Alpdogan O, Hubbard VM, Smith OM, Patel N, Lu S, Goldberg GL, Gray DH, Feinman J, Kochman AA, Eng JM, Suh D, Muriglan SJ, Boyd RL, and van den Brink MR. 2006. Keratinocyte growth factor (KGF) is required for postnatal thymic regeneration. Blood 107: 2453–2460. [DOI] [PMC free article] [PubMed] [Google Scholar]
- 21.Chaudhry MS, Velardi E, Dudakov JA, and van den Brink MR. 2016. Thymus: the next (re)generation. Immunol Rev 271: 56–71. [DOI] [PMC free article] [PubMed] [Google Scholar]
- 22.Chu YW, Schmitz S, Choudhury B, Telford W, Kapoor V, Garfield S, Howe D, and Gress RE. 2008. Exogenous insulin-like growth factor 1 enhances thymopoiesis predominantly through thymic epithelial cell expansion. Blood 112: 2836–2846. [DOI] [PMC free article] [PubMed] [Google Scholar]
- 23.Erickson M, Morkowski S, Lehar S, Gillard G, Beers C, Dooley J, Rubin JS, Rudensky A, and Farr AG. 2002. Regulation of thymic epithelium by keratinocyte growth factor. Blood 100: 3269–3278. [DOI] [PubMed] [Google Scholar]
- 24.Goldberg GL, Alpdogan O, Muriglan SJ, Hammett MV, Milton MK, Eng JM, Hubbard VM, Kochman A, Willis LM, Greenberg AS, Tjoe KH, Sutherland JS, Chidgey A, van den Brink MR, and Boyd RL. 2007. Enhanced immune reconstitution by sex steroid ablation following allogeneic hemopoietic stem cell transplantation. J Immunol 178: 7473–7484. [DOI] [PubMed] [Google Scholar]
- 25.Goldberg GL, Dudakov JA, Reiseger JJ, Seach N, Ueno T, Vlahos K, Hammett MV, Young LF, Heng TS, Boyd RL, and Chidgey AP. 2010. Sex steroid ablation enhances immune reconstitution following cytotoxic antineoplastic therapy in young mice. J Immunol 184: 6014–6024. [DOI] [PubMed] [Google Scholar]
- 26.Velardi E, Tsai JJ, Holland AM, Wertheimer T, Yu VW, Zakrzewski JL, Tuckett AZ, Singer NV, West ML, Smith OM, Young LF, Kreines FM, Levy ER, Boyd RL, Scadden DT, Dudakov JA, and van den Brink MR. 2014. Sex steroid blockade enhances thymopoiesis by modulating Notch signaling. J Exp Med 211: 2341–2349. [DOI] [PMC free article] [PubMed] [Google Scholar]
- 27.Cuddihy AR, Ge S, Zhu J, Jang J, Chidgey A, Thurston G, Boyd R, and Crooks GM. 2009. VEGF-mediated cross-talk within the neonatal murine thymus. Blood 113: 2723–2731. [DOI] [PMC free article] [PubMed] [Google Scholar]
- 28.Cuddihy AR, Suterwala BT, Ge S, Kohn LA, Jang J, Andrade J, Wang X, and Crooks GM. 2012. Rapid thymic reconstitution following bone marrow transplantation in neonatal mice is VEGF-dependent. Biol Blood Marrow Transplant 18: 683–689. [DOI] [PMC free article] [PubMed] [Google Scholar]
- 29.Gray DH, Chidgey AP, and Boyd RL. 2002. Analysis of thymic stromal cell populations using flow cytometry. J Immunol Methods 260: 15–28. [DOI] [PubMed] [Google Scholar]
- 30.Gray DH, Fletcher AL, Hammett M, Seach N, Ueno T, Young LF, Barbuto J, Boyd RL, and Chidgey AP. 2008. Unbiased analysis, enrichment and purification of thymic stromal cells. J Immunol Methods 329: 56–66. [DOI] [PubMed] [Google Scholar]
- 31.Seach N, Wong K, Hammett M, Boyd RL, and Chidgey AP. 2012. Purified enzymes improve isolation and characterization of the adult thymic epithelium. J Immunol Methods 385: 23–34. [DOI] [PubMed] [Google Scholar]
- 32.Gerber HP, Hillan KJ, Ryan AM, Kowalski J, Keller GA, Rangell L, Wright BD, Radtke F, Aguet M, and Ferrara N. 1999. VEGF is required for growth and survival in neonatal mice. Development 126: 1149–1159. [DOI] [PubMed] [Google Scholar]
- 33.Livak KJ, and Schmittgen TD. 2001. Analysis of relative gene expression data using real-time quantitative PCR and the 2(-Delta Delta C(T)) Method. Methods 25: 402–408. [DOI] [PubMed] [Google Scholar]
- 34.Dobin A, Davis CA, Schlesinger F, Drenkow J, Zaleski C, Jha S, Batut P, Chaisson M, and Gingeras TR. 2013. STAR: ultrafast universal RNA-seq aligner. Bioinformatics 29: 15–21. [DOI] [PMC free article] [PubMed] [Google Scholar]
- 35.Casero D, Sandoval S, Seet CS, Scholes J, Zhu Y, Ha VL, Luong A, Parekh C, and Crooks GM. 2015. Long non-coding RNA profiling of human lymphoid progenitor cells reveals transcriptional divergence of B cell and T cell lineages. Nat Immunol 16: 1282–1291. [DOI] [PMC free article] [PubMed] [Google Scholar]
- 36.Love MI, Huber W, and Anders S. 2014. Moderated estimation of fold change and dispersion for RNA-seq data with DESeq2. Genome Biol 15: 550. [DOI] [PMC free article] [PubMed] [Google Scholar]
- 37.Shannon P, Markiel A, Ozier O, Baliga NS, Wang JT, Ramage D, Amin N, Schwikowski B, and Ideker T. 2003. Cytoscape: a software environment for integrated models of biomolecular interaction networks. Genome Res 13: 2498–2504. [DOI] [PMC free article] [PubMed] [Google Scholar]
- 38.Huang DW, Sherman BT, Tan Q, Kir J, Liu D, Bryant D, Guo Y, Stephens R, Baseler MW, Lane HC, and Lempicki RA. 2007. DAVID Bioinformatics Resources: expanded annotation database and novel algorithms to better extract biology from large gene lists. Nucleic Acids Res 35: W169–175. [DOI] [PMC free article] [PubMed] [Google Scholar]
- 39.Gray DH, Seach N, Ueno T, Milton MK, Liston A, Lew AM, Goodnow CC, and Boyd RL. 2006. Developmental kinetics, turnover, and stimulatory capacity of thymic epithelial cells. Blood 108: 3777–3785. [DOI] [PubMed] [Google Scholar]
- 40.Itoi M, Tsukamoto N, Yoshida H, and Amagai T. 2007. Mesenchymal cells are required for functional development of thymic epithelial cells. Int Immunol 19: 953–964. [DOI] [PubMed] [Google Scholar]
- 41.Jenkinson WE, Jenkinson EJ, and Anderson G. 2003. Differential requirement for mesenchyme in the proliferation and maturation of thymic epithelial progenitors. J Exp Med 198: 325–332. [DOI] [PMC free article] [PubMed] [Google Scholar]
- 42.Jenkinson WE, Rossi SW, Parnell SM, Jenkinson EJ, and Anderson G. 2007. PDGFRalpha-expressing mesenchyme regulates thymus growth and the availability of intrathymic niches. Blood 109: 954–960. [DOI] [PubMed] [Google Scholar]
- 43.Sitnik KM, Kotarsky K, White AJ, Jenkinson WE, Anderson G, and Agace WW. 2012. Mesenchymal cells regulate retinoic acid receptor-dependent cortical thymic epithelial cell homeostasis. J Immunol 188: 4801–4809. [DOI] [PubMed] [Google Scholar]
- 44.Bjorses P, Pelto-Huikko M, Kaukonen J, Aaltonen J, Peltonen L, and Ulmanen I. 1999. Localization of the APECED protein in distinct nuclear structures. Hum Mol Genet 8: 259–266. [DOI] [PubMed] [Google Scholar]
- 45.Heino M, Peterson P, Kudoh J, Nagamine K, Lagerstedt A, Ovod V, Ranki A, Rantala I, Nieminen M, Tuukkanen J, Scott HS, Antonarakis SE, Shimizu N, and Krohn K. 1999. Autoimmune regulator is expressed in the cells regulating immune tolerance in thymus medulla. Biochem Biophys Res Commun 257: 821–825. [DOI] [PubMed] [Google Scholar]
- 46.Muller SM, Terszowski G, Blum C, Haller C, Anquez V, Kuschert S, Carmeliet P, Augustin HG, and Rodewald HR. 2005. Gene targeting of VEGF-A in thymus epithelium disrupts thymus blood vessel architecture. Proc Natl Acad Sci U S A 102: 10587–10592. [DOI] [PMC free article] [PubMed] [Google Scholar]
- 47.Sawanobori Y, Ueta H, Dijkstra CD, Park CG, Satou M, Kitazawa Y, and Matsuno K. 2014. Three distinct subsets of thymic epithelial cells in rats and mice defined by novel antibodies. PLoS One 9: e109995. [DOI] [PMC free article] [PubMed] [Google Scholar]
- 48.Klein G, Muller CA, Tillet E, Chu ML, and Timpl R. 1995. Collagen type VI in the human bone marrow microenvironment: a strong cytoadhesive component. Blood 86: 1740–1748. [PubMed] [Google Scholar]
- 49.Corselli M, Crisan M, Murray IR, West CC, Scholes J, Codrea F, Khan N, and Peault B. 2013. Identification of perivascular mesenchymal stromal/stem cells by flow cytometry. Cytometry A 83: 714–720. [DOI] [PubMed] [Google Scholar]
- 50.Crisan M, Yap S, Casteilla L, Chen CW, Corselli M, Park TS, Andriolo G, Sun B, Zheng B, Zhang L, Norotte C, Teng PN, Traas J, Schugar R, Deasy BM, Badylak S, Buhring HJ, Giacobino JP, Lazzari L, Huard J, and Peault B. 2008. A perivascular origin for mesenchymal stem cells in multiple human organs. Cell Stem Cell 3: 301–313. [DOI] [PubMed] [Google Scholar]
- 51.Harkness L, Zaher W, Ditzel N, Isa A, and Kassem M. 2016. CD146/MCAM defines functionality of human bone marrow stromal stem cell populations. Stem Cell Res Ther 7: 4. [DOI] [PMC free article] [PubMed] [Google Scholar]
- 52.Manley NR, Richie ER, Blackburn CC, Condie BG, and Sage J. 2011. Structure and function of the thymic microenvironment. Front Biosci (Landmark Ed) 16: 2461–2477. [DOI] [PubMed] [Google Scholar]
- 53.Janas ML, Varano G, Gudmundsson K, Noda M, Nagasawa T, and Turner M. 2010. Thymic development beyond beta-selection requires phosphatidylinositol 3-kinase activation by CXCR4. J Exp Med 207: 247–261. [DOI] [PMC free article] [PubMed] [Google Scholar]
- 54.Plotkin J, Prockop SE, Lepique A, and Petrie HT. 2003. Critical role for CXCR4 signaling in progenitor localization and T cell differentiation in the postnatal thymus. J Immunol 171: 4521–4527. [DOI] [PubMed] [Google Scholar]
- 55.Trampont PC, Tosello-Trampont AC, Shen Y, Duley AK, Sutherland AE, Bender TP, Littman DR, and Ravichandran KS. 2010. CXCR4 acts as a costimulator during thymic beta-selection. Nat Immunol 11: 162–170. [DOI] [PMC free article] [PubMed] [Google Scholar]
- 56.Soker S, Miao HQ, Nomi M, Takashima S, and Klagsbrun M. 2002. VEGF165 mediates formation of complexes containing VEGFR-2 and neuropilin-1 that enhance VEGF165-receptor binding. J Cell Biochem 85: 357–368. [DOI] [PubMed] [Google Scholar]
- 57.Jiang Y, Berry DC, Jo A, Tang W, Arpke RW, Kyba M, and Graff JM. 2017. A PPARgamma transcriptional cascade directs adipose progenitor cell-niche interaction and niche expansion. Nat Commun 8: 15926. [DOI] [PMC free article] [PubMed] [Google Scholar]
- 58.Jurberg AD, Vasconcelos-Fontes L, and Cotta-de-Almeida V. 2015. A Tale from TGF-beta Superfamily for Thymus Ontogeny and Function. Front Immunol 6: 442. [DOI] [PMC free article] [PubMed] [Google Scholar]
- 59.Kahata K, Dadras MS, and Moustakas A. 2018. TGF-beta Family Signaling in Epithelial Differentiation and Epithelial-Mesenchymal Transition. Cold Spring Harb Perspect Biol 10. [DOI] [PMC free article] [PubMed] [Google Scholar]
- 60.Sansom SN, Shikama-Dorn N, Zhanybekova S, Nusspaumer G, Macaulay IC, Deadman ME, Heger A, Ponting CP, and Hollander GA. 2014. Population and single-cell genomics reveal the Aire dependency, relief from Polycomb silencing, and distribution of self-antigen expression in thymic epithelia. Genome Res 24: 1918–1931. [DOI] [PMC free article] [PubMed] [Google Scholar]
- 61.Alto LT, and Terman JR. 2017. Semaphorins and their Signaling Mechanisms. Methods Mol Biol 1493: 1–25. [DOI] [PMC free article] [PubMed] [Google Scholar]
- 62.Lepelletier Y, Smaniotto S, Hadj-Slimane R, Villa-Verde DM, Nogueira AC, Dardenne M, Hermine O, and Savino W. 2007. Control of human thymocyte migration by Neuropilin-1/Semaphorin-3A-mediated interactions. Proc Natl Acad Sci U S A 104: 5545–5550. [DOI] [PMC free article] [PubMed] [Google Scholar]
- 63.Mendes-da-Cruz DA, Brignier AC, Asnafi V, Baleydier F, Messias CV, Lepelletier Y, Bedjaoui N, Renand A, Smaniotto S, Canioni D, Milpied P, Balabanian K, Bousso P, Lepretre S, Bertrand Y, Dombret H, Ifrah N, Dardenne M, Macintyre E, Savino W, and Hermine O. 2014. Semaphorin 3F and neuropilin-2 control the migration of human T-cell precursors. PLoS One 9: e103405. [DOI] [PMC free article] [PubMed] [Google Scholar]
- 64.Halkias J, Melichar HJ, Taylor KT, and Robey EA. 2014. Tracking migration during human T cell development. Cell Mol Life Sci 71: 3101–3117. [DOI] [PMC free article] [PubMed] [Google Scholar]
- 65.Ladi E, Yin X, Chtanova T, and Robey EA. 2006. Thymic microenvironments for T cell differentiation and selection. Nat Immunol 7: 338–343. [DOI] [PubMed] [Google Scholar]
- 66.Savino W, Mendes-Da-Cruz DA, Smaniotto S, Silva-Monteiro E, and Villa-Verde DM. 2004. Molecular mechanisms governing thymocyte migration: combined role of chemokines and extracellular matrix. J Leukoc Biol 75: 951–961. [DOI] [PubMed] [Google Scholar]
- 67.Ohigashi I, Nitta T, Lkhagvasuren E, Yasuda H, and Takahama Y. 2011. Effects of RANKL on the thymic medulla. Eur J Immunol 41: 1822–1827. [DOI] [PubMed] [Google Scholar]
- 68.Weiss JM, Bilate AM, Gobert M, Ding Y, Curotto de Lafaille MA, Parkhurst CN, Xiong H, Dolpady J, Frey AB, Ruocco MG, Yang Y, Floess S, Huehn J, Oh S, Li MO, Niec RE, Rudensky AY, Dustin ML, Littman DR, and Lafaille JJ. 2012. Neuropilin 1 is expressed on thymus-derived natural regulatory T cells, but not mucosa-generated induced Foxp3+ T reg cells. J Exp Med 209: 1723–1742, S1721. [DOI] [PMC free article] [PubMed] [Google Scholar]
- 69.Yadav M, Louvet C, Davini D, Gardner JM, Martinez-Llordella M, Bailey-Bucktrout S, Anthony BA, Sverdrup FM, Head R, Kuster DJ, Ruminski P, Weiss D, Von Schack D, and Bluestone JA. 2012. Neuropilin-1 distinguishes natural and inducible regulatory T cells among regulatory T cell subsets in vivo. J Exp Med 209: 1713–1722, S1711–1719. [DOI] [PMC free article] [PubMed] [Google Scholar]
- 70.Wertheimer T, Velardi E, Tsai J, Cooper K, Xiao S, Kloss CC, Ottmuller KJ, Mokhtari Z, Brede C, deRoos P, Kinsella S, Palikuqi B, Ginsberg M, Young LF, Kreines F, Lieberman SR, Lazrak A, Guo P, Malard F, Smith OM, Shono Y, Jenq RR, Hanash AM, Nolan DJ, Butler JM, Beilhack A, Manley NR, Rafii S, Dudakov JA, and van den Brink MRM. 2018. Production of BMP4 by endothelial cells is crucial for endogenous thymic regeneration. Sci Immunol 3. [DOI] [PMC free article] [PubMed] [Google Scholar]
- 71.Thomas JL, Baker K, Han J, Calvo C, Nurmi H, Eichmann AC, and Alitalo K. 2013. Interactions between VEGFR and Notch signaling pathways in endothelial and neural cells. Cell Mol Life Sci 70: 1779–1792. [DOI] [PMC free article] [PubMed] [Google Scholar]
- 72.Zhao Q, Eichten A, Parveen A, Adler C, Huang Y, Wang W, Ding Y, Adler A, Nevins T, Ni M, Wei Y, and Thurston G. 2018. Single-Cell Transcriptome Analyses Reveal Endothelial Cell Heterogeneity in Tumors and Changes following Antiangiogenic Treatment. Cancer Res 78: 2370–2382. [DOI] [PubMed] [Google Scholar]
- 73.Blanco R, and Gerhardt H. 2013. VEGF and Notch in tip and stalk cell selection. Cold Spring Harb Perspect Med 3: a006569. [DOI] [PMC free article] [PubMed] [Google Scholar]
- 74.Hozumi K, Mailhos C, Negishi N, Hirano K, Yahata T, Ando K, Zuklys S, Hollander GA, Shima DT, and Habu S. 2008. Delta-like 4 is indispensable in thymic environment specific for T cell development. J Exp Med 205: 2507–2513. [DOI] [PMC free article] [PubMed] [Google Scholar]
- 75.Garcia-Leon MJ, Fuentes P, de la Pompa JL, and Toribio ML. 2018. Dynamic regulation of NOTCH1 activation and Notch ligand expression in human thymus development. Development 145. [DOI] [PubMed] [Google Scholar]
- 76.Ernszt D, Banfai K, Kellermayer Z, Pap A, Lord JM, Pongracz JE, and Kvell K. 2017. PPARgamma Deficiency Counteracts Thymic Senescence. Front Immunol 8: 1515. [DOI] [PMC free article] [PubMed] [Google Scholar]
- 77.Lepletier A, Alsharif A, and Chidgey AP. 2017. Inflammation and Thymus Ageing. Front Horm Res 48: 19–36. [DOI] [PubMed] [Google Scholar]
- 78.Sempowski GD, Hale LP, Sundy JS, Massey JM, Koup RA, Douek DC, Patel DD, and Haynes BF. 2000. Leukemia inhibitory factor, oncostatin M, IL-6, and stem cell factor mRNA expression in human thymus increases with age and is associated with thymic atrophy. J Immunol 164: 2180–2187. [DOI] [PubMed] [Google Scholar]
- 79.Gruver AL, and Sempowski GD. 2008. Cytokines, leptin, and stress-induced thymic atrophy. J Leukoc Biol 84: 915–923. [DOI] [PMC free article] [PubMed] [Google Scholar]
- 80.Savino W 2006. The thymus is a common target organ in infectious diseases. PLoS Pathog 2: e62. [DOI] [PMC free article] [PubMed] [Google Scholar]
- 81.Bryson JL, Griffith AV, Hughes B 3rd, Saito F, Takahama Y, Richie ER, and Manley NR. 2013. Cell-autonomous defects in thymic epithelial cells disrupt endothelial-perivascular cell interactions in the mouse thymus. PLoS One 8: e65196. [DOI] [PMC free article] [PubMed] [Google Scholar]
Associated Data
This section collects any data citations, data availability statements, or supplementary materials included in this article.