

Abstract
Direct oral anticoagulants, such as apixaban and rivaroxaban, are important for the treatment and prophylaxis of venous thromboembolism and to reduce the risk of stroke and systemic embolism in patients with nonvalvular atrial fibrillation. Because apixaban and rivaroxaban are predominantly eliminated by cytochrome P450 (CYP) 3A and P‐glycoprotein (P‐gp), concomitant use of combined P‐gp and strong CYP3A4 inhibitors and inducers should be avoided. Physiologically‐based pharmacokinetic models for apixaban and rivaroxaban were developed to estimate the net effect of CYP3A induction, P‐gp inhibition, and P‐gp induction by rifampicin. The disposition of rivaroxaban is more complex compared with apixaban because both hepatic and renal P‐gp is considered to contribute to rivaroxaban elimination. Furthermore, organic anion transporter‐3, a renal uptake transporter, may also contribute the elimination of rivaroxaban from systemic circulation. The models were verified with observed clinical drug–drug interactions with CYP3A and P‐gp inhibitors. With the developed models, the predicted area under the concentration time curve and maximum concentration ratios were 0.43 and 0.48, respectively, for apixaban, and 0.50–0.52 and 0.72–0.73, respectively, for rivaroxaban when coadministered with 600 mg multiple doses of rifampicin and that were very close to observed data. The impact of each of the elimination pathways was assessed for rivaroxaban, and inhibition of CYP3A led to a larger impact over intestinal and hepatic P‐gp. Inhibition of renal organic anion transporter‐3 or P‐gp led to an overall modest interaction. The developed apixaban and rivaroxaban models can be further applied to the investigation of interactions with other P‐gp and/or CYP3A4 inhibitors and inducers.
Study Highlights.
WHAT IS THE CURRENT KNOWLEDGE ON THE TOPIC?
☑ Both apixaban and rivaroxaban are known as combined cytochrome P450 (CYP) 3A and P‐glycoprotein (P‐gp) substrates and should be used with care when CYP3A and/or P‐gp inhibitors and/or inducers are concomitantly used. No verified physiologically‐based pharmacokinetic (PBPK) model for apixaban and only partially verified PBPK models for rivaroxaban have been previously reported.
WHAT QUESTION DID THIS STUDY ADDRESS?
☑ Can the developed apixaban and rivaroxaban PBPK models predict the drug–drug interaction (DDI) with combined CYP3A and P‐gp inhibitors and inducers?
WHAT DOES THIS STUDY ADD TO OUR KNOWLEDGE?
☑ The qualification process and results shown in the present analysis strengthen the ability to predict intestinal and hepatic P‐gp‐mediated DDI. The developed models can predict complex DDIs that involve the interplay of CYP3A and P‐gp inhibitors and inducers.
HOW MIGHT THIS CHANGE DRUG DISCOVERY, DEVELOPMENT, AND/OR THERAPEUTICS?
☑ PBPK modeling and simulation of P‐gp‐mediated DDIs will be evaluated using our qualified models. The apixaban and rivaroxaban models developed in the present work will be used in the prospective prediction of a DDI with CYP3A and/or P‐gp inhibitors/inducers.
The use of physiologically‐based pharmacokinetic (PBPK) models for predicting drug–drug interactions (DDI) is an emerging area during the past decade. Although its usefulness is based on mechanistic consideration of a drug’s elimination pathway, the use of PBPK has primarily been applied for cytochrome P450 (CYP)–mediated DDIs. CYP3A4‐mediated DDIs have been thoroughly investigated, 1 , 2 and the prediction results are well accepted by regulatory agencies as a part of new drug application submissions. 3 Recently, the prediction of P‐glycoprotein (P‐gp)–mediated induction has received increased attention as P‐gp shares substrates and inducers with CYP3A4. One of the most potent CYP3A inducers, rifampicin, also induces P‐gp. 4 Because rifampicin is reported to inhibit P‐gp, 5 the mechanism of interaction of rifampicin with combined CYP3A and P‐gp substrates is considered complex. Mechanistic understanding of the contribution of P‐gp and CYP3A is important to prospectively predict inhibition and/or induction effects on the disposition of substrates of P‐gp and CYP3A.
Apixaban and rivaroxaban are direct oral anticoagulants that are used for the treatment and prophylaxis of venous thromboembolism and to reduce the risk of stroke and systemic embolism in patients with nonvalvular atrial fibrillation. Both drugs are substrates of CYP3A and P‐gp and current labeling guidelines recommend avoiding concomitant use with combined P‐gp and strong CYP3A inhibitors and inducers. 6 , 7 The actual extent of the DDI with rifampicin is dependent on the interplay of the inhibition and/or induction effects between CYP3A and P‐gp. Accordingly, understanding the contribution of CYP3A and P‐gp on apixaban and rivaroxaban disposition and the net effect of CYP3A and P‐gp combined inhibitors/inducers is essential to estimate the magnitude of the DDI of these drugs.
To date, no verified PBPK model for apixaban has been reported. In contrast, there are a number of rivaroxaban PBPK models found in the literature. Four studies aimed to predict DDI in organ impairment patients, and one aimed to predict pharmacokinetics (PK) in pediatrics. All of these studies used verified rivaroxaban PBPK models to fulfill their specific requirements and only focused on inhibitory interaction. Our goal was to establish the PBPK model of apixaban and rivaroxaban and methodology that can predict combined inhibition and induction effects on P‐gp and CYP3A4. To achieve this, the qualification of intestinal and hepatic P‐gp‐mediated DDI was shown using digoxin as probe substrate of P‐gp.
METHODS
General approach
All PBPK model development, PK simulations, and DDI simulations were performed using the Simcyp population‐based simulator v18.2 (Certara UK Limited, Sheffield, UK). The observed clinical PK data were obtained from the literature, which provided plasma concentration profiles at clinical efficacious dose levels (10 mg for apixaban and 20 mg for rivaroxaban) in healthy volunteers using GetData Graph Digitizer v2.26 (http://getdata‐graph‐digitizer.com/). The intestinal absorption of rivaroxaban is known to be affected by food at high dose levels; thus, the PK data at 20 mg under the fed condition was selected for rivaroxaban. For the model verification, PK data after multiple oral (p.o.) administrations at several dose levels in healthy volunteers were obtained from respective phase I study results. The overall workflow of the present analysis is shown in Figure 1 . The qualification of hepatic P‐gp‐mediated interaction was shown with digoxin after intravenous (i.v.) administration and then combined with digoxin’s effects on hepatic and intestinal P‐gp after p.o. administration in the presence and absence of several P‐gp inhibitors. To investigate the induction effect on hepatic and intestinal P‐gp, rifampicin’s effect after i.v. and p.o. digoxin was tested. Apixaban and rivaroxaban PBPK models were developed and verified as combined CYP3A and P‐gp substrates. The developed models were then applied to evaluate the net effect of rifampicin on the absorption and elimination of apixaban and rivaroxaban. PBPK models, other than apixaban and rivaroxaban, were used from the Simcyp provided compound library, and any modifications made to the models are described in the supplementary materials. Throughout the present analysis, the magnitude of the predicted DDI was evaluated using area under the concentration time curve (AUC) and maximum concentration (Cmax) ratios of in the presence or absence of a perpetrator drug. As the extent of the DDI observed in apixaban and rivaroxaban clinical studies was weak to moderate, the validation criteria were calculated using the method proposed by Guest et al. 8 to avoid misleading judgment by using traditional twofold range criteria. The variability of PK parameters was assumed to be 20% as recommended by the authors.
Figure 1.
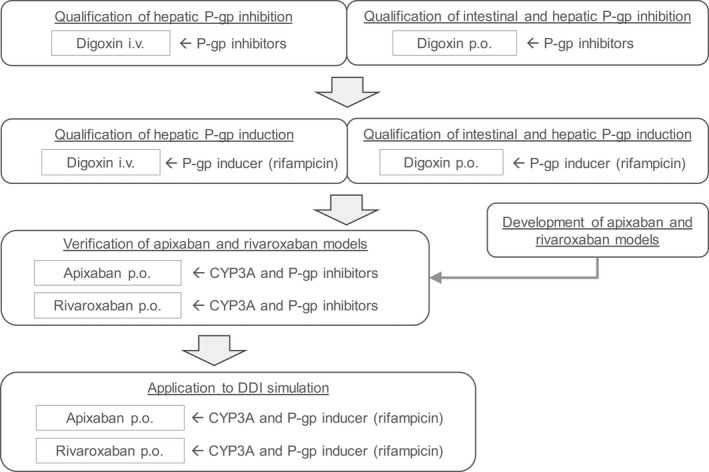
Overall workflow of apixaban and rivaroxaban physiologically‐based pharmacokinetic model development and assessment as combined CYP3A and P‐gp substrate including the qualification of hepatic and intestinal P‐gp inhibition and induction evaluation. CYP, cytochrome P450; i.v., intravenous; P‐gp, P‐glycoprotein; p.o., oral.
Apixaban PBPK model
The workflow of model development and verification is described in Figure S1 ‐1. The apixaban PBPK model was developed based on in vitro, in vivo, and in silico data obtained from the public domain. At first, a model for i.v. administration was developed with the CYP3A contribution determined from clinical DDI results with rifampicin after i.v. apixaban administration. Because biliary excretion of unchanged apixaban had a minor contribution (0.84% of dose) on the elimination of apixaban after p.o. administration of [14C]apixaban, 9 only CYP3A is considered to be affected by rifampicin. The i.v. model was then modified to an oral model by adding an absorption component. Considering apixaban’s low renal clearance (~0.9 L/h) 10 and high binding to plasma proteins, renal clearance was considered to occur primarily through glomerular filtration. Accordingly, P‐gp‐mediated secretion clearance in the kidney was not considered in the present model. Further details of model development are provided in the supplementary materials.
Rivaroxaban PBPK model development
The model development and verification workflow is described in Figure S2 ‐1. The PBPK models for rivaroxaban have been investigated in previous work. 11 , 12 , 13 , 14 , 15 The purposes of the model developments were different, and the models were verified to fulfill their intended uses. In the current analysis, we aimed to confirm whether the developed rivaroxaban model can reproduce observed clinical DDI data that are related to rivaroxaban’s absorption and elimination as a model verification step. After a comprehensive literature review, CYP3A, CYP2J2, hydrolysis, P‐gp, and organic anion transporter‐3 (OAT3) were considered to be involved in rivaroxaban disposition. The contribution of CYP3A was determined from clinical DDI study results with fluconazole, as fluconazole is reported to not inhibit CYP2J2, P‐gp, or OAT3. The model was verified with results from several clinical DDI studies using CYP3A and P‐gp inhibitors. Further details of rivaroxaban PBPK model development is provided in the supplementary materials.
Rifampicin P‐gp inhibition and induction effects
The Simcyp provided rifampicin compound file (SV‐Rifampicin‐MD) was used with the addition of a P‐gp inhibition component. Rifampicin reversible inhibition constant or concentration resulting in 50% inhibition values on P‐gp were investigated using in vitro studies and reported to be in the range of 4.3–279 μM. 5 , 16 In the present analysis, the smallest, most potent, in vitro value was employed. Greiner et al. 17 determined the increased expression of P‐gp in duodenal biopsies after multiple doses of 600 mg rifampicin for 10 days with quantitative immunohistochemistry and western blotting; 1.4‐fold and 3.5‐fold increases in P‐gp expressions, respectively, were observed. Increased duodenal ABCB1 mRNA after multiple doses of rifampicin 600 mg dose were reported to be 1.55‐fold to 3.67‐fold. 18 , 19 Furthermore, Yamazaki et al. 20 investigated rifampicin’s P‐gp induction effects with several P‐gp substrates using PBPK modeling and simulation and demonstrated a threefold to fourfold increase in intestinal P‐gp activity reasonably predicted the DDI between rifampicin and P‐gp substrates. Taken together, the fold increase in intestinal P‐gp after rifampicin 600 mg multiple doses was defined to be 3.5‐fold. When 600 mg rifampicin was administered once daily, a higher increase in CYP3A expression was simulated in the intestine compared with the liver (10‐fold vs. 6‐fold, respectively) because of the differences in rifampicin concentrations and enzyme turnovers in each organ. Both CYP3A and P‐gp induction mechanisms were considered via pregnane X receptor activation, and similar organ differences are expected with P‐gp induction. Accordingly, the same fold difference between the intestine and liver to CYP3A induction was applied to P‐gp induction. As intestinal P‐gp induction was defined as a 3.5‐fold increase after rifampicin 600 mg once daily administration, the hepatic P‐gp increase was set to 2.0‐fold. The induction effects of rifampicin on P‐gp was modeled as an increase in the scaling factor for activity/expression (a unique parameter of the software that is used for scaling differences in activity or expression of transporter between in vitro and in vivo) of intestinal and hepatic P‐gp in the substrate models. As for the kidney, P‐gp induction was not expected because renal expression of the pregnane X receptor is considered low compared with the liver and intestine. 21 Benson et al. 22 investigated rifampicin’s effect on the expression of CYP3A4 mRNA in normal human proximal tubular kidney cells and demonstrated no significant change in CYP3A4 mRNA level. Accordingly, rifampicin’s induction effect on kidney P‐gp was not addressed in the present study. Rifampicin’s effect on inhibition and induction of intestinal and hepatic P‐gp‐mediated transport following multiple doses were qualified with a clinical DDI study between rifampicin and i.v. and p.o. digoxin. Lastly, the predicted DDI between rifampicin and combined P‐gp and CYP3A substrates, apixaban and rivaroxaban, was conducted to evaluate if the complex rifampicin effects on P‐gp and CYP3A can be predicted. The use of PBPK for the prediction of CYP3A induction has been investigated in several previous studies, 2 , 23 and CYP3A induction prediction with PBPK is considered sufficiently valid to apply to further complex DDI simulations.
Impact assessment
As the absorption and elimination pathways of the rivaroxaban model is quite complex, the relative impact of the inhibition or induction on each elimination pathway was assessed as the ratio of interaction on specific enzyme/transporter inhibition or induction to overall interaction.
RESULTS
Qualification of intestinal and hepatic P‐gp‐mediated DDI
The inhibitory effect of several P‐gp inhibitors on hepatic elimination and digoxin’s combined effect on intestinal absorption and hepatic elimination were assessed with simulation after i.v. and p.o. administrations of digoxin, respectively. Although ritonavir’s inhibitory effect on i.v. digoxin underpredicted the observed AUC increase (1.16 vs. 1.86 for predicted vs. observed), the other DDI simulation results confirmed accurate prediction of P‐gp‐mediated interactions (Table 1 ). The DDI simulation with rifampicin also confirmed the validity of current assumptions on P‐gp induction after multiple p.o. administrations of 600 mg rifampicin.
Table 1.
Observed and predicted drug–drug interactions between P‐glycoprotein inhibitor/inducer and digoxin
| Inhibitor/inducer | Mode of digoxin administration | Without inhibitor/inducer | With inhibitor/inducer | AUClast ratio | Cmax ratio | ||||
|---|---|---|---|---|---|---|---|---|---|
| AUClast (ng‧h/mL) | Cmax (ng/mL) | AUClast (ng‧h/mL) | Cmax (ng/mL) | ||||||
| Ritonavir | i.v. | Observed 40 | 22 a | NA | 41 a | NA | 1.86 b | NA | |
| Predicted | 24 | NA | 28 | NA | 1.16 | NA | |||
| Criteria | 1.16–2.97 | ||||||||
| p.o. | Observed 41 | 5.45 | 1.24 | 7.59 | 1.55 | 1.37 | 1.16 | ||
| Predicted | 13.7 | 2.03 | 17.3 | 3.19 | 1.29 | 1.61 | |||
| Criteria | 0.94–1.99 | 0.86–1.57 | |||||||
| Clarithromycin | i.v. | Observed 42 | 27 | NA | 32 | NA | 1.19 | NA | |
| Predicted | 29 | NA | 34 | NA | 1.16 | NA | |||
| Criteria | 0.87–1.63 | ||||||||
| p.o. | Observed 43 | 7.3 | 1.2 | 10.7 | 2.1 | 1.47 | 1.75 | ||
| Predicted | 7.5 | 0.9 | 9.7 | 1.3 | 1.36 | 1.46 | |||
| Criteria | 0.99–2.19 | 1.23–2.50 | |||||||
| Verapamil | i.v. | Observed 44 | 73.34 | NA | 91.08 | NA | 1.24 | NA | |
| Predicted | 52.66 | NA | 61.18 | NA | 1.18 | NA | |||
| Criteria | 0.89–1.73 | ||||||||
| p.o. | Observed 45 | 15.7 | 2.5 | 23.6 | 3.6 | 1.50 | 1.44 | ||
| Predicted | 13.7 | 1.8 | 18.2 | 2.7 | 1.44 | 1.60 | |||
| Criteria | 1.00–2.25 | 0.97–2.13 | |||||||
| Rifampicin | i.v. | Observed 17 | 87.3 | NA | 74.5 | NA | 0.85 | NA | |
| Predicted | 62.7 | NA | 48.4 | NA | 0.76 | NA | |||
| Criteria | 0.62–1.16 | ||||||||
| p.o. | Observed 17 | 54.8 | 5.4 | 38.2 | 2.6 | 0.70 | 0.48 | ||
| Predicted | 50.3 | 3.6 | 33.3 | 2.4 | 0.63 | 0.65 | |||
| Criteria | 0.47–1.03 | 0.29–0.79 | |||||||
Criteria were calculated using the method proposed by Guest et al. 8 with assuming 20% variability in pharmacokinetic parameters.
AUCinf, area under the concentration‐time curve from the time of dosing extrapolated to time infinity; AUClast, area under the concentration‐time curve from the time of dosing up to the time of last measurable concentration; Cmax, maximum concentration; i.v., intravenous; NA, not assessed; p.o., oral.
AUCinf.
AUCinf ratio.
Apixaban PBPK model
Two key parameters for DDI simulation, CYP3A4 contribution in liver metabolism and the scaling factor for intestinal P‐gp activity, were optimized with clinical data. The primary metabolic route of [14C]apixaban’s major metabolites in urine and feces (M1 and M2) after p.o. administration was O‐demethylation. 24 In an in vitro study, CYP3A4 and CYP1A2 were shown to be responsible for the formation of O‐demethylated metabolites, indicating the possibility that both isozymes are involved in hepatic metabolism in humans. The contributions of each isozyme were estimated based on the clinical DDI study with rifampicin after i.v. administration of apixaban because the induction effect of rifampicin on CYP1A2 is considered weak 25 and only CYP3A4 was affected by rifampicin after apixaban i.v. administration. The optimized CYP3A4 contribution in hepatic metabolism was 42%, which reproduced the clinical DDI result (Table S1 ‐3). Intestinal P‐gp intrinsic clearance was estimated from in vitro P‐gp‐facilitated transport velocity data. 26 When in vitro intestinal P‐gp intrinsic clearance was used directly, Cmax was significantly overpredicted (245.8 ng/mL vs. 139.5 ~ 176.3 ng/mL for predicted vs. observed range, respectively) with an estimated fraction of absorbed drug from gut (F a) of 0.84. Assuming moderate absorption of apixaban from the gut, F a was considered overestimated. Based on a sensitivity analysis, a scaling factor of 25 to intestinal P‐gp activity was applied to obtain the clinically observed AUCinf and Cmax (Figure S1 ‐4). Estimated F a was 0.65, which is similar to what was observed in the clinical mass balance study. 9 The postulated mass balance after p.o. administration of apixaban is shown in Figure S1 ‐2. The developed apixaban model was then verified with PK profiles after single and multiple oral dose administrations (Figure 2 , Table S1 ‐5) and clinical DDI results with combined CYP3A and P‐gp inhibitors (Table 2 ). Simulated plasma concentration‐time profiles mimicked observed data appropriately (Figure 2 ) across the dose ranges tested. All predicted DDI results were within predefined criteria and thus indicated the verification of apixaban PBPK model as combined CYP3A and P‐gp substrate. The parameters used in the model are summarized in Table S1 ‐4.
Figure 2.
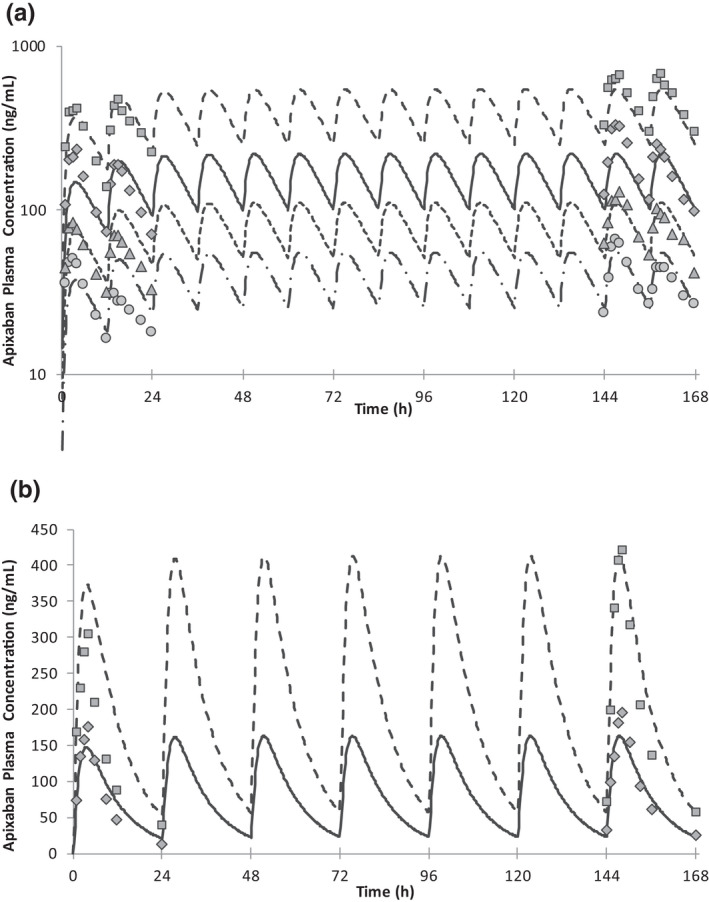
Mean apixaban plasma concentrations after multiple oral dose administrations of apixaban at (a) twice daily and (b) once daily dosing. Symbols are observed data 38 at 2.5 mg (circle), 5 mg (triangle), 10 mg (diamond), and 25 mg (square). Lines are predicted data at 2.5 mg (dashed‐dotted), 5 mg (dotted), 10 mg (solid), and 25 mg (dashed).
Table 2.
Observed and predicted effects of combined cytochrome P450 3A4 and P‐glycoprotein inhibitors to the plasma exposure/renal clearance of apixaban and rivaroxaban
| Inhibitors | Without inhibitor | With inhibitor | AUCinf ratio | Cmax ratio | CLr ratio | ||||
|---|---|---|---|---|---|---|---|---|---|
| AUCinf (ng‧h/mL) | Cmax (ng/mL) | CLr (L/h) | AUCinf (ng‧h/mL) | Cmax (ng/mL) | CLr (L/h) | ||||
| Victim: apixaban | |||||||||
| Ketoconazole | |||||||||
| Observed 46 | 1,490 a | 139.5 | NA | 2,939 a | 225.3 | NA | 1.97 b | 1.62 | NA |
| Predicted | 2,017 a | 159.0 | NA | 2,826 a | 222.0 | NA | 1.42 b | 1.43 | NA |
| Criteria | 1.22–3.19 | 1.05–2.49 | |||||||
| Diltiazem | |||||||||
| Observed 46 | 1,897 | 148.1 | NA | 2,606 | 194.6 | NA | 1.40 | 1.31 | NA |
| Predicted | 1,968 | 156.0 | NA | 2,665 | 215.1 | NA | 1.37 | 1.41 | NA |
| Criteria | 0.95–2.03 | 0.92–1.87 | |||||||
| Cyclosporine | |||||||||
| Observed 47 | 1,875 | 179 | NA | 2,237 | 257 | NA | 1.19 | 1.43 | NA |
| Predicted | 2,030 | 152 | NA | 2,554 | 223 | NA | 1.28 | 1.51 | NA |
| Criteria | 0.87–1.65 | 0.97–2.11 | |||||||
| Victim: rivaroxaban | |||||||||
| Ketoconazole | |||||||||
| Observed 48 | 1,088 | 148.8 | 3.2 | 1,980 | 228.1 | 2.1 | 1.82 | 1.53 | 0.66 |
| Predicted (model 1) | 981 | 124.9 | 3.1 | 1,839 | 173.2 | 1.4 | 1.90 | 1.39 | 0.45 |
| Predicted (model 2) | 1,092 | 130.5 | 2.1 | 1,708 | 166.4 | 1.8 | 1.58 | 1.27 | 0.86 |
| Criteria | 1.15–2.89 | 1.01–2.31 | 0.44–0.99 | ||||||
| Ritonavir | |||||||||
| Observed 48 | 1,000 | 153.7 | 4.0 | 2,529 | 238 | 1.0 | 2.53 | 1.55 | 0.25 |
| Predicted (model 1) | 945 | 122.8 | 3.17 | 2,420 | 175.3 | 1.29 | 2.56 | 1.43 | 0.41 |
| Predicted (model 2) | 1,061 | 128.9 | 2.13 | 2,557 | 176.8 | 1.07 | 2.41 | 1.37 | 0.50 |
| Criteria | 1.49–4.31 | 1.02–2.35 | 0.14–0.45 | ||||||
| Clarithromycin | |||||||||
| Observed 48 | 964 | 139.4 | 3.8 | 1,469 | 194.4 | 3.4 | 1.54 | 1.40 | 0.89 |
| Predicted (model 1) | 982 | 124.8 | 3.08 | 1,589 | 150.0 | 3.02 | 1.59 | 1.20 | 0.98 |
| Predicted (model 2) | 1,093 | 130.4 | 2.07 | 2,644 | 170.2 | 0.57 | 2.35 | 1.31 | 0.28 |
| Criteria | 1.02–2.33 | 0.96–2.05 | 0.67–1.19 | ||||||
| Erythromycin | |||||||||
| Observed 48 | 1,069 | 170.5 | 3.0 | 1,425 | 228.6 | 3.4 | 1.34 | 1.38 | 1.13 |
| Predicted (model 1) | 953 | 123.2 | 3.12 | 1,348 | 140.3 | 3.12 | 1.41 | 1.14 | 1.00 |
| Predicted (model 2) | 921 | 122.3 | 2.02 | 1,363 | 141.0 | 1.95 | 1.45 | 1.15 | 0.97 |
| Criteria | 0.93–1.93 | 0.95–2.01 | 0.85–1.51 | ||||||
| Verapamil | |||||||||
| Observed 49 | 2,644 | 272 | 2.3 | 3,670 | 288 | 2.6 | 1.39 | 1.06 | 1.11 |
| Predicted (model 1) | 2,070 | 231 | 3.2 | 3,228 | 277 | 3.1 | 1.53 | 1.20 | 0.97 |
| Predicted (model 2) | 2,335 | 243 | 2.1 | 5,282 | 321 | 0.81 | 2.19 | 1.32 | 0.38 |
| Criteria | 0.95–2.03 | 0.82–1.37 | 0.84–1.47 | ||||||
Criteria were calculated using the method proposed by Guest et al. 8 with assuming 20% variability in pharmacokinetic parameters.
AUCinf, area under the concentration‐time curve from the time of dosing extrapolated to time infinity; AUClast, area under the concentration‐time curve from the time of dosing up to the time of last measurable concentration; CLr, renal clearance; Cmax, maximum concentration; NA, not assessed.
AUClast.
AUClast ratio.
Rivaroxaban PBPK model
At first, the contribution of hepatic CYP3A metabolism was optimized with clinical DDI results with fluconazole. Grillo et al. 11 estimated the fraction metabolized with CYP3A4 in liver (fm,CYP3A4) as 0.37 in their PBPK analysis, and subsequent PBPK works also used the same assumption. 12 , 15 It is noteworthy that they did not use fluconazole DDI study results for the verification of their models and thus only evaluated the combined effects on CYP3A and P‐gp. When a fm,CYP3A4 of 0.37 was used, the DDI with fluconazole was considerably underpredicted (Table S2 ‐2). Accordingly, fm,CYP3A4 was optimized to 0.61 to reproduce the fluconazole DDI results, and the assumption was further evaluated with other clinical DDI studies. Another parameter that was optimized with clinical data was relative activity factor/relative expression factor (RAF/REF) of intestinal P‐gp. P‐gp transport kinetic data were determined from the in vitro study by Cheong et al. 15 When the in vitro data were used directly, estimated F a was 0.92, indicating a slight underprediction in gut absorption because complete absorption was evident in the clinical study when 20 mg of rivaroxaban was dosed under fed conditions. 27 Sensitivity analysis indicated a 10‐fold decrease in activity/expression of intestinal P‐gp resulted in almost complete absorption from gut. Cheong et al. demonstrated in their PBPK work the involvement of OAT3 in rivaroxaban’s renal elimination. However, OAT3 only affects rivaroxaban uptake on the basal membrane of the proximal tubular cells when passive diffusion is assumed to be very low. This assumption may not be exact because rivaroxaban is known as a high permeable compound. 28 Accordingly, two separate models with different assumptions were built: model 1 (with OAT3 and low passive diffusion) and model 2 (without OAT3 and high passive diffusion). The postulated mass balance after p.o. administration of rivaroxaban is shown in Figure S2 ‐2. The developed rivaroxaban models were verified with PK profiles after multiple oral dose administrations (Figure 3 , Table S2 ‐5) and clinical DDI results with combined CYP3A and P‐gp inhibitors (Table 2 ). Simulated plasma concentration‐time profiles mimicked observed data appropriately (Figure 3 ) across the dose range tested in both models 1 and 2. In all inhibitors tested, AUCinf and Cmax ratios were within the prediction criteria with the exception of the AUCinf ratios of clarithromycin and verapamil in model 2 simulations. Clarithromycin and verapamil in model 2 simulations also showed poor predictability of the renal clearance (CLr) ratio. The changes in CLr in the presence of ketoconazole, ritonavir, and erythromycin were well predicted.
Figure 3.
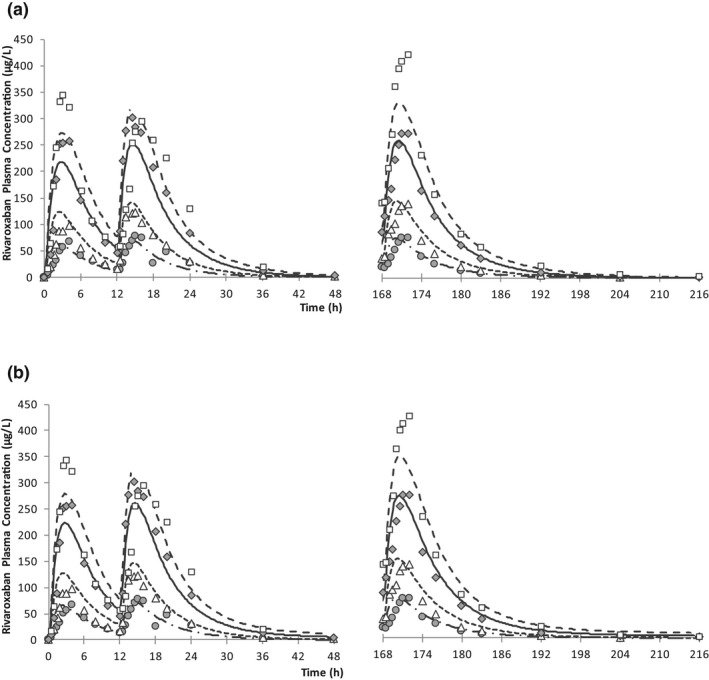
Mean rivaroxaban plasma concentrations after twice daily multiple oral dose administrations of rivaroxaban for (a) model 1 and (b) model 2. Symbols are observed data 39 at 5 mg (circle), 10 mg (triangle), 20 mg (diamond), and 30 mg (square). Lines are predicted data at 5 mg (dashed‐dotted), 10 mg (dotted), 20 mg (solid), and 30 mg (dashed).
DDI with rifampicin
In the application step of DDI prediction between rifampicin and combined P‐gp and CYP3A substrates, apixaban and rivaroxaban, the predicted AUC and Cmax ratios were all within the prediction criteria, showing good prediction accuracy (Table 3 ).
Table 3.
Observed and predicted effects of rifampicin to the plasma exposure of apixaban and rivaroxaban
| Victim | Without inhibitor/inducer | With inhibitor/inducer | AUClast ratio | Cmax ratio | ||
|---|---|---|---|---|---|---|
| AUClast (ng‧h/mL) | Cmax (ng/mL) | AUClast (ng‧h/mL) | Cmax (ng/mL) | |||
| Apixaban | ||||||
| Observed 50 | 1,795 a | 148.6 | 866 a | 88.0 | 0.46 b | 0.58 |
| Predicted | 1,900 a | 151.8 | 808 a | 72.6 | 0.43 b | 0.48 |
| Criteria | 0.28–0.76 | 0.37–0.91 | ||||
| Rivaroxaban | ||||||
| Observed | 1,776 | 229 | 906 | 178 | 0.51 | 0.78 |
| Predicted (model 1) | 1,792 | 217 | 928 | 159 | 0.52 | 0.73 |
| Predicted (model 2) | 1,993 | 227 | 998 | 165 | 0.50 | 0.72 |
| Criteria | 0.32–0.82 | 0.55–1.10 | ||||
Criteria were calculated using the method proposed by Guest et al. 8 with assuming 20% variability in pharmacokinetic parameters.
AUCinf, area under the concentration‐time curve from the time of dosing extrapolated to time infinity; AUClast, area under the concentration‐time curve from the time of dosing up to the time of last measurable concentration; Cmax, maximum concentration.
AUCinf.
AUCinf ratio.
Impact of each elimination pathway
For rivaroxaban, the impact of each elimination pathway on overall interaction was assessed. The impact on CYP3A inhibition/induction was the largest in all compounds tested in both models 1 and 2 (Figure 4 ). Inhibition of renal transporters, OAT3 and P‐gp, had a relatively high impact compared with intestinal or hepatic P‐gp in compounds that have strong inhibitory effects on these transporters (e.g., ketoconazole, ritonavir, clarithromycin, and verapamil). The rivaroxaban model was developed with the assumption that intestinal P‐gp has minimal impact on rivaroxaban absorption because of the high oral bioavailability of rivaroxaban. This assumption confirmed that intestinal P‐gp was not affected by the inhibitors as largely as expected in the model development.
Figure 4.
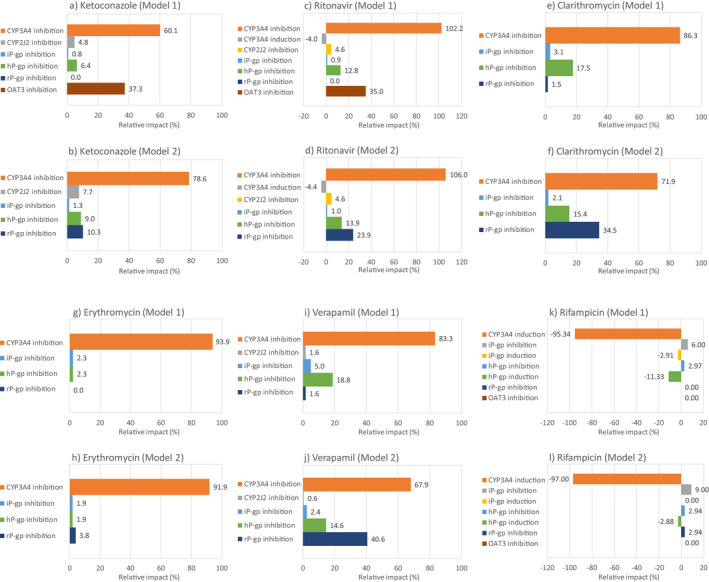
Relative impact of interaction on absorption or elimination pathways that are related to rivaroxaban disposition when coadministered with ketoconazole (a and b), ritonavir (c and d), clarithromycin (e and f), erythromycin (g and h), verapamil (i and j), and rifampicin (k and l). Data are shown for model 1 (a, c, e, g, i, and k) and model 2 (b, d, f, h, j, and l). CYP, cytochrome P450; hP‐gp, hepatic P‐gp; iP‐gp, intestinal P‐gp; P‐gp, P‐glycoprotein; rP‐gp, renal P‐gp.
DISCUSSION
In any PBPK analysis, qualification of the PBPK platform with its intended use is important for assessing the accuracy of the modeling and simulation results. 29 The qualification of transporter‐mediated DDI (tDDI) predictions is one of the more challenging aspects because of the difficulties in in vitro to in vivo extrapolation; lack of specific substrates, inhibitors, and inducers; and lack of transporter‐specific clinical DDI studies. 30 To estimate the net effect of inhibitors/inducers that have combined effects on enzymes and transporters, a stepwise approach that separately validates the interaction on enzymes and transporters is useful, although it is possible only when enough clinical DDI results are available. The DDI simulations on CYP3A has been well investigated for both inhibition and induction and considered qualified for the use of the prospective prediction of DDI. Accordingly, the present analysis focused on the qualification of P‐gp‐mediated DDI. P‐gp is a well‐investigated transporter in clinical studies because there is a substrate with high specificity for P‐gp, digoxin.
In the present analysis, the goal was to develop PBPK models for the combined CYP3A and P‐gp substrates apixaban and rivaroxaban. The inhibition and induction effects of P‐gp were first qualified with the P‐gp substrate digoxin. The impact of P‐gp inhibitors and inducers on the hepatic P‐gp can be assessed following i.v. administration of digoxin. With the tested three P‐gp inhibitors, ritonavir underpredicted the interaction with i.v. digoxin. The extent of interaction between ritonavir and digoxin is stronger after i.v. administration of digoxin than after p.o. administration. This was an unexpected result because generally the interaction after p.o. administration of victim drug is considered stronger than after i.v. administration because of the additional interaction of intestinal P‐gp, if considering inhibition as the only relevant interaction. However, if there is also induction of enzymes or transporters, it is possible that the net interaction effect (increase in exposure) is stronger after i.v. administration. A previous investigation indicated that ritonavir has an induction effect on P‐gp, 31 thus ritonavir’s combined inhibition and induction effects on P‐gp may be the reason for the poor predictability of the interaction between ritonavir and digoxin. Overall, the DDI simulations between P‐gp inhibitors and digoxin showed good predictabilities (Table 1 ).
Furthermore, the DDI simulation results between rifampicin and digoxin agree with observed results. The results from the i.v. simulation indicate the assumption in the extent of P‐gp induction (3.5‐fold increase vs. 2.0‐fold increase in P‐gp activities in the intestine and liver, respectively) worked well. Using a mechanistic model, which predicts P‐gp expression change based on inducer drug concentration, to predict an induction effect is preferred, but there are still data lacking for this type of mechanistic modeling. It is especially difficult to estimate intestinal and hepatic P‐gp turnover. Two PBPK studies tried to predict P‐gp induction using a mechanistic model 32 , 33 ; however, both applied CYP3A4 turnover values to P‐gp because of a lack of experimental data. Under this situation, we employed a static method to predict P‐gp’s induction effect. Because the induction of enzymes and transporters are evaluated under steady‐state conditions, a static increase in P‐gp activity after multiple administrations of a P‐gp inducer is considered a reasonable assumption. Taken together, we concluded that DDI simulations via hepatic and intestinal P‐gp using the current PBPK platform were qualified.
In the PBPK model development of apixaban and rivaroxaban, the literature information that was relevant to model development and verification were thoroughly reviewed and incorporated into the models. In apixaban model development, the key assumptions were as follows: (i) dissolution of tablet formulation was not rate limiting (absorption of tablet formulation from gut is similar to that of solution formulation); (ii) oral bioavailability was 66%; (iii) unrecovered radioactivity in human mass balance study was assigned to an unknown elimination pathway; (iv) there was no P‐gp‐mediated elimination from liver and kidney; and (v) P‐gp, not breast cancer resistance protein (BCRP), was mainly involved in apixaban efflux in the apical membrane of enterocytes. The key assumptions in rivaroxaban model development were as follows: (i) the model was developed for the fed state assuming complete absorption from the gut at 20 mg, (ii) intestinal P‐gp does not affect rivaroxaban absorption from the gut under normal conditions, (iii) BCRP was not involved in rivaroxaban absorption and elimination, and (iv) passive diffusion in sinusoidal membrane of the hepatocyte and apical membrane within the kidney proximal tubular cells were both low.
The rivaroxaban model employed a mechanistic kidney model to evaluate the effects of inhibitors/inducers on OAT3 and P‐gp‐mediated secretory clearance. Several PBPK studies investigated renal transporter‐mediated DDIs, although most of the studies were for the inhibition of basal membrane transporters, such as OAT1 and OAT3. 34 , 35 The inhibitory effects of probenecid, an OAT1 and OAT3 inhibitor, were investigated, and PBPK accurately predicted probenecid’s effect on S44121 34 and baricitinib 35 plasma exposures. DDI predictions for efflux transporters on the apical membrane are more challenging because the concentration in the proximal tubular cells should be accurately estimated for predicting the interaction on apical membrane transporters. Moreover, the interplay of active uptake and passive diffusion on the influx and efflux of a compound in the basal membrane of proximal tubular cells is important to reflect the interaction on apical membrane transporters on the change in plasma exposure. Nishiyama et al. 36 showed that higher passive permeability at the basal membrane of proximal tubular cells resulted in greater impact of apical membrane transporter inhibition on secretory clearance in the kidney. We showed similar results. The impact of P‐gp inhibition at the apical membrane of proximal tubular cells were only seen in model 2, which was a high passive permeability model (Figure 4 ). The mechanism of renal elimination of rivaroxaban is not known well. The DDI simulation with ketoconazole and ritonavir indicated that OAT3 inhibition at the basal membrane of proximal tubular cells accurately reproduced the observed exposure increase when using a 100‐fold lower K i from in vitro values. In vitro and in vivo discrepancies in transporter K i values are well known. 31 However, there is an uncertainty in using a 100‐fold lower K i value than the in vitro value because as shown by Posada et al., 35 there is an example that the in vitro K i value of probenecid for OAT3 showed good predictability of clinical DDI after no deviation of in vitro K i value. Combined with the high passive permeable nature of rivaroxaban, the uncertainty around the contribution of OAT3 in uptake from the basal membrane of proximal tubular cells led to the development and testing of model 2 as another scenario. Both ketoconazole and ritonavir showed reasonable predictability, even in model 2, whereas clarithromycin and verapamil overpredicted the AUC increase and CLr decrease (Table 2 ). Further investigation into the mechanism of rivaroxaban’s renal secretory clearance may be needed, but for the purpose of DDI risk assessment via CYP3A and P‐gp, the current two‐model approach was deemed a reasonable solution. Actually, in the DDI simulation with rifampicin, the impact on renal P‐gp inhibition was limited and rifampicin DDI risk can be evaluated only with intestinal and hepatic P‐gp inhibition/induction and CYP3A induction (Figure 4 ). This is because rifampicin has only a weak inhibitory potential at OAT3 and P‐gp transporters in vitro. 5 , 37 For the compounds that have a strong inhibition on OAT3 and P‐gp, careful assessment of the inhibition effects on these transporters with the models we developed will help further understandingunderstanding the mechanism of interaction and prospective prediction of the extent of DDI.
In conclusion, we developed PBPK models for apixaban and rivaroxaban that successfully predicted the DDI with CYP3A and P‐gp inhibitors/inducers. Our models enabled prospective prediction of the net effect of inhibition and induction of CYP3A and P‐gp on apixaban and rivaroxaban plasma exposure. Furthermore, qualification of hepatic and intestinal P‐gp‐mediated interaction prediction was demonstrated using the present PBPK platform. We believe the efforts of qualification of tDDI such as the present analysis strengthens the confidence of tDDI prediction with PBPK and leads to efficient drug development.
Conflict of Interest
The authors declared no competing interests for this work.
Funding
This study was sponsored by Astellas Pharma Inc.
Author Contributions
Y.O., M.P.C., P.L.B., and K.K. wrote the manuscript. Y.O. and P.L.B. designed the research. Y.O. and M.P.C. performed the research. Y.O., M.P.C., P.L.B., and K.K. analyzed the data.
Supporting information
Supplementary Material
References
- 1. Wagner, C. et al Predicting the effect of cytochrome P450 inhibitors on substrate drugs: analysis of physiologically based pharmacokinetic modeling submissions to the US Food and Drug Administration. Clin. Pharmacokinet. 54, 117–127 (2014). [DOI] [PubMed] [Google Scholar]
- 2. Wagner, C. , Pan, Y. , Hsu, V. , Sinha, V. & Zhao, P. Predicting the effect of CYP3A inducers on the pharmacokinetics of substrate drugs using physiologically based pharmacokinetic (PBPK) modeling: an analysis of PBPK submissions to the US FDA. Clin. Pharmacokinet. 55, 475–483 (2015). [DOI] [PubMed] [Google Scholar]
- 3. Shebley, M. et al Physiologically based pharmacokinetic model qualification and reporting procedures for regulatory submissions: a consortium perspective. Clin. Pharmacol. Ther. 104, 88–110 (2018). [DOI] [PMC free article] [PubMed] [Google Scholar]
- 4. Rodrigues, A.D. , Lai, Y. , Shen, H. , Varma, M.V.S. , Rowland, A. & Oswald, S. Induction of human intestinal and hepatic organic anion transporting polypeptides: Where is the evidence for its relevance in drug‐drug interactions? Drug Metab. Dispos. 48, 205–216 (2020). [DOI] [PubMed] [Google Scholar]
- 5. Pedersen, J.M. , Khan, E.K. , Bergström, C.A.S. , Palm, J. , Hoogstraate, J. & Artursson, P. Substrate and method dependent inhibition of three ABC‐transporters (MDR1, BCRP, and MRP2). Eur. J. Pharm. Sci. 103, 70–76 (2017). [DOI] [PubMed] [Google Scholar]
- 6. XARELTO®: Prescribing information <https://www.accessdata.fda.gov/drugsatfda_docs/label/2020/202439s031,022406s035lbl.pdf> (2020).
- 7. ELIQUIS®: prescribing information <https://www.accessdata.fda.gov/drugsatfda_docs/label/2019/202155s024lbl.pdf> (2019).
- 8. Guest, E.J. , Aarons, L. , Houston, J.B. , Rostami‐Hodjegan, A. & Galetin, A. Critique of the two‐fold measure of prediction success for ratios: application for the assessment of drug‐drug interactions. Drug Metab. Dispos. 39, 170–173 (2011). [DOI] [PubMed] [Google Scholar]
- 9. Raghavan, N. et al Apixaban metabolism and pharmacokinetics after oral administration to humans. Drug Metab. Dispos. 37, 74–81 (2009). [DOI] [PubMed] [Google Scholar]
- 10. Byon, W. , Garonzik, S. , Boyd, R.A. & Frost, C.E. Apixaban: A clinical pharmacokinetic and pharmacodynamic review. Clin Pharmacokinet. 58, 1265–1279 (2019). [DOI] [PMC free article] [PubMed] [Google Scholar]
- 11. Grillo, J.A. et al Utility of a physiologically‐based pharmacokinetic (PBPK) modeling approach to quantitatively predict a complex drug‐drug‐disease interaction scenario for rivaroxaban during the drug review process: implications for clinical practice. Biopharm. Drug Dispos. 33, 99–110 (2012). [DOI] [PubMed] [Google Scholar]
- 12. Willmann, S. et al Development of a paediatric population‐based model of the pharmacokinetics of rivaroxaban. Clin. Pharmacokinet. 53, 89–102 (2014). [DOI] [PMC free article] [PubMed] [Google Scholar]
- 13. Ismail, M. , Lee, V.H. , Chow, C.R. & Rubino, C.M. Minimal physiologically based pharmacokinetic and drug‐drug‐disease interaction model of rivaroxaban and verapamil in healthy and renally impaired subjects. J. Clin. Pharmacol. 58, 541–548 (2018). [DOI] [PubMed] [Google Scholar]
- 14. Xu, R. , Ge, W. & Jiang, Q. Application of physiologically based pharmacokinetic modeling to the prediction of drug‐drug and drug‐disease interactions for rivaroxaban. Eur. J. Clin. Pharmacol. 74, 755–765 (2018). [DOI] [PubMed] [Google Scholar]
- 15. Cheong, E.J.Y. , Teo, D.W.X. , Chua, D.X.Y. & Chan, E.C.Y. Systematic development and verification of a physiologically‐based pharmacokinetic model of rivaroxaban. Drug Metab. Dispos. 47, 1291–1306 (2019). [DOI] [PubMed] [Google Scholar]
- 16. Dong, J. et al Glycyrrhizin has a high likelihood to be a victim of drug‐drug interactions mediated by hepatic organic anion‐transporting polypeptide 1B1/1B3. Br. J. Pharmacol. 175, 3486–3503 (2018). [DOI] [PMC free article] [PubMed] [Google Scholar]
- 17. Greiner, B. et al The role of intestinal P‐glycoprotein in the interaction of digoxin and rifampin. J. Clin. Invest. 104, 147–153 (1999). [DOI] [PMC free article] [PubMed] [Google Scholar]
- 18. Oscarson, M. et al Effects of rifampicin on global gene expression in human small intestine. Pharmacogenet. Genomics. 17, 907–918 (2007). [DOI] [PubMed] [Google Scholar]
- 19. Brueck, S. et al Transcriptional and post‐transcriptional regulation of duodenal P‐glycoprotein and MRP2 in healthy human subjects after chronic treatment with rifampin and carbamazepine. Mol. Pharm. 16, 3823–3830 (2019). [DOI] [PubMed] [Google Scholar]
- 20. Yamazaki, S. , Costales, C. , Lazzaro, S. , Eatemadpour, S. , Kimoto, E. & Varma, M. V. Physiologically‐based pharmacokinetic modeling approach to predict rifampin‐mediated intestinal p‐glycoprotein induction. CPT: Pharm. Syst. Pharmacol. 8, 634–642 (2019). [DOI] [PMC free article] [PubMed] [Google Scholar]
- 21. Nishimura, M. , Naito, S. & Yokoi, T. Tissue‐specific mRNA expression profiles of human nuclear receptor subfamilies. Drug Metab. Pharmacokinet. 19, 135–149 (2004). [DOI] [PubMed] [Google Scholar]
- 22. Benson, E.A. et al Rifampin regulation of drug transporters gene expression and the association of microRNAs in human hepatocytes. Front. Pharmacol. 7, 111 (2016). [DOI] [PMC free article] [PubMed] [Google Scholar]
- 23. Marsousi, N. , Desmeules, J.A. , Rudaz, S. & Daali, Y. Prediction of drug‐drug interactions using physiologically‐based pharmacokinetic models of CYP450 modulators included in Simcyp software. Biopharm. Drug Dispos. 39, 3–17 (2018). [DOI] [PubMed] [Google Scholar]
- 24. Zhang, D. et al Comparative metabolism of 14C‐labeled apixaban in mice, rats, rabbits, dogs, and humans. Drug Metab. Dispos. 37, 1738–1748 (2009). [DOI] [PubMed] [Google Scholar]
- 25. Lutz, J.D. et al Cytochrome P450 3A induction predicts P‐glycoprotein induction; Part 1: Establishing induction relationships using ascending dose rifampin. Clin. Pharmacol. Ther. 104, 1182–1190 (2018). [DOI] [PMC free article] [PubMed] [Google Scholar]
- 26. Zhang, D. et al Characterization of efflux transporters involved in distribution and disposition of apixaban. Drug Metab. Dispos. 41, 827–835 (2013). [DOI] [PubMed] [Google Scholar]
- 27. XARELTO®: Clinical Pharmacology and Biopharmaceutics Review(s) <https://www.accessdata.fda.gov/drugsatfda_docs/nda/2011/202439Orig1s000ClinPharmR.pdf> (2011). Accessed April 27, 2020.
- 28. Gnoth, M.J. , Buetehorn, U. , Muenster, U. , Schwarz, T. & Sandmann, S. In vitro and in vivo P‐glycoprotein transport characteristics of rivaroxaban. J. Pharmacol. Exp. Ther. 338, 372–380 (2011). [DOI] [PubMed] [Google Scholar]
- 29. European Medicines Agency . Guideline on the reporting of physiologically based pharmacokinetic (PBPK) modelling and simulation (2018). https://www.ema.europa.eu/en/documents/scientific‐guideline/guideline‐reporting‐physiologically‐based‐pharmacokinetic‐pbpk‐modelling‐simulation_en.pdf
- 30. Taskar, K.S. et al PBPK models for evaluating membrane transporter mediated DDIs: Current capabilities, case studies, future opportunities and recommendations. Clin. Pharmacol. Ther. 107, 1082–1115 (2020). [DOI] [PMC free article] [PubMed] [Google Scholar]
- 31. Kharasch, E.D. , Bedynek, P.S. , Walker, A. , Whittington, D. & Hoffer, C. Mechanism of ritonavir changes in methadone pharmacokinetics and pharmacodynamics: II. Ritonavir effects on CYP3A and P‐glycoprotein activities. Clin. Pharmacol. Ther. 84, 506–512 (2008). [DOI] [PMC free article] [PubMed] [Google Scholar]
- 32. Hanke, N. et al PBPK Models for CYP3A4 and P‐gp DDI prediction: A modeling network of rifampicin, itraconazole, clarithromycin, midazolam, alfentanil, and digoxin. CPT: Pharmacometrics Syst. Pharmacol. 7, 647–659 (2018). [DOI] [PMC free article] [PubMed] [Google Scholar]
- 33. Qian, C.Q. , Zhao, K.J. , Chen, Y. , Liu, L. & Liu, X.D. Simultaneously predict pharmacokinetic interaction of rifampicin with oral versus intravenous substrates of cytochrome P450 3A/Pglycoprotein to healthy human using a semi‐physiologically based pharmacokinetic model involving both enzyme and transporter turnover. Eur. J. Pharm. Sci. 134, 194–204 (2019). [DOI] [PubMed] [Google Scholar]
- 34. Ball, K. , Jamier, T. , Parmentier, Y. , Denizot, C. , Mallier, A. & Chenel, M. Prediction of renal transporter‐mediated drug‐drug interactions for a drug which is an OAT substrate and inhibitor using PBPK modelling. Eur. J. Pharm. Sci. 106, 122–132 (2017). [DOI] [PubMed] [Google Scholar]
- 35. Posada, M.M. et al Prediction of Transporter‐Mediated Drug‐Drug Interactions for Baricitinib. Clin. Transl. Sci. 10, 509–519 (2017). [DOI] [PMC free article] [PubMed] [Google Scholar]
- 36. Nishiyama, K. , Toshimoto, K. , Lee, W. , Ishiguro, N. , Bister, B. & Sugiyama, Y. Physiologically‐based pharmacokinetic modeling analysis for quantitative prediction of renal transporter‐mediated interactions between metformin and cimetidine. CPT: Pharmacometrics Syst. Pharmacol. 8, 396–406 (2019). [DOI] [PMC free article] [PubMed] [Google Scholar]
- 37. Parvez, M.M. , Kaisar, N. , Shin, H.J. , Jung, J.A. & Shin, J.‐G. Inhibitory interaction potential of 22 antituberculosis drugs on organic anion and cation transporters of the SLC22A family. Antimicrob. Agents Chemother. 60, 6558–6567 (2016). [DOI] [PMC free article] [PubMed] [Google Scholar]
- 38. Frost, C. et al Safety, pharmacokinetics and pharmacodynamics of multiple oral doses of apixaban, a factor Xa inhibitor, in healthy subjects. Br. J Clin. Pharmacol. 76, 776–786 (2013). [DOI] [PMC free article] [PubMed] [Google Scholar]
- 39. Kubitza, D. , Becka, M. , Wensing, G. , Voith, B. & Zuehlsdorf, M. Safety, pharmacodynamics, and pharmacokinetics of BAY 59–7939–an oral, direct factor Xa inhibitor–after multiple dosing in healthy male subjects. Eur. J Clin. Pharmacol. 61, 873–880 (2005). [DOI] [PubMed] [Google Scholar]
- 40. Ding, R. et al Substantial pharmacokinetic interaction between digoxin and ritonavir in healthy volunteers. Clin. Pharmacol. Ther. 76, 73–84 (2004). [DOI] [PubMed] [Google Scholar]
- 41. Kirby, B.J. , Collier, A.C. , Kharasch, E.D. , Whittington, D. , Thummel, K.E. & Unadkat, J.D. Complex drug interactions of the HIV protease inhibitors 3: effect of simultaneous or staggered dosing of digoxin and ritonavir, nelfinavir, rifampin, or bupropion. Drug Metab. Dispos. 40, 610–616 (2012). [DOI] [PMC free article] [PubMed] [Google Scholar]
- 42. Rengelshausen, J. et al Contribution of increased oral bioavailability and reduced nonglomerular renal clearance of digoxin to the digoxin‐clarithromycin interaction. Br. J Clin. Pharmacol. 56, 32–38 (2003). [DOI] [PMC free article] [PubMed] [Google Scholar]
- 43. Gurley, B.J. , Swain, A. , Williams, D.K. , Barone, G. & Battu, S.K. Gauging the clinical significance of P‐glycoprotein‐mediated herb‐drug interactions: comparative effects of St. John's wort, Echinacea, clarithromycin, and rifampin on digoxin pharmacokinetics. Mol. Nutr. Food Res. 52, 772–779 (2008). [DOI] [PMC free article] [PubMed] [Google Scholar]
- 44. Johnson, B.F. , Wilson, J. , Marwaha, R. , Hoch, K. & Johnson, J. The comparative effects of verapamil and a new dihydropyridine calcium channel blocker on digoxin pharmacokinetics. Clin. Pharmacol. Ther. 42, 66–71 (1987). [DOI] [PubMed] [Google Scholar]
- 45. Rodin, S.M. , Johnson, B.F. , Wilson, J. , Ritchie, P. & Johnson, J. Comparative effects of verapamil and isradipine on steady‐state digoxin kinetics. Clin. Pharmacol. Ther. 43, 668–672 (1988). [DOI] [PubMed] [Google Scholar]
- 46. Frost, C.E. et al Effect of ketoconazole and diltiazem on the pharmacokinetics of apixaban, an oral direct factor Xa inhibitor. Br. J. Clin. Pharmacol. 79, 838–846 (2015). [DOI] [PMC free article] [PubMed] [Google Scholar]
- 47. Bashir, B. , Stickle, D.F. , Chervoneva, I. & Kraft, W.K. Drug‐drug interaction study of apixaban with cyclosporine and tacrolimus in healthy volunteers. Clin. Transl. Sci. 11, 590–596 (2018). [DOI] [PMC free article] [PubMed] [Google Scholar]
- 48. Mueck, W. , Kubitza, D. & Becka, M. Co‐administration of rivaroxaban with drugs that share its elimination pathways: pharmacokinetic effects in healthy subjects. Br. J. Clin. Pharmacol. 76, 455–466 (2013). [DOI] [PMC free article] [PubMed] [Google Scholar]
- 49. Greenblatt, D.J. , Patel, M. , Harmatz, J.S. , Nicholson, W.T. , Rubino, C.M. & Chow, C.R. Impaired rivaroxaban clearance in mild renal insufficiency with verapamil coadministration: Potential implications for bleeding risk and dose selection. J. Clin. Pharmacol. 58, 533–540 (2018). [DOI] [PubMed] [Google Scholar]
- 50. Vakkalagadda, B. et al Effect of rifampin on the pharmacokinetics of apixaban, an oral direct inhibitor of factor Xa. Am. J Cardiovasc. Drugs. 16, 119–127 (2016). [DOI] [PubMed] [Google Scholar]
Associated Data
This section collects any data citations, data availability statements, or supplementary materials included in this article.
Supplementary Materials
Supplementary Material