

Abstract
Isatuximab, a monoclonal antibody (mAb) of immunoglobulin G (IgG) isotype, specifically targets the cluster of differentiation 38 antigen overexpressed in malignant plasma cells. Isatuximab is used to treat multiple myeloma (MM), characterized by the excessive production of abnormal “myeloma proteins” (M‐proteins) that may interact with therapeutic IgG mAb on the neonatal Fc receptor (FcRn)‐mediated recycling pathway. The clinical pharmacology profile of isatuximab was investigated by population pharmacokinetics (PKs) modeling in 476 patients with MM who received 1–20 mg/kg isatuximab either as single agent or in combination with pomalidomide‐dexamethasone in 4 clinical trials. Isatuximab PKs were characterized by a two‐compartment model with parallel time‐varying linear clearance (CL) and nonlinear elimination. Due to a mechanism‐based drug‐disease interaction, patients secreting IgG M‐protein exhibited a twofold lower drug exposure compared with patients with non‐IgG MM. No dose adjustment was required based on MM immunoglobulin type because efficacy and safety profiles were comparable between IgG and non‐IgG MM subpopulations. β2‐microglobulin, body weight, sex, drug material, and race have a limited effect on drug exposure and do not require any dose adjustment. A typical 50% decrease in linear CL from initial treatment to steady‐state was predicted, and this decrease correlated with the best overall response rate and was slower for patients with IgG MM. These findings suggest that the time‐dependent effect of isatuximab is likely mediated by a combined factor of both disease state evolution and the perturbation of the FcRn‐mediated recycling pathway.
Study Highlights.
WHAT IS THE CURRENT KNOWLEDGE ON THE TOPIC?
☑ Isatuximab is a novel anti‐CD38 monoclonal antibody (mAb) that brings an important new treatment option for the management of patients with relapsed and refractory multiple myeloma . Preliminary pharmacokinetic (PK) assessment showed that isatuximab exhibits both a linear and nonlinear elimination pathway.
WHAT QUESTION DID THIS STUDY ADDRESS?
☑ A population PK (PopPK) model of isatuximab combining phase I, II, and III clinical trials was used to characterize the disease‐drug interactions that have an impact of drug exposure and that manifest as time‐varying clearance change over the course of treatment.
WHAT DOES THIS STUDY ADD TO OUR KNOWLEDGE?
☑ This is the first report of isatuximab PopPK analysis. Patients secreting immunoglobulin G (IgG) myeloma proteins showed a twofold lower drug exposure compared with patients with non‐IgG multiple myeloma (MM). Time‐dependent effect was found to be important with a 50% decrease in linear clearance after treatment. This decrease correlated with the best overall response rate and was slower for patients with IgG MM.
HOW MIGHT THIS CHANGE CLINICAL PHARMACOLOGY OR TRANSLATIONAL SCIENCE?
☑ This analysis expands our knowledge about the impact of disease‐drug interaction on mAb PK disposition. In MM, this analysis showed that the time‐dependent effect on mAb PK is likely mediated by a combined factor of both disease state improvement and the perturbation of the Fc receptor‐mediated recycling pathway.
Isatuximab (SAR650984) is an immunoglobulin G (IgG) 1 monoclonal antibody (mAb) that selectively binds to the human cell surface antigen molecule classified as cluster of differentiation 38 (CD38). CD38 is expressed in a number of hematological malignancies, including multiple myeloma (MM). Isatuximab has been found to kill tumor cells via multiple biological mechanisms. 1 , 2 , 3 , 4
The isatuximab clinical program in MM includes single agent and combination studies, one of which was a phase Ib open‐label study evaluating the combination of isatuximab at escalating doses plus pomalidomide‐dexamethasone in patients with relapsed/refractory multiple myeloma (RRMM) who had received greater than or equal to two prior therapies. 5 Based on results from this study, a phase III study (ICARIA‐MM, EFC14335) was conducted comparing isatuximab plus pomalidomide‐dexamethasone vs. pomalidomide‐dexamethasone in patients with RRMM. 6
The malignant cells of patients with MM produce excessive amounts of abnormal monoclonal IgG (so‐called myeloma protein (M‐protein)) usually of the IgG type. 7 Excessive amounts of IgG M‐protein can interfere with the clearance (CL) of IgG‐based therapeutic mAbs due to the competition between endogenous disease‐produced IgG and exogenous therapeutic IgG for neonatal Fc receptor (FcRn)‐mediated IgG protection. 8 In addition, recent observations for therapeutic biologics used for long‐term oncology treatment, show that the catabolism of therapeutic mAbs may not necessarily be constant within a given patient but may change over time. Reflecting this pattern, time‐varying CL has been recognized in drug labels for several mAbs. 9 , 10 , 11 , 12
Therefore, isatuximab data collected from patients with pharmacokinetic (PK) samples from single agent and combination trials collected during its clinical development provided a unique opportunity to understand the influence of the mechanism‐based interaction between isatuximab mAb and IgG M‐protein, or other clinical disease features that may impact the PKs. The impact of patient and disease characteristics, tumor burden, and number of prior therapies on isatuximab PK, were explored. Of special interest was to identify whether a time‐dependent PK behavior could be characterized, and to quantify the impact of time‐varying change along the course of treatment if observed.
This article presents a comprehensive population pharmacokinetic (PopPK) analysis, which was part of the filing for the indication of isatuximab plus pomalidomide‐dexamethasone in patients with RRMM. 6 On March 2, 2020, the US Food and Drug Administration (FDA) approved isatuximab‐irfc in combination with pomalidomide‐dexamethasone for adult patients with MM who have received greater than or equal to two prior therapies, including lenalidomide and a proteasome inhibitor. 13
METHODS
Data
Results from a phase I/II single agent trial, and phase I, phase Ib, and phase III combination trials with isatuximab, pomalidomide, and dexamethasone in patients with MM, were included in the analysis. Study designs and main clinical results have been previously published. 5 , 6 , 14
A total of 476 patients with MM and 7,697 plasma concentrations with an average of 16 observations per individual (range from 1–69), were analyzed. Isatuximab was given by intravenous infusion at doses ranging from 1 to 20 mg/kg, however, most of the patients were treated at 20 and 10 mg/kg (91% of total), which correspond to the recommended doses for single agent and combination therapy, respectively. 15 , 16 Table 1 summarizes the dosing regimens by study group and Table S1 summarizes the distribution of continuous and categorical baseline covariates that were tested in this analysis.
Table 1.
Dosing regimen and number of patients by study group
| Study | Dose level, mg/kg | Dosing regimen | Patients, N |
|---|---|---|---|
| TED10893 (11) | 1 | q2w | 3 |
| 3 | q2w | 28 | |
| 5 | q2w | 3 | |
| 10 | q4w then q2w | 6 | |
| 10 | q2w | 90 | |
| 20 | q4w then q2w | 122 | |
| 20 | q2w | 6 | |
| TED14154 (Clinicaltrials.gov, NCT02514668) | 10 | q4w then q2w | 12 |
| 20 | q4w then q2w | 14 | |
| TCD14079 (2) | 5 | q4w then q2w | 8 |
| 10 | q4w then q2w | 30 | |
| 20 | q4w then q2w | 6 | |
| EFC14335 (3) | 10 | q4w then q2w | 148 |
Abbreviations: Q2W, every 2 weeks; QWx4, every week for 4 weeks.
Plasma concentrations of functional isatuximab (isatuximab with at least one site available to bind the target) were measured in all studies using a validated enzyme‐linked immunosorbent assay assay with a lower limit of quantitation of 0.5 ng/mL. The method had an adequate sensitivity as well as good within‐run and between‐run accuracy (−6.6 to 14%) and precision (2.2–6.2%).
PopPK model development
The PopPK analysis was performed using nonlinear mixed effects modeling methodology, as implemented in the computer software Monolix 2018R1, with the Stochastic Approximation Expectation Maximization algorithm. Preprocessing and postprocessing of data from each modeling step was conducted using R software.
Data handling and methods for data imputation are detailed in Supplementary Materials (see Methods).
The PopPK model was developed in three stages, consisting of the base model, the full covariates model, and the final model. First, the base model was developed to describe the PKs of isatuximab without consideration of covariate effects. Second, the full covariates model was developed by incorporating the effect of all prespecified covariate parameter relationships. In the third stage, the final PopPK model was developed by retaining covariates that improved goodness‐of‐fit statistics (objective function (OF) value, Bayesian information criterion, and Akaike information criterion). Detailed method for the three stages of model building is reported in Supplementary Materials (see Methods).
PopPK model evaluation and applications
Following covariates selection, the final model was evaluated using standard goodness‐of‐fit plots and visual predictive checks (VPCs). The VPCs were performed with 500 simulated datasets that were obtained by using parameter values from the final model. The VPC provide a graphical assessment of the agreement between the time course of model predictions and observations. The check was performed by plotting the 5th, 50th, and 95th percentiles of observed and simulated plasma concentration–time data from patients of the phase III trial with the corresponding 90% prediction intervals.
The final PopPK model was applied to estimate individual measures of secondary exposure parameters, such as trough concentration (Ctrough), peak concentration (Cmax), and area under the curve (AUC) intended to be used for covariates impact, accumulation ratios, and steady‐state achievement documentation. Predictions and simulations from the final model were performed using the SimulX and mlx R packages.
RESULTS
Structural model and time‐dependency
As shown on stationary PopPK models performed during the early stage of drug development, the PKs of isatuximab were best described by a two‐compartment structural kinetic model with parallel linear and Michaelis–Menten eliminations from the central compartment, with a combined residual error model and interindividual variability (log‐normally or normally distributed) on all parameters. The equations of the structural model were as follows:
where L is the concentration of isatuximab in the central compartment, and A the amount in the peripheral one; , and are the first order linear elimination, plasma to tissue and tissue to plasma rate constants, respectively; Vc is the volume of distribution in the central compartment, Vp is the volume of distribution in the peripheral compartment; Vm and Km are the Michaelis–Menten elimination rate constants; and In(t) is the infusion rate.
This last structural model was the starting point to investigate time‐dependent models through various alternative functional forms.
Adding a time‐varying component to the elimination processes, either on the linear or nonlinear CL, led to a large decrease of OF value whatever the functional form used. The largest decrease in OF value was 631 and 488 points for linear and nonlinear CL, respectively. The time‐varying change was best described by a sigmoidal maximum effect (Emax) function. For instance, the time‐varying function for the linear CL (CLlin) was as follows:
where CLinf is the steady‐state value of the nonspecific linear CL (at infinite time); CLm is the log of the ratio of baseline clearance over steady‐state clearance, ; γ modulates the stiffness of the sigmoidal function; and KCL is the time needed to decrease (or increase, if Clm is negative) the baseline clearance by a factor of . In other words, at time t = KCL, CLlin is defined by . For a typical patient, KCL is approximately equal to TCL50, the time needed to reach a 50% decrease (or increase) of baseline clearance. This approximation could be obtained after some calculations that relate KCL to TCL50. More precisely, we have , which is approximately equal to 1 for CLm = 0.664 (i.e., the estimated typical value).
In order to allow either increased or decreased variation over time in CL, CLm was considered to be normally distributed. The next step was to try to include this time‐varying function in both linear and on‐linear CL simultaneously. However, even when considering the same magnitude of effect and/or the same time to reach 50% change for both linear and nonlinear CL, instability of such models was too high, probably due to overparameterization, and the convergence was never successful. Considering that the largest decrease in OF was obtained with time‐varying function on linear CL rather than nonlinear CL, and that linear CL is the predominant elimination pathway, the decision was made to go forward with time‐varying function implemented only on the linear CL.
All model parameters were well estimated with a good precision (relative standard error ≤ 16%). The typical linear CL at steady‐state was 0.00955 L/hour (0.229 L/day) and the typical volume of distribution of the central compartment and peripheral was 5.13 L and 3.62 L, respectively. All model parameters were consistent with the ones estimated from previously developed PopPK models based on stationary CL. 17
In a typical patient, the linear CL was found to decrease around 48% between treatment start and steady‐state through a sigmoidal decay, whereas the time needed to reach 50% decrease in linear CL was approximated to 1,055 hours (~ 6 weeks). The evolution of total CL with its linear and nonlinear components at 10 mg/kg once a week for 4 weeks (QWx4) then every 2 weeks (q2w) for a typical patient is illustrated in Figure 1 .
Figure 1.

Linear (nonspecific), nonlinear (target‐specific), and total clearance from final population PK model after a 10 mg/kg QWx4 then q2w dose. CL, clearance; PK, pharmacokinetic.
Covariates PopPK model
The screening of baseline covariates performed on individual PK parameters (empirical Bayesian estimates or simulated individual parameters based on the conditional distribution) and by using the univariate Monolix procedure selected a total of 15 covariates in addition to body weight. Thirty‐nine covariate vs. PK parameter relationships were integrated into the full model. After full model degradation procedure, six covariates were still significant (Wald test with a P value much lower than 0.01) and all presented an OF value increase of ≥ 7.88 units when backward deletion of covariates one at a time was performed.
The final equations for all the PK parameters are the following:
with
and
With CLlin, Vc, Vp, and Q being the structural model parameters for a two‐compartment kinetic model and standing for nonspecific linear CL (L/h), central volume of distribution (L), peripheral volume of distribution (L), and intercompartmental CL (L/h), respectively. For the covariates, BW, B2M, Ig type, Drug mat, Race, and Sex stand for body weight (kg), β2‐microglobuilin (mg/L), Ig MM type coded 1 if patients with non‐IgG MM and zero if there are patients with IgG MM, Drug mat coded 1, if using the new drug material and 0 otherwise, Asian coded 1 for Asian and zero for non‐Asian, and Sex coded 1 if female and 0 if male.
Population parameters from the final model together with their precision (standard error) are presented in Table S3 . All model parameters were well estimated with a good precision (relative standard error ≤ 25%, except for Q ~ Weight coefficient).
The magnitude of covariate effects on typical PopPK parameters and on secondary drug exposure in a typical patient according to 5th and 95th percentiles of the covariate distribution are summarized in Tables 2 and 3 .
Table 2.
Summary of covariates effects vs typical parameters values
| β2‐microglobulin (Median = 3.90) | Weight (Median = 75.6) | Ig Type | Drug material | Race | Sex | |||
|---|---|---|---|---|---|---|---|---|
| (mg/L) | (kg) | |||||||
| P5 | P95 | P5 | P95 | Not IgG vs. IgG | P2F2 vs. P1F1 | Asian vs. others | Female vs. male | |
| 1.87 | 12 | 51.3 | 109.5 | |||||
| CLinf | −22% | +47% | −21% | +26% | −53% | |||
| KCL | −61% | |||||||
| Vc | −17% | +19% | −13% | −24% | −12% | |||
| Q | −17% | +19% | ||||||
| Vp | −24% | +31% | ||||||
CLinf, linear clearance at steady‐state; Ig, immunoglobulin; KCL, parameter related to TCL50, being the time needed to reach 50% change of baseline clearance; P1F1, drug material used in the initial clinical trials; P2F2, drug material used for phase III study and intended for commercial use; P5, 5th percentile; P95, 95th percentile; Q, intercompartmental clearance; Vc, central volume of distribution; Vp, peripheral volume of distribution.
Table 3.
Summary of covariates effects on exposure parameters in a typical patient
| B2M (Med = 3.90) | Weight (Med = 75.6) | Ig type | Drug material (formulation) | Race | Sex | |||
|---|---|---|---|---|---|---|---|---|
| (mg/L) | (kg) | |||||||
| P5 | P95 | P5 | P95 | Not IgG vs. IgG | P2F2 vs. P1F1 | Asian vs. others | Female vs. Male | |
| 1.87 | 12.0 | 51.3 | 109.5 | |||||
| Cycle 1 | ||||||||
| Ctrough | ×1.22 | ×0.69 | ×0.82 | ×1.19 | ×1.78 | ×1.03 | ×1.06 | ×1.03 |
| Cmax | ×1.08 | ×0.88 | ×0.82 | ×1.21 | ×1.25 | ×1.10 | ×1.21 | ×1.09 |
| AUC | ×1.11 | ×0.82 | ×0.82 | ×1.20 | ×1.34 | ×1.06 | ×1.13 | ×1.06 |
| Cycle 2 | ||||||||
| Ctrough | ×1.38 | ×0.54 | ×0.78 | ×1.23 | ×2.62 | ×1.03 | ×1.05 | ×1.03 |
| Cmax | ×1.10 | ×0.86 | ×0.82 | ×1.20 | ×1.39 | ×1.10 | ×1.20 | ×1.09 |
| AUC | ×1.23 | ×0.70 | ×0.81 | ×1.20 | ×1.92 | ×1.04 | ×1.08 | ×1.04 |
| SS | ||||||||
| Ctrough | ×1.41 | ×0.57 | ×0.75 | ×1.26 | ×2.55 | ×1.05 | ×1.08 | ×1.04 |
| Cmax | ×1.18 | ×0.81 | ×0.79 | ×1.25 | ×1.69 | ×1.10 | ×1.21 | ×1.09 |
| AUC | ×1.30 | ×0.68 | ×0.78 | ×1.24 | ×2.12 | ×1.06 | ×1.11 | ×1.05 |
AUC, area under the curve; Cmax, maximal plasma concentration; Ctrough, trough plasma concentration; B2M, β2‐microglobulin; Ig, immunoglobulin; P1F1, drug material used in the initial clinical trials; P2F2, drug material used for phase III study and intended for commercial use; P5, 5th percentile; P95, 95th percentile; SS, steady‐state.
Cycle 1: up to week 4.
Ctrough is on week 4, Cmax on day 22, AUC is 0–4 weeks.
Cycle 2: from week 4 to week 8.
Ctrough is on week 8, Cmax on day 29 or day 36, AUC is 4–8 weeks.
SS: from week 150 to week 154.
Ctrough is on week 150, Cmax on day 1 week 150, AUC is 20–22 weeks.
The most influential covariate was MM Ig type (IgG vs. non‐IgG type). Patients with IgG MM exhibited a two times higher linear CL than patients with non‐IgG MM. The decrease in linear CL was approximately two times slower in patients with IgG MM compared with patients with non‐IgG MM (see Figure 2a ). Therefore, higher isatuximab concentrations were predicted in patients with non‐IgG MM compared with patients with IgG MM myeloma (see Figure 2b ). At steady‐state, the drug exposure (AUC between 2 weeks dosing interval) was about two‐fold higher in patients with non‐IgG MM compared with patients with IgG MM (see Table 3 ).
Figure 2.

Impact of myeloma type on nonspecific linear clearance and isatuximab concentrations profiles. (a) Typical nonspecific linear clearance by myeloma type. (b) Concentrations vs. time profile at 10 mg/kg QWx4 then q2w by myeloma type (men, weight = 75.6 kg, not Asian, B2M = 3.9 mg/L, P1F1 drug material). B2M, β2‐microglobulin; Ig, immunoglobulin.
Other statistically significant covariates (β2‐microglobulin, body weight, sex, Asian race, and drug material) showed a limited effect with a maximal variation at steady‐state exposure less than ± 40% at the 5th and 95th percentiles compared with the median value (see Table 3 ).
There was no effect of age, renal, or liver function impairment, nor impact of prior lines of chemotherapy. Additionally, there was no PK change between patients under single agent vs. combination with pomalidomide‐dexamethasone.
Model evaluation and simulations
Standard goodness‐of‐fit plots of the final PopPK model demonstrated a good description of the observed data (Figures S1 and S2 ). The VPC plot at the recommended 10 mg/kg dose shows that the observed concentration vs. time course of isatuximab at the 5th, 50th, and 95th percentiles fell within their corresponding 90% prediction intervals, indicating that the model adequately characterized the PKs of isatuximab (Figure S3 ).
Individual predicted model parameters (empirical Bayesian estimates) from the final model were used to perform simulations at the theoretical dose of 10 mg/kg QWx4 then q2w up to steady‐state. Individual secondary exposure parameters were derived to illustrate covariate effects on drug exposure. The forest plot of isatuximab exposure on cycle 6 (AUC over the dosing interval) stratified by patient characteristics is displayed in Figure 3 . These predictions confirmed that myeloma type was the most impactful covariate showing about 50% lower drug exposure in patients secreting IgG M‐protein compared with non‐IgG secretors. Moderate underexposure (around 40%) was predicted in patients with high β2‐microglobulin ≥ 7.5 mg/L vs. patients with lower β2‐microglobulin < 7.5 mg/L.
Figure 3.

Forest plot of AUC over the dosing interval on cycle 6 after a 10 mg/kg QWx4 then q2w dose (one cycle = 4 weeks). Typical patient information: phase 1, Isa, P2F2, prior lines = 4, age = 65 years, weight = 75.6 kg, men, nonobese, white, mild renal impairment, normal hepatic function, albumin = 37.5 mg/L, bone marrow plasma cells = 27.5%, ECOG = 1, ISS = 2, serum M‐protein, IgG. ALB, albumin; AUC, area under the curve; B2M, β2‐microglobulin; BMPC, bone marrow plasma cells; Cauc, Caucasian; CI, confidence interval; Dex, dexamethasone; Drug mat, drug material; ECOG, Eastern Cooperative Oncology Group performance status; HR, hazard ratio; Isa, isatuximab; ISS, International Staging System; Pom, pomalidomide; Wght, weight.
Some other covariates not retained in the final model also showed significant impact on drug exposure. For instance, lower isatuximab exposure was predicted with albumin decrease, bone marrow plasma cell increase, the presence of M‐protein, Eastern Cooperative Oncology Group (ECOG) = 2 or International Staging System (ISS) = 3. The impact of these covariates could be easily explained by their correlation with those retained in the final model. For instance, albumin, ECOG score, and ISS were closely correlated to β2‐microglobulin (data not shown) and all are related to the severity of the disease.
Median accumulation ratios of Ctrough and Cmax at steady‐state vs. first dose were predicted to be 3.1 and 1.8, respectively. Median accumulation ratios in patients with non‐IgG MM and patients with IgG MM were, respectively, 4.20 vs. 2.64 for Ctrough and 2.32 vs. 1.64 for Cmax.
The typical elimination half‐life at steady‐state calculated only from the linear CL was 28 and 57 days for IgG and non‐IgG MM subpopulations, respectively. At the beginning of treatment, the half‐lives were 15 and 30 days, respectively. Thus, the typical reporting of a single value of half‐life to characterize the PK elimination of therapeutic drugs was not relevant within the context of nonstationarity and nonlinear elimination processes exhibited by isatuximab. Simulations showed that the median time needed to eliminate 99% of the drug (Cmax value) once steady‐state was achieved, was 46 and 90 days for patients with IgG and patients with non‐IgG MM, respectively.
DISCUSSION
As commonly observed for IgG therapeutic mAbs, isatuximab PKs were well‐characterized by a two‐compartment structural kinetic model with parallel linear and nonlinear eliminations from the central compartment. Simulations of the time course of the total CL, with its linear and nonlinear components for a typical patient at 10 mg/kg QWx4, then q2w, show that the linear CL was the predominant elimination pathway and accounted for ~ 90% of the total CL (Figure 1 ), indicating target saturation. The saturation of the target at the ≥ 10 mg/kg dose was consistent with the clinical data on CD38 receptor occupancy in bone marrow plasma cells after 1 month of treatment. The relationship between CD38 receptor occupancy and isatuximab plasma concentration demonstrated that the saturation of the target (> 80% of target occupancy), was reached for concentrations corresponding to the ≥ 10 mg/kg q.w. dose level. 11
During the structural model building, inclusion of a function describing time‐varying change in linear CL significantly improved the model as compared to a static CL model.
For daratumumab, another anti‐CD38 mAb, time‐dependency was modeled as an exponential decrease of the nonlinear CL. 18 Mechanistically, the decrease over time of target‐mediated CL was interpreted as a reduction of the CD38 receptor due to tumor shrinkage. For isatuximab, the best fit of the data was obtained when time‐dependency was implemented on the linear CL. This finding agrees with the fact that the nonsaturable linear CL was the predominant pathway of elimination for the analyzed dataset, because most of the patients were treated at doses ≥ 10 mg/kg (91% of total data) and for whom, delivered concentrations were high enough to saturate the target.
Time‐varying CL has been increasingly documented in drug labels for therapeutic mAbs, 9 , 10 , 19 , 20 , 21 and is well‐characterized especially for immune checkpoint inhibitors. Reported data for nivolumab 22 and pembrolizumab 23 suggest that the decrease of linear CL over time may be associated with improvement in disease status, the corresponding decrease in inflammatory state and subsequent reversal of cancer‐related high protein turnover. In agreement with this hypothesis, the decrease of isatuximab CL was found to be correlated with best overall response rates. Based on the data collected in the ICARIA trial, 6 no significant difference was seen between linear CL in responder vs. nonresponder patients at baseline (P = 0.205, Wilcoxon test) and after 4 weeks of treatment (P = 0.074), whereas steady‐state linear CL was found to be significantly lower in responders (i.e., patients with partial, very good, or complete response) as compared with nonresponders (P = 0.0062; Figure S4 ). In order to illustrate this pattern, the evolution of the linear CL as a function to time (mean and 90% confidence interval of individual predicted values), was displayed separately in responders and nonresponders (Figure 4 ). It was observed that responder patients exhibit a steeper decrease and lower CL at the plateau, compared with nonresponder patients; a similar finding was observed for pembrolizumab. Based on an original modeling approach, Li et al. showed that the change of tumor size over the course of treatment was significantly associated with the change of linear CL for pembrolizumab. 23 Overall, these findings support the hypothesis of a time‐dependent CL affected by disease evolution.
Figure 4.
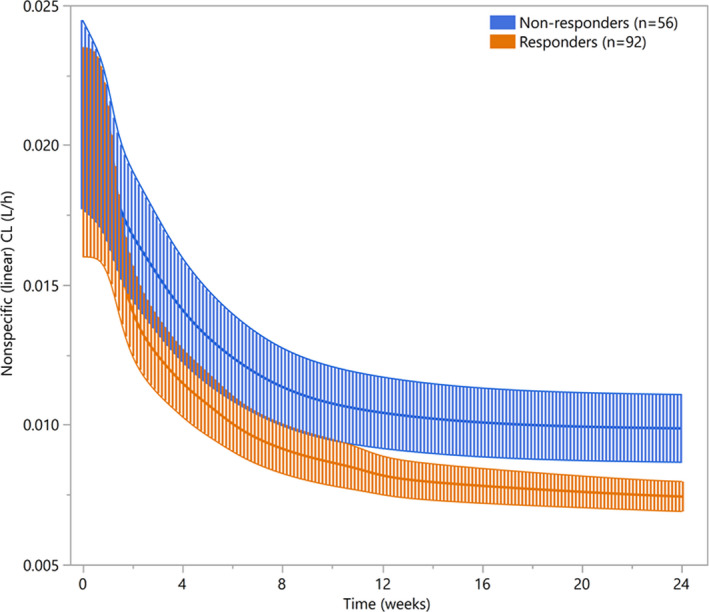
Mean (90% CI) nonspecific linear clearance according to BOR in phase III EFC14335 (ICARIA) study. BOR: best overall response; CI: confidence interval.
For isatuximab, the magnitude of CL change over time was larger than for other mAbs. An average 50% decrease was estimated for isatuximab from the first dose to steady‐state, whereas a 20–25% average decrease was reported for immune checkpoint inhibitor mAbs used in solid tumors. 22 , 23 The higher magnitude effect for isatuximab might be explained by perturbation of FcRn‐mediated recycling pathway, which is particularly pronounced in MM. This disease is characterized by high production of serum M‐protein, usually in the g/L range, which is ≥ 10 times higher than most therapeutic mAb concentrations. 22 About 50% of patients in the ICARIA trial had plasma levels of 20 g/L or more, and 64% of patients with MM secrete an IgG subtype that competes with all other IgG species for FcRn recycling. 25 This competing environment tends to decrease over time in responding patients as the tumor burden is reduced and, thus, translates to lower mAb CL. For daratumumab, a decrease in CL of up to threefold was predicted by a physiologically‐based PK model when M‐protein was reduced from 30 to 0 g/L, an ideal scenario for a fully responding patient. 26 This prediction is in line with the twofold magnitude reduction observed for isatuximab. In summary, it can be postulated that the relatively strong time‐dependency effect for isatuximab PK is likely due to a combined mechanism of disease state improvement, affecting protein turnover catabolism, and FcRn‐mediated recycling pathway competition.
For isatuximab, time‐dependent CL was best captured by a sigmoidal Emax function allowing for decreased, increased, or unchanged CL over time. A large interindividual variability was observed for this time‐dependent behavior, where ~ 15% of the patients experienced an increase in linear CL with time (see Figure S5 ).
Nonetheless, this time‐varying change, as it is implemented in this model, is an empirical function that has some limitations because it allows only unidirectional change for a given patient. However, multidirectional change of CL may be assumed for a given patient depending on its disease evolution. For instance, a patient who quickly responds may present a sharp decrease of CL at the early stage of the treatment, thereafter CL decrease may slow down over the treatment course, and ultimately increase in the later treatment stage as the patient relapses. Li et al. 24 provided a mechanistic based dynamic model for pembrolizumab CL enabling multidirectional change for a given patient. The change of tumor size, lymphocyte count, albumin, and lactate dehydrogenase were significantly correlated with the change in pembrolizumab CL; the time‐course of tumor size showing the highest correlation. 24
For isatuximab, longitudinal variation of M‐protein can be used as a surrogate of both tumor burden and disease evolution. Longitudinal changes of serum M‐protein were well‐predicted by classical PK/pharmacodynamic (PD) modeling and this last model was used to support dose finding rationale before phase III initiation. 17 One way to improve the time‐dependent PK model for isatuximab using a mechanistic approach would be to link the PK/PD model to the time‐dependent CL. Such a model implies that the PK affect the PD and that inversely the PD interacts with PK. This PK/PD‐PK mutual interaction model is currently investigated and could better describe both PK and PD observations.
The PopPK analysis identified body weight, β2‐microglobulin, and MM Ig type (IgG vs. non‐IgG patients) as significant covariates affecting linear CL, while body weight, race (Asian vs. non‐Asian), sex, and drug material, were found to be significant covariates affecting the central volume of distribution. Overall, these covariates taken together did not explain much of the interindividual variability and each one has a limited impact on drug exposure (see Table 3 ).
The most impactful covariate was MM Ig type, with a twofold lower drug exposure at steady‐state in patients with IgG MM compared with non‐IgG MM ones, whereas none of the other covariates resulted in an appreciable change in drug exposure (i.e., maximal variation below 40%). However, because safety profiles were comparable between patients with IgG MM and patients with non‐IgG MM and there was no significant difference in treatment effect of the isatuximab plus pomalidomide‐dexamethasone over the pomalidomide‐dexamethasone regimen on progression‐free survival hazard ratio for IgG patients vs. non‐IgG patients, nor on overall response rate, the difference in drug exposure is not considered clinically meaningful. 27 The same findings were observed for daratumumab. 28 The PopPK analysis of daratumumab showed that myeloma Ig type was the main predictor of PK variability with about twofold lower exposure in patients with IgG MM vs. patients with non‐IgG MM, 28 the influence of other covariates on daratumumab exposure being minimal. Similar to isatuximab, efficacy and safety profiles were comparable between patients with IgG MM and patients with non‐IgG MM in response to daratumumab treated patients. 28 Altogether, those findings suggest that patients with IgG MM type may be more sensitive and responsive to anti‐CD38 mAb therapy.
Specific to myeloma, β2‐microglobulin is one of the two factors used for staging the disease (ISS) and increased levels of serum β2‐microglobulin in patients with MM have been associated with a poor prognosis. 14 Because the catabolism of proteins, including endogenous and exogenous Ig (such as therapeutic mAbs) are impacted in patients with cancer with higher catabolism for patients with more advanced disease, 22 it is not unexpected that β2‐microglobulin levels were positively correlated with linear CL.
This PopPK analysis confirmed the relevance of body weight as a statistically significant covariate affecting both CL and distribution volumes. Simulations showed that a mg/kg‐based dosing predicted homogenous plasma drug exposure whereas flat dosing predicted statistically significant overexposure in underweight patients (< 50 kg, n = 14) and underexposure in overweight patients (≥ 100 kg, n = 44) compared with normal weight patients (50–100 kg, n = 418; data not shown). The above findings support the rationale of body weight‐based dosing as recommended in the drug label. Proliferation of M‐protein has several deleterious effects on many organs, including the kidneys. In the analyzed dataset, 77% of patients had some degree of pre‐existing renal impairment. The PopPK analysis presented here demonstrated no significant difference in isatuximab exposure due to renal or hepatic impairment, or age (< 75 years old and ≥ 75 years old), and therefore no dose adjustment for these populations is recommended.
CONCLUSION
Due to a mechanism‐based disease‐drug interaction, patients secreting IgG M‐proteins showed approximately twofold lower drug exposure compared with patients with non‐IgG. Although the impact on drug exposure was significant, no dose adjustment is required based on MM Ig type because both IgG and non‐IgG subpopulations demonstrate comparable safety profiles with no gain in efficacy for non‐IgG patients. An average 50% decrease in linear CL from initial treatment to steady‐state was predicted. This decrease correlated with the response to isatuximab treatment and was slower for patients with IgG MM. These findings suggest that the time‐dependent effect of isatuximab is likely mediated by a combined factor of both disease state improvement and the perturbation of the FcRn‐mediated recycling pathway. Further development of a mechanistic‐based time‐dependent model is warranted by including the mutual interplay between time‐dependent PK and the longitudinal variation of serum M‐protein.
Funding
This work was supported by Sanofi Pharmaceuticals.
Conflict of Interest
J.‐B.F., R.E.‐C., C.B., K.K., N.M., D.S., F.C., and L.N. are employees of Sanofi Pharmaceuticals.
Author Contributions
J.‐B.F., R.E.‐C., C.B., K.K., N.M., D.S., and L.N. wrote the manuscript. F.C. designed the research. R.E.‐C. performed the research. J.‐B.F., R.E.‐C., C.B., K.K., N.M., D.S., and L.N. analyzed the data.
Supporting information
Supplementary Material S1
Table S1‐S3
Fig S1‐S5
Supplementary Material S2
Acknowledgment
The authors would like to thank Leonid Gibiansky (QuantPharm LLC, Inc.) for his advice and expertise in the development of the isatuximab model.
References
- 1. Deckert, J. et al SAR650984, a novel humanized CD38‐targeting antibody, demonstrates potent antitumor activity in models of multiple myeloma and other CD38+ hematologic malignancies. Clin. Cancer Res. 20, 4574–4583 (2014). [DOI] [PubMed] [Google Scholar]
- 2. Jiang, H. et al SAR650984 directly induces multiple myeloma cell death via lysosomal‐associated and apoptotic pathways, which is further enhanced by pomalidomide. Leukemia 30, 399–408 (2016). [DOI] [PubMed] [Google Scholar]
- 3. van de Donk, N.W. et al Monoclonal antibodies targeting CD38 in hematological malignancies and beyond. Immunol. Rev. 270, 95–112 (2016). [DOI] [PMC free article] [PubMed] [Google Scholar]
- 4. Atanackovic, D. , Steinbach, M. , Radhakrishnan, S.V. & Luetkens, T. Immunotherapies targeting CD38 in multiple myeloma. Oncoimmunology 5, e1217374 (2016). [DOI] [PMC free article] [PubMed] [Google Scholar]
- 5. Mikhael, J. et al A phase 1b study of isatuximab plus pomalidomide/dexamethasone in relapsed/refractory multiple myeloma. Blood 134, 123–133 (2019). [DOI] [PMC free article] [PubMed] [Google Scholar]
- 6. Attal, M. et al Isatuximab plus pomalidomide and low‐dose dexamethasone versus pomalidomide and low‐dose dexamethasone in patients with relapsed and refractory multiple myeloma (ICARIA‐MM): a randomised, multicentre, open‐label, phase 3 study. Lancet 394, 2096–2107 (2019). [DOI] [PubMed] [Google Scholar]
- 7. Kyle, R.A. et al Review of 1027 patients with newly diagnosed multiple myeloma. Mayo Clin. Proc. 78, 21–33 (2003). [DOI] [PubMed] [Google Scholar]
- 8. Provan, D. , Baglin, T. , Dokal, I. & Vos, J.D.J.D. Oxford Handbook of Clinical Haematology. (Oxford University Press, Oxford, UK, 2015). [Google Scholar]
- 9. US Food and Drug Administration . Avelumab label. <https://www.fda.gov/drugs/drug‐approvals‐and‐databases/fda‐approves‐avelumab‐urothelial‐carcinoma‐maintenance‐treatment> (2018).
- 10. US Food and Drug Administration . Atezolizumab label. <https://www.fda.gov/drugs/resources‐information‐approved‐drugs/atezolizumab‐tecentriq> (2018).
- 11. Sullivan, J. , Pravosud, V. , Mannino, D.M. , Siegel, K. , Choate, R. & Sullivan, T. National and state estimates of COPD morbidity and mortality ‐ United States, 2014–2015. Chronic Obstr. Pulm. Dis. 5, 324–333 (2018). [DOI] [PMC free article] [PubMed] [Google Scholar]
- 12. Richardson, P.G. et al Isatuximab plus pomalidomide/dexamethasone versus pomalidomide/dexamethasone in relapsed/refractory multiple myeloma: ICARIA phase III study design. Future Oncol. 14, 1035–1047 (2018). [DOI] [PubMed] [Google Scholar]
- 13. Sarclisa (isatuximab‐irfc) [package insert]. Bridgewater, NJ: Sanofi‐aventis U.S. LLC; 2020. [Google Scholar]
- 14. Martin, T. et al Phase I trial of isatuximab monotherapy in the treatment of refractory multiple myeloma. Blood Cancer J. 9, 41 (2019). [DOI] [PMC free article] [PubMed] [Google Scholar]
- 15. Rachedi, F. et al Exposure‐response analyses and disease modeling for selection and confirmation of optimal dosing regimen of isatuximab in combination treatment in patients with multiple myeloma. Blood 134 (suppl. 1), 1897 (2019). [Google Scholar]
- 16. Thai, H.‐T. et alExposure‐response analysis & disease modeling for selection of optimal dosing regimen of isatuximab as single agent in patients with multiple myeloma. In 24th Congress of the European Hematology Association.
- 17. Thai, H.‐T. et al Model‐based drug development to support isatuximab dosing regimen selection in Phase II multiple myeloma patients. Population Approach Group Europe (PAGE), 25, Abstract 6018 (2016). [Google Scholar]
- 18. Yan, X. et al Target‐mediated drug disposition of daratumumab following intravenous infusion in relapsed or refractory multiple myeloma after prior proteasome inhibitors and immunomodulatory drugs: a population pharmacokinetic analysis. Blood 126, 4222 (2015). [DOI] [PMC free article] [PubMed] [Google Scholar]
- 19. US Food and Drug Administration . Pembrolizumab label. <https://www.fda.gov/drugs/drug‐approvals‐and‐databases/fda‐approves‐pembrolizumab‐cutaneous‐squamous‐cell‐carcinoma> (2018).
- 20. US Food and Drug Administration . Nivolumab label. <https://www.fda.gov/drugs/drug‐approvals‐and‐databases/fda‐approves‐nivolumab‐esophageal‐squamous‐cell‐carcinoma>(2018).
- 21. US Food and Drug Administration . Durvalumab label. <https://www.fda.gov/drugs/resources‐information‐approved‐drugs/durvalumab‐imfinzi> (2018).
- 22. Bajaj, G. , Wang, X. , Agrawal, S. , Gupta, M. , Roy, A. & Feng, Y. Model‐based population pharmacokinetic analysis of nivolumab in patients with solid tumors. CPT Pharmacometrics Syst. Pharmacol. 6, 58–66 (2017). [DOI] [PMC free article] [PubMed] [Google Scholar]
- 23. Li, H. et al Time dependent pharmacokinetics of pembrolizumab in patients with solid tumor and its correlation with best overall response. J. Pharmacokinet. Pharmacodyn. 44, 403–414 (2017). [DOI] [PubMed] [Google Scholar]
- 24. Li, H. , Sun, Y. , Yu, J. , Liu, C. , Liu, J. & Wang, Y. Semimechanistically based modeling of pembrolizumab time‐varying clearance using 4 longitudinal covariates in patients with non‐small cell lung cancer. J. Pharm. Sci. 108, 692–700 (2019). [DOI] [PubMed] [Google Scholar]
- 25. Rajkumar, S.V. et al International Myeloma Working Group updated criteria for the diagnosis of multiple myeloma. Lancet Oncol. 15, e538–e548 (2014). [DOI] [PubMed] [Google Scholar]
- 26. Abdallah, H.M. & Zhu, A.Z.X. A minimal physiologically‐based pharmacokinetic model demonstrates role of the neonatal Fc receptor (FcRn) competition in drug‐disease interactions with antibody therapy. Clin. Pharmacol. Ther. 107, 423–424 (2019). [DOI] [PubMed] [Google Scholar]
- 27. US Food and Drug Administration Center for Drug Evaluation and Research . NDA/BLA Multi‐Disciplinary Review and Evaluation; NDA 213217: BRUKINSA (zanubrutinib). <https://www.accessdata.fda.gov/drugsatfda_docs/nda/2019/213217Orig1s000MultidisciplineR.pdf> (2019).
- 28. Yan, X. et al Influence of disease and patient characteristics on daratumumab exposure and clinical outcomes in relapsed or refractory multiple myeloma. Clin. Pharmacokinet. 57, 529–538 (2018). [DOI] [PMC free article] [PubMed] [Google Scholar]
Associated Data
This section collects any data citations, data availability statements, or supplementary materials included in this article.
Supplementary Materials
Supplementary Material S1
Table S1‐S3
Fig S1‐S5
Supplementary Material S2