

We developed a mathematical model to predict the outcomes of different possible COVID-19 treatments.
Abstract
To affect the COVID-19 pandemic, lifesaving antiviral therapies must be identified. The number of clinical trials that can be performed is limited. We developed mathematical models to project multiple therapeutic approaches. Our models recapitulate off-treatment viral dynamics and predict a three-phase immune response. Simulated treatment with remdesivir, selinexor, neutralizing antibodies, or cellular immunotherapy demonstrates that rapid viral elimination is possible if in vivo potency is sufficiently high. Therapies dosed soon after peak viral load when symptoms develop may decrease shedding duration and immune response intensity but have little effect on viral area under the curve (AUC), which is driven by high early viral loads. Potent therapy dosed before viral peak during presymptomatic infection could lower AUC. Drug resistance may emerge with a moderately potent agent dosed before viral peak. Our results support early treatment for COVID-19 if shedding duration, not AUC, is most predictive of clinical severity.
INTRODUCTION
The coronavirus disease 2019 (COVID-19) pandemic is a devastating historical event, which is currently affecting nearly all of mankind. Severe acute respiratory syndrome coronavirus 2 (SARS-CoV-2) incidence is surging in numerous cities and countries across the globe (1), and infection carries a high mortality rate, particularly among the elderly (2–4). While social distancing has slowed and even eliminated many local epidemics (5), it is not an economically viable long-term strategy. There is no evidence of widespread herd immunity, and a vaccine is unlikely to be developed and widely implemented within the next 6 months. Therefore, second and third waves of infection are likely to occur over the next 2 years (6).
It is imperative that optimal treatment strategies of COVID-19 are identified as quickly as possible to ensure lower fatality rates during subsequent local epidemics. To date, selection of antiviral agents has been empirical and guided by limited or absent data. While clinical trials are being fast-tracked to identify therapeutics that lower hospitalization and death rates, the planning phase for these trials is narrow. Therefore, effective tools are urgently needed to optimize clinical trial design and selection of therapeutic agents.
Here, we use mathematical models to project the possible impact of two small molecular agents, remdesivir and selinexor, as well as broadly neutralizing antibodies (bNAbs) and cellular immunotherapies. The goal of our models is to interpret emerging clinical trial data and, in turn, to perfect subsequent trials in terms of selection of antiviral agents, timing of therapy, dosage, treatment duration, avoidance of drug resistance, and selection of virologic end points. Overall, our simulations support initiation of therapy soon after symptoms develop and also suggest the urgent need for studies to identify virologic surrogates of SARS-CoV-2 severity.
RESULTS
SARS-CoV-2 natural history
We used four datasets of SARS-CoV-2 shedding in the absence of effective treatment to develop and validate a mathematical model. These data included 25 infected people: 11 from Singapore (7), 9 from Germany (8), 1 from South Korea (9), and 4 from France (10) (Fig. 1). Notably, sampling techniques differed across studies. In Singapore, South Korea, and France, samples were obtained with nasopharyngeal swabs, whereas in Germany viral loads were measured directly from sputum. Shedding was notable for an early peak, followed by three phases of viral decay including a rapid initial decline from peak, a slower period of decay of variable length, and a final abrupt viral elimination phase. Of note, we only captured the viral peak and the final rapid clearance phase in a subset of study participants.
Fig. 1. Mathematical model recapitulation of untreated SARS-CoV-2 kinetics.
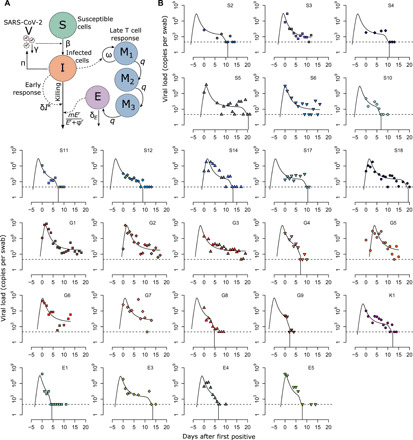
(A) Mathematical model schematic including infection of susceptible cells (S), production of virus (V) by infected cells (I), an early density-dependent immune response governed by exponent k, and a mounting T cell response with sequential populations of T cells (M1, M2, and E), which kill infected cells when above a certain threshold. (B) Model fit to individual data. Shapes are individual viral loads, and lines are model load projections. S, Singapore; G, Germany; K, South Korea; F, France.
SARS-CoV-2 mathematical model
We developed a series of ordinary differential equations to fit to the viral load data (Fig. 1A; Materials and Methods). The equations capture the coupled interactions of susceptible cells, infected cells, SARS-CoV-2, and a mounting immune response. In keeping with the standard viral dynamics model (11, 12), virus enters susceptible cells and converts them to infected cells, which then produce virus at a fixed rate. The virus induces a cytopathic effect on infected cells even in the absence of immunity.
An early innate immune response and a late acquired immune response are known to be vital for clearance of SARS and Middle East respiratory syndrome (MERS) virus infections (13). In keeping with these observations, when we simulated our model without innate and acquired immune terms (thereby limiting the mechanism of viral elimination to target cell limitation), model fit to the data was poor. We therefore added a two-stage immune response. The first stage accounts for the rate of infected cell elimination by the innate immune system and is governed by an exponent in the infected cell death rate term; in accordance with previous models, we refer to this as the density-dependent immune response (14, 15). The second phase represents a slower acquired cytolytic response in which the per-cell killing rate saturates once the number of effector cells exceeds a certain level. We model this with stages of presumed effector cell precursors that differentiate at rate q as a method to calibrate timing of this response (Materials and Methods).
Our model reproduced viral load kinetics in all 25 participants (Fig. 1B). In certain cases, the model only fit to available data from the later stages of shedding, whereas it recapitulated the entirety of viral expansion, peak, and decelerating clearance for the several study participants with available early data (S5, S14, S18, G1, G2, G5, and G7). In keeping with observations from a recent clinical trial (16), low-level shedding continued past 20 days for 8 of 25 participants (S3, S6, G1, G2, G3, G5, G6, and G7), whereas viral elimination occurred earlier in the remaining infected people.
The component of the late acquired immune response responsible for elimination of infection remains unknown. Virus-specific antibodies (17, 18), as well as virus-specific CD4+ and CD8+ T cell responses (19–22), are noted as soon as a week after infection. To account for the fact that humoral immunity may be clearing infection, we also constructed a model in which neutralizing antibodies lower viral infectivity in a density-dependent manner (Materials and Methods). In this model, infectivity rate saturates once the total number of antibodies exceeds a certain level. We achieved equal fit to the data whether we assumed a cytolytic T cell–mediated response (Fig. 1B) or a neutralizing antibody response (fig. S1). We are therefore unable to identify which mechanism is responsible for late clearance of virus, although both models provide the same output with simulation of therapies.
While both models allow equivalent viral kinetics, for several reasons, we selected the cytolytic immune model for our therapy modeling. First, depletion of virus-specific T cells abrogates control of SARS in mice (23, 24); interferon signaling to T cells is vital to elimination of both MERS and SARS (25). Second, severe SARS-CoV-2 is observed in solid organ transplantation patients on T cell–suppressing therapies (26). Third, impaired T cell function is the primary risk factor for severe lung manifestations of nearly all other respiratory viruses (27, 28). Last, T cells play a vital role in mediating cytokine storm and acute respiratory distress syndrome following SARS (29, 30): The intensity of the cytokine response is projected indirectly in our model based on quantification of the cytolytic response.
Timing and intensity of innate and acquired cytolytic responses
We continuously quantified the value of the immune terms in all 25 participants: The per-cell killing rate and total number of cells killed per day were extremely high during the first several days of infection in all participants (Fig. 2, A and B), coinciding with peak viral load. The acquired cytolytic immune response initiated at various time points across participants (days 5 to 14) and led to similar contemporaneous per-cell killing rates to innate immune responses, but much lower numbers of total cells killed per day relative to the innate response at peak viral load (Fig. 2B), but was sufficient and necessary to eliminate remaining infection (Fig. 1B).
Fig. 2. Early innate and late acquired killing rates of SARS-CoV-2–infected cells.
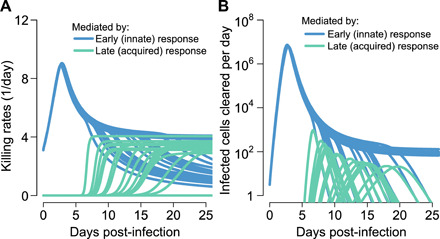
Model projections of rates in 15 participants who cleared viral shedding. (A) Per-cell death rate mediated by innate responses (blue) and acquired immune responses (green). (B) Total death rate mediated by innate responses (blue) and acquired responses (green).
Remdesivir pharmacokinetics and pharmacodynamics
We developed a pharmacokinetic (PK)/pharmacodynamic (PD) model of remdesivir (Fig. 3A), a broad-spectrum nucleotide analogue that targets SARS-CoV-2 replication in infected cells (31). The model links intravenous administration with plasma levels of free drug and concentrations of the drug’s active nucleoside triphosphate (NTP) component observed within peripheral blood mononuclear cells (PBMCs) in nonhuman primates (NHPs) (32) and captures the slow decay of NTP within this compartment (Fig. 3B). With multiple doses, we project fluctuating levels of NTP in target cells over time (Fig. 3C) followed by somewhat protracted decay after cessation of treatment.
Fig. 3. Projected PK and PD of remdesivir therapy.
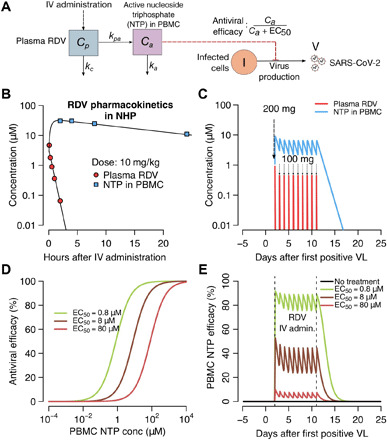
(A) Complete model of remdesivir (RDV) including plasma levels of parent drug, intracellular levels of the active component (NTP), and antiviral efficacy of drug according to NTP concentration. (B) Projections of plasma remdesivir levels and intracellular NTP in PBMCs. Data points from NHP experiments are dots, while lines are model projections. (C) Simulated concentrations of the parent compound and intracellular levels of the active compound with a loading dose of 200 mg intravenously (IV) followed by nine daily doses of 100 mg intravenously. VL, viral load. (D) PD projections of antiviral efficacy according to drug concentration assuming different values for the in vivo EC50 of the drug. (E) Projected antiviral effects using combined PK and PD models at different assumed drug potencies.
We next simulated possible dose-response curves of antiviral efficacy, which capture the percentage of viral replication eliminated, according to micromolar concentration of drug. The percentage of viral replication suppression at a given intracellular drug concentration is dependent on the intracellular EC50 of the drug, or the concentration of drug required to lower viral replication by 50% (Fig. 3D). Of note, the intracellular EC50 is unknown for remdesivir, particularly in vivo, making precise predictions of clinical trial outcomes impossible.
Last, we combined the PK and PD models as in Fig. 3A to project the percentage of viral replication inhibited over time at different assumed intracellular EC50 values (33, 34). With high assumed drug potency (EC50 = 0.8 μM), antiviral effects are sustained over the 10-day dosing interval and maintained for several days after drug delivery has stopped (Fig. 3E). At higher assumed EC50 values, remdesivir potency is projected to be lower.
Projections of SARS-CoV-2 outcomes assuming remdesivir treatment during early and late symptomatic phases
We next simulated therapy at day 10 of infection (Fig. 4A) when severely infected people often seek hospital care, and at day 5 of infection immediately after viral peak (Fig. 4B) when infected people often become symptomatic. In both cases, when remdesivir in vivo potency was assumed to be high (EC50 = 0.8 μM), viral elimination occurred rapidly after initiation of therapy. This effect occurred because of unopposed removal of approximately 100 to 10,000 infected cells per day by an ongoing innate immune response (Fig. 2B).
Fig. 4. Treatment projections of a 10-day remdesivir course assuming different potency and timing of treatment.
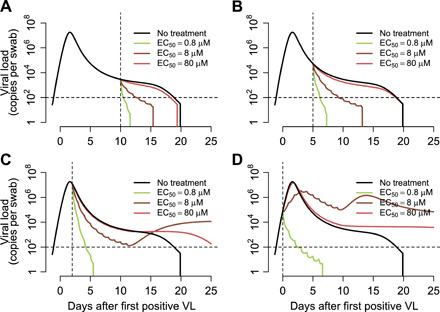
Each set of simulations is performed under assumptions of high, medium, and low potency (EC50 = 0.8, 8, and 80 μM, respectively). Treatment initiation at time points generally consistent with (A) hospitalization (day 10 after first positive sample), (B) first symptoms (day 5 after first positive sample), (C) presymptomatic post-peak phase (day 2 after first positive sample), and (D) presymptomatic pre-peak phase (day 0). Overall, early potent treatment limits duration of infection. Prolonged shedding is predicted as a possibility with subpotent, early initiation of therapy due to inadequate activation of immunity.
Simulations with the assumption of a less potent version of remdesivir (EC50 = 8 or 80 μM) resulted in a lower viral clearance slope. This result implies that viral clearance slope in clinical trials can be used in concert with our model to directly estimate the in vivo intracellular EC50 value of remdesivir in each treated patient. The model can then be used to project the effect of increasing or decreasing doses in subsequent trials (34).
Projections of SARS-CoV-2 outcomes assuming extremely early remdesivir treatment during the presymptomatic phase
We next performed simulations of therapy at very early time points during infection at and before peak viral load. Most infected people are presymptomatic at this stage, so these model realizations may most closely reflect implementation of a postexposure prophylaxis (PEP) strategy in which some people are already in the very early stages of infection at the time of first dose. Under this scenario, extremely potent (EC50 = 0.8 μM) therapies at days 2 and 0 of infection resulted in immediate viral suppression (Fig. 4, C and D). With early, low, or moderate potency treatment, the model predicted therapeutic failure with prolonged SARS-CoV-2 shedding due to inadequate early immunity against the virus and the lack of depletion of susceptible cells due to treatment-induced reduction in viral replication (Fig. 4D). Of note, projection of higher viral loads in these simulations beyond 10 days is less certain based on limited available data regarding drivers of acquired immune responses.
Projections of short course remdesivir
We next repeated the above exercise with a shorter 5-day course of treatment. Results were similar, although simulations under the assumption of extremely early initiation of therapy did not lead to full SARS-CoV-2 suppression within this time frame (fig. S2). Simulated extremely early treatment with moderate or high drug potency showed suppression followed by viral rebound (fig. S2D). Notably, this same outcome was observed in the nasal passages of two rhesus macaques treated with remdesivir 12 hours after infection. These animals contemporaneously more efficiently eliminated virus from the lungs (35).
Predictors of therapeutic efficacy for remdesivir
We next assessed which unknown variables in our therapeutic model were most predictive of relevant therapeutic outcomes. As independent variables, we selected in vivo intracellular EC50, because the in vivo potency of remdesivir against SARS-CoV-2 in humans is unknown, as well as infection duration at the time of treatment initiation. As dependent variables, we selected shedding duration and viral area under the curve (AUC) because it is unclear which of these outcomes is a stronger predictor of progression to cytokine storm and respiratory failure, as well as transmissibility, in infected people. We also included the final tally of effector cells, as this outcome may also be predictive of likelihood of cytokine storm (36).
Early initiation of a highly potent therapy was predictive of lower shedding duration whether given in the pre-peak asymptomatic phase or in the post-peak symptomatic phase beyond days 2 to 4 of infection. However, extremely early initiation of a lower potency therapy was predicted to prolong shedding relative to no treatment (Fig. 5A), due to insufficient early immunity against the virus and the lack of depletion of susceptible cells.
Fig. 5. Predictors of SARS-CoV-2 treatment outcomes with remdesivir.
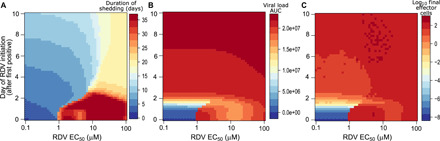
Heatmaps comparing variance in drug potency measured by in vivo EC50 (x axis) and timing of treatment initiation (y axis) for (A) shedding duration, (B) viral load AUC, and (C) extent of T cell response required for viral elimination. Potent therapy within the first 5 days of infection limits shedding duration and the extent of the T cell response. However, only extremely early therapy during the presymptomatic phase of infection markedly lowers viral AUC. Subpotent therapy given during the extremely early presymptomatic stage may extend shedding duration at lower viral loads by limiting the immune response.
Both high drug potency and extremely early treatment initiation during the presymptomatic stage of infection were required to substantially lower viral AUC. Even highly potent therapy during the earliest symptomatic phase at days 4 to 5 had only a slight impact on AUC, reflecting the fact that most virus and infected cells are generated during the first 2 to 3 days of productive SARS-CoV-2 infection (Fig. 5B) (35).
Last, initiation of a highly potent therapy within 6 days of infection lowered the extent of the effector cell response in our simulations by a full order of magnitude (Fig. 5C), which suggests that an early treatment strategy could lower deleterious infection associated with inflammation.
Theoretical kinetics of drug-resistant variants
On the basis of the mutation rate of positive single-stranded RNA (ssRNA) viruses of approximately 10−5 mutations per base pair per cell infection (37), and on the fact that two separate mutations may induce partial remdesivir resistance in SARS, which, in turn, leads to a less fit virus (38), we explored the theoretical possibility that a drug-resistant mutant could emerge during treatment. Under this hypothesis, we then estimated the probability that a drug-resistant mutant would emerge during therapy. When we assumed a potent therapy (EC50 = 0.8), the model projects that while single and double mutants emerge, they remain subdominant and do not meaningfully extend duration of shedding if dosed during the symptomatic phase of disease, although resistant strains may emerge and even predominate with early dosing (Fig. 6, A and B). However, if only moderate potency is assumed, then a single mutant with resistance is predicted to possibly induce more prolonged shedding, particularly if therapy is initiated before or during viral peak (Fig. 7, A and B).
Fig. 6. Projections of remdesivir drug resistance during therapy.
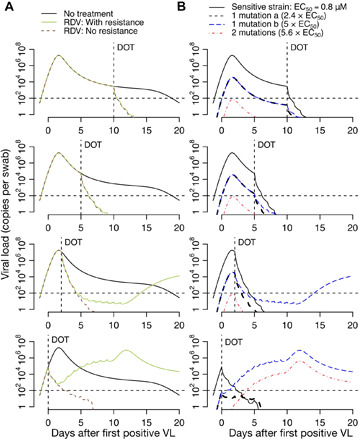
Simulations are with assumed high potency (EC50 = 0.8 μM) and the assumption that mutants confer partial drug resistance. Treatment initiation is at time points generally consistent with hospitalization (day 10 after first positive sample), first symptoms (day 5 after first positive sample), presymptomatic post-peak phase (day 2 after first positive sample), or presymptomatic pre-peak phase (day 0). (A) Projections of no treatment, treatment with no assumed drug resistance, and treatment with assumed drug resistance. (B) Projections of assumed drug resistance with trajectories of sensitive strains, single mutants, and double mutants. Here, DOT represents the day of the start of the treatment.
Fig. 7. Projections of remdesivir drug resistance during therapy.
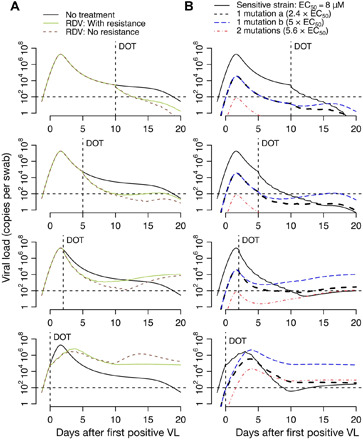
Simulations are with moderate potency (EC50 = 8.0 μM) and the assumption that mutants confer partial drug resistance. Treatment initiation is at time points generally consistent with hospitalization (day 10 after first positive sample), first symptoms (day 5 after first positive sample), presymptomatic post-peak phase (day 2 after first positive sample), or presymptomatic pre-peak phase (day 0). (A) Projections of no treatment, treatment with no assumed drug resistance, and treatment with assumed drug resistance. (B) Projections of assumed drug resistance with trajectories of sensitive strains, single mutants, and double mutants. Here, DOT represents the day of the start of the treatment.
If we assume that a single-point mutation in SARS-CoV-2 could theoretically induce complete drug resistance, then treatment failure may occur regardless of dosage timing. The resistant strain is predicted to predominate, raising the possibility of transmitted drug resistance (fig. S3).
Selinexor treatment predictions
Following SARS-CoV-2 infection and the nuclear import of viral genetic material at the cellular level, the nucleocytoplasmic export of viral proteins is essential for efficient viral replication mediated by exportin-1 (XPO1). Selinexor is a selective inhibitor of this key step of the late-stage assembly processes (39). Selinexor has been demonstrated to have dose-dependent activity against SARS-CoV-2 replication. Selinexor is currently being tested in human clinical trials for COVID-19 treatment (40).
Using a multicompartment PK/PD model for selinexor (Fig. 8A), we first recapitulated plasma parent drug levels over time following a single dose (41) (Fig. 8B), PBMC drug levels under different assumptions of drug absorption (Fig. 8C), and compensatory XPO1 mRNA expression following dosing (Fig. 8D). We then simulated plasma and PBMC drug levels (assuming low and high estimates for drug absorption) with three times weekly doses over 4 weeks (Fig. 8E) as proposed in the clinical trial (https://clinicaltrials.gov/ct2/show/NCT04349098?term=selinexor&draw=3&rank=14). After generating theoretical dose-response curves with different assumptions for in vivo EC50 (Fig. 8F), we projected compensatory XPO1 mRNA expression (Fig. 8G) and drug efficacy over time (Fig. 8H).
Fig. 8. Projected PK and PD of selinexor therapy.
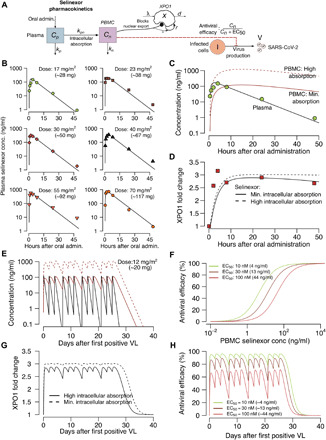
(A) Complete model of selinexor including plasma levels, PBMC levels, inhibition of XPO1-mediated cellular export of viral proteins, and inhibition of viral replication in a dose-dependent fashion. (B) Single-dose model drug levels (line) reproduce observed data points at different doses. (C) Projected PBMC levels assuming low and high selinexor absorption rates. (D) Predicted fold change in compensatory XPO1 mRNA expression after a single dose with model fits to data. (E) Projected plasma (black) and PBMC (red; dashed = high absorption and solid = low absorption) selinexor levels with three times weekly dosing for 4 weeks. (F) PD projections of antiviral efficacy according to drug concentration assuming different values for the in vivo EC50 of the drug. (G) Predicted fold change in compensatory XPO1 mRNA expression after multiple doses. (H) Projected antiviral effects using combined PK and PD models at different assumed drug potencies.
As with remdesivir, the predicted efficacy of therapy on viral shedding depended on the timing of treatment and the intracellular in vivo EC50 (fig. S4, A to D). Lower shedding duration occurred with earlier timing of therapy. Lower viral AUC again required extremely early initiation of potent treatment (fig. S4D). The model again predicted the possibility of prolonged shedding with subpotent early initiation of therapy (fig. S4D).
bNAb predictions
We next simulated a single infusion of hypothetical bNAbs with prolonged half-life. bNAbs are designed to stop infection of new cells rather than eliminate viral replication. We used a dual compartment PK model (Fig. 9A), estimated antibody levels over time following a single dose (Fig. 9B), generated theoretical dose-response curves (Fig. 9C), and then projected antibody efficacy over time (Fig. 9D). The predicted efficacy of therapy on shedding again was dependent on timing of treatment and the in vivo EC50 (fig. S5, A to D). Once again, to lower duration of shedding and the number of effector cells depended on therapeutic potency, while effective lowering of viral AUC required extremely early initiation of potent treatment (fig. S5, E to G).
Fig. 9. Projected PK and PD of neutralizing antibody therapy.
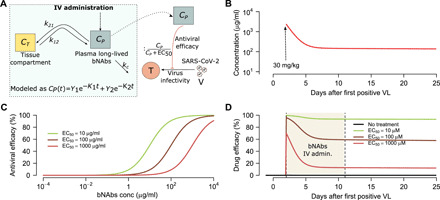
(A) Complete bicompartment model of bNAb therapy with lowering of viral infectivity according to antibody concentration. (B) Projections of plasma bNAb levels from simulations of VRC01 treatment. (C) PD projections of antiviral efficacy according to antibody concentration assuming different values for the in vivo EC50. (D) Combination simulations of PK and PD models demonstrating antiviral activity as a function of time.
Immunotherapy predictions
As natural killer cell–based treatments are being developed and studied for COVID-19 (https://clinicaltrials.gov/ct2/show/NCT04280224), we generalized the potential hypothetical effects of a cellular immunotherapy, which would presumably decrease the life span of infected cells. We projected that such an intervention would need to increase this rate 10-fold to match the efficacy of a potent small molecular agent (Fig. 10, A to C). Immunotherapies were projected to have limited efficacy if started before peak shedding (Fig. 10D).
Fig. 10. Treatment projections of cytolytic immunotherapy assuming different potency and timing of treatment.
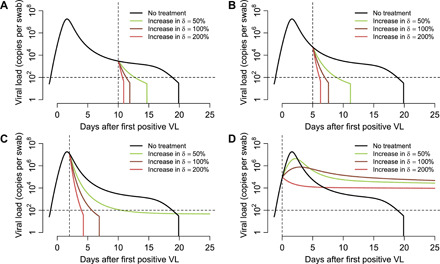
Each set of simulations is performed under assumptions of high, medium, and low potency based on multiplicative effect on infected cell death rate. Treatment initiation is at time points generally consistent with (A) hospitalization (day 10 after first positive sample), (B) first symptoms (day 5 after first positive sample), (C) presymptomatic post-peak phase (day 2 after first positive sample), and (D) presymptomatic pre-peak phase (day 0). Overall, early potent treatment limits duration of infection, but extremely early therapy fails. Prolonged shedding is predicted as a possibility with subpotent, early initiation of therapy due to inadequate activation of immunity.
DISCUSSION
SARS-CoV-2 infection is characterized by a stereotypical viral kinetic pattern with a high peak viral load during the first several days of infection, a subsequent short rapid decay period followed by a slower clearance phase of variable duration, and finally rapid elimination phase. Our mathematical model reproduces these data and explains that the transition from first to second phase viral decay is governed by a density-dependent term in which a massive die-off of infected cells occurs during peak viremia, as well as target cell elimination. Because an acquired immune response would continue to intensify rather than subside even after viral loads decrease, we attribute the density-dependent term to innate mechanisms. Our results suggest that this early response results in the quick elimination of millions of infected cells.
Viral clearance rate slows considerably once the viral load decreases below a threshold of ~105 RNA copies. A late slowly expanding acquired immune response is predicted to induce eradication of infected cells in the upper airway 2 to 20 days later. The timing of this final response appears to be variable among infected people in accordance with heterogeneous shedding duration during COVID-19 infection (42). Moreover, it is unknown whether cessation of viral replication in the nasopharynx guarantees the same result in the lung or other anatomic compartments (8). Viral dynamics under therapy differ markedly within the nasal passage and lung in a rhesus macaque model of remdesivir treatment for COVID-19 (35).
We are not able to differentiate whether neutralizing antibodies or cytolytic T cells are responsible for late clearance of infection, as both modeling approaches allow excellent model fitting to the data. On the basis of the fact that normal T cell function is a prerequisite for the rapid clearance of other viral infections, including SARS and MERS (24, 25), and because excess T cell responses may contribute to cytokine storm and acute respiratory distress syndrome (30), we elected to assume that T cells govern elimination of infected cells. However, our therapeutic model generates equivalent outcomes whether we assume cell-mediated or humoral viral elimination.
We simulated antiviral therapies on top of our natural history model to shed light on the possible impact of the timing and potency of antiviral therapies on outcomes. While accurate prediction is impossible in the absence of clinical trial data, our observations highlight the importance of considering off-treatment viral dynamics to understand treatment effects. Our results can guide future study design and assist in interpretation of forthcoming trial data in multiple ways.
First, it is critical to know whether in vitro potency assessments of remdesivir, selinexor, and bNAbs can be projected onto human infection. We previously demonstrated that in vivo EC50 values for antiviral agents can exceed estimates derived from cell culture experiments by a multiple of 5 to 10 (34). A similar observation has been hypothesized for HIV targeting monoclonal neutralizing antibodies (43). It is unclear whether this discrepancy occurs because of low blood levels in tissue, different cell metabolism of drug in tissue, or higher protein binding in vivo. Whatever the case, if in vitro potency measurements of selinexor and remdesivir overestimate in vivo activity, or if higher intracellular levels are required than in plasma, then these drugs may be less effective in clinical trials. Higher dosing may be a necessary solution to circumvent this issue.
Second, effective dosing after symptom development predicts rapid subsequent elimination of infected cells. Most current clinical trials are focused primarily on hospitalized patients, whereas our results and those from two other COVID-19 models suggest that treatment in the days immediately following symptom onset will decrease the duration of detectable viral shedding (44, 45). Our model also predicts that early treatment (before viral peak, usually <5 days post-infection) will limit the extent of the cytolytic immune response required to clear infection. If either of these outcomes are correlates of progression to severe disease, as appears to be the case clinically (46), and transmission risk, then as with HIV (47), influenza (48), and Ebola (49), early test and treat is a vital, currently overlooked strategy.
Third, effective dosing soon after onset of symptoms (usually post-peak and >5 days post-infection) is predicted to have a less substantial effect on viral load AUC. This phenomenon occurs because the amount of virus produced per hour at the early peak is far higher than the amount produced per day during the lower viral load second decay phase. This finding provides a cautionary message: If subsequent disease severity and development is imprinted during the high viral load, presymptomatic acute phase of infection, then early antiviral therapy could theoretically eliminate further shedding without altering clinical outcomes. Moreover, if extremely high viral load periods are responsible for most transmissions, as suggested by the median 5-day serial interval of infection (50), then early elimination of shedding may not significantly lower transmissibility either. Overall, this result highlights the urgent need for studies that identify early viral and immune correlates of severe disease and transmissibility. Preliminary studies suggest that presenting viral load may affect disease severity (51) but are not discriminated by viral AUC and are also potentially biased by variable timing of samples.
Fourth, if therapy is initiated during the presymptomatic stage of infection [usually <5 days post-infection and most likely to be captured during PEP trials (52)], then the outcomes of the clinical trial are predicated on the potency of antiviral therapy. Subtherapeutic treatments may even prolong infection by blocking adequate triggering of innate immunity and total depletion of susceptible cells, and thus, these therapies may be predisposed to drug resistance. Of note, our model’s predictions differ in this respect from those derived from other existing intra-host models of SARS-CoV-2 that do not emphasize the role of the immune response in eliminating infected cells (44, 45). On the basis of these different projections, we suggest sampling at late time points during PEP trials. While we emphasize that our model’s projections of higher late viral loads following subpotent extremely treatment are uncertain based on limited knowledge of thresholds required for induction of effective acquired immune response, it is nevertheless notable that this outcome has been observed in the nasal passages of remdesivir-treated rhesus macaques (35).
Fifth, our hypothetical approach suggests that while emergence of low-level drug-resistant strains may occur commonly during COVID-19 treatment with remdesivir, this is unlikely to predispose to treatment failure, provided that the drug is potent against the predominant susceptible strain. Resistant variants may be present at low levels relative to susceptible strains, making transmission of resistance less likely. Important exceptions may occur in immunocompromised hosts who might shed respiratory viruses for longer and at higher levels, thereby increasing the chance of de novo resistance (53), or in the context of only moderately potent antiviral therapy. Of note, these hypotheses are relevant and require experimental validation.
Last, our model projects a high likelihood of success for neutralizing antibodies and cellular immunotherapies provided that they achieve adequate potency and are dosed soon after development of symptoms.
Our model has important limitations. Most critically, it cannot be used to predict trial outcomes but rather establishes important principles to consider when designing and interpreting trials. We also do not frequently capture viral expansion during the first few days of SARS-CoV-2 infection: While parameter values for viral infectivity and replication rate may vary across infected people, the limited amount of early infection data prevents us from identifying the degree of variance in these parameters. Similarly, we lack adequate resistance data on all of our simulated therapies.
In summary, our model provides a broad platform for assessment of all major types of therapies. Our results demonstrate the need to differentiate whether duration of viral shedding or viral AUC is the more relevant surrogate of COVID-19 severity. If AUC is most predictive of poor outcomes, then all forms of antiviral therapy outside of potent PEP are unlikely to provide clinical benefit. However, if shedding duration is the best surrogate, then an early test and treat approach is highly promising for limiting the likelihood of severe disease.
MATERIALS AND METHODS
Study design
We used ordinary differential equation models to analyze the in-host SARS-CoV-2 dynamics in infected individuals and the potential in vivo effect of different treatment strategies. First, we fit models to the viral load data from different sources using a nonlinear-mixed effects approach. Second, we used PK models to fit observed plasma concentration of remdesivir and its active nucleoside triphosphate form in PBMCs and blood and PBMC concentrations of selinexor. Third, we simulated dose-response curves for antiviral effect of remdesivir and selinexor using different possible EC50 based on in vitro estimations against SARS-CoV-2. Fourth, we simulated therapy at different times during infection to analyze the potential reduction of SARS-CoV-2 shedding. Last, we repeated projections of therapy including the emergence of resistance to therapy.
SARS-CoV-2 viral load data
We analyzed viral load data from persons infected with SARS-CoV-2 who were monitored and received supported therapy in hospitals in Singapore (n = 11), Germany (n = 9), South Korea (n = 1), and France (n = 4). Persons who had less than four data points or had oscillatory viral dynamics were excluded. These data are all published before our analysis.
The first dataset was obtained from SARS-CoV-2–infected patients followed at four hospitals in Singapore from 23 January to 23 February 2020 (7). All patients had travelled from Wuhan, China in the 2 weeks before enrollment. Viral load observations were obtained from different specimens (blood, stool, and urine samples), but we analyzed those coming from nasopharyngeal swabs. Cycle threshold was obtained with reverse transcription polymerase chain reaction (RT-PCR) at multiple times during the first 2 weeks after enrollment.
The second dataset was obtained from infected patients enrolled and treated in a single hospital in Munich, Germany from 23 to 27 January 2020 (8). For all patients, the infection was reported to happen after contact with an index case. Viral load observations were obtained daily from sputum, pharyngeal swabs, and stool using RT-PCR. We analyzed viral RNA concentrations from sputum.
The third dataset was from the first SARS-CoV-2–infected case in South Korea, a 35-year-old Chinese citizen coming from Wuhan, China (9). Nasopharyngeal swab viral loads were obtained daily from day 2 of symptom onset using RT-PCR.
The fourth dataset came from four patients admitted to hospitals in Paris or Bordeaux, France with viral loads obtained from nasopharyngeal swabs using RT-PCR (10). We analyzed viral load data digitized from the published study.
When viral load observations were only published in cycle threshold (Ct) values, we converted them to copies per swab using the relation values in (54). We assumed a lower limit of detection of 100 copies per sample.
PK data
PK data of remdesivir were gathered from (32), where NHPs intravenously received remdesivir at a dose of 10 mg/kg at day 0, and the plasma concentration of remdesivir and its active nucleoside triphosphate form in PBMCs were recorded over 24 hours. We digitize these data and used them to fit our PK model of remdesivir. PK selinexor data were gathered from (41) for model fitting.
Mathematical modeling of SARS-COV-2 dynamics
To understand the observed SARS-CoV-2 shedding dynamics, we developed a viral infection model modifying previous models of virus dynamics (11, 12, 55). In this model, susceptible cells (S) are infected at rate βVS by SARS-CoV-2 (V). SARS-CoV-2–infected cells (I) are cleared in two ways: (i) by an innate response with density-dependent rate δIk (14, 15) and (ii) an acquired response with rate mediated by SARS-CoV-2–specific effector cells (E). The exponent k describes by how much the first death rate depends on the infected cell density. The Hill coefficient r parameterizes the nonlinearity of the second response and allows rapid saturation of the killing. Parameter ϕ defines the effector cell level by which killing of infected cells by E is half-maximal. SARS-CoV-2 is produced at a rate π and cleared with rate γ. In the model, SARS-CoV-2–specific effector cells rise after n stages from precursors cells (Mi = 1…n). The first precursor cell compartment (M1) proliferates in the presence of infection with rate ωIM1 and differentiates into the effector cell at a per capita rate q during each intermediate stage. Last, effector cells die at rate δE. The best instance of the model is expressed as a schematic (Fig. 1A) and, here, as a system of ordinary differential equations
The neutralizing antibody model in fig. S1 is equivalent, but in this case, equation E represents an antibody response and equations for S and I are as follows. The acquired immune response affects the infectivity term rather than infected cell life span
Fitting viral load data and model selection
We fit different instances of our model in Eq. 1 to the SARS-COV-2 shedding data using a nonlinear mixed-effects modeling approach (see table S1) (56). Briefly, we obtained a maximum likelihood estimation of the population median (fixed effects) and SD (random effects) for each model parameter using the stochastic approximation expectation maximization (SAEM) algorithm embedded in the Monolix 2019R2 software (www.lixoft.eu). For a subset of parameters, random effects were specified, and the SD values were estimated. Measurement error variance was also estimated assuming an additive error model for the logged V. We simultaneously fit each model to the viral load data of 25 patients from the four datasets. The parameters associated with the effector cell compartment were only estimated for those study participants who cleared infection during the observed data.
For each model fit, we assumed t = 0 as the time of first positive viral load for each person. However, we defined the initial value as the time of infection, i.e., when I(tinit) = 1 cell. Because infection starts before the first detected viral load, we have that tinit < 0. We fixed other initial values as S(tinit) = 107 cells, , M1(tinit) = 1 cell, and Mi = 2…n(tinit) = E(tinit) = 0. We fixed parameter γ = 15 day−1 (55), δE = 1 day−1, and ϕ = 100 cells. We assumed this value of ϕ because of the low percentage (~2%) of activated T cells that start growing at the moment of viral load drop (57). We estimated the remaining parameters including the time of infection tinit.To determine the most parsimonious model among the instances for the available SARS-CoV-2 shedding data, we computed the log-likelihood (log L) and the Akaike information criteria (AIC = −2log L + 2m, where m is the number of parameters estimated). We assumed that a model has similar support from the data if the difference between its AIC and the best model (lowest) AIC is less than two (58).
PK modeling of remdesivir
To reproduce the PK data of remdesivir, we used a simple two-compartment model, where the first compartment represents the amount of remdesivir in plasma (CP, volume VP) and the second compartment denotes the amount of its active nucleoside triphosphate form in PBMCs (Ca, volume Va). Here, we assume that remdesivir gets metabolized to its active nucleoside triphosphate form at rate kpa, whereas remdesivir and its active nucleoside triphosphate form are eliminated from their respective compartments at rates kc and ka, respectively. The model is given by
As the drug concentration was recorded in μM, we convert the amount of the drug given in mg to μM by dividing CP and Ca by conversion factors V1 and V2, respectively. Here, V1 and V2 are a combination of the volume of the distribution of two compartments (VP and Va) and the molar mass of two forms of remdesivir (MP and Ma). The relationship follows, and .We fit this model to the PK data from NHP (32), using a nonlinear least squares approach using an initial dose of 10 mg/kg. We adapted the dose in humans (200 and 100 mg) assuming a normal weight of 70 kg.
PK modeling of selinexor
We used a two-compartment model of therapy for selinexor in which oral dose (Cd) is absorbed and converted to plasma levels (Cp) at rate ka. The drug in the plasma is then transported to the target site of infection and are then absorbed into cells (Cn, volume of distribution Vn) at rate kpn. Drug activity is mediated by Cn, which inhibits the XPO1-mediated nuclear export of viral material to the cytoplasm, thus inhibiting viral replication. The concentration of XPO1 mRNA is captured by variable x, which is produced at rate λ and cleared at rate d. XPO1 and the intracellular drug interact at rate r, and this rate is limited by the high intracellular drug concentration; this results in overexpression of XPO1 mRNA expression (41). This is depicted in Fig. 8 and shown in the form of ordinary differential equations below
PK modeling of bNAbs
The PK of an intravenously injected bNAb was simulated using a simple biphasic exponential model, CB(t) = Y1e−k1t + Y2e−k2t. In this model, k1 and k2 represent the distribution and clearance rates of the bNAb, whereas Y1 and Y2 describe the coefficients associated with them. We fixed parameters Y1 = 2200 μg/ml, Y2 = 150 μg/ml, and k1 = 1.1 day−1 following estimates for the bNAb VRC01 (43). We also fixed day−1 to reflect the long half-life of 3 months.
PD modeling
We modeled antiviral efficacy (ϵ) of each treatment approach as a function of the drug concentration C(t) as , where EC50 is the half-maximal effective concentration. Remdesivir and selinexor were assumed to inhibit viral production rate (π), whereas bNAbs were hypothesized to inhibit the viral infectivity (β), both by a factor of 1 − ϵ(t).
To calculate the efficacy of remdesivir, we assumed that the active form (Ca) has the antiviral effect, i.e., . The antiviral effect of intracellular selinexor was calculated in an equivalent fashion (Fig. 8A). We used values of EC50 from those estimates in vitro against SARS-CoV-2 [10 nM for selinexor (59) and 0.77 μM for remdesivir (31)] to hypothetical in vivo values up to 100 times the in vitro value.
We also explored the antiviral effect of a hypothetical bNAb using the form and varied values of EC50 between 1 and 1000 μM. Last, we modeled the potential antiviral effect of immunotherapies by enhancing the early death rate of infected cells (δ) by factors of 50, 100, and 200%.
Modeling the emergence of resistance to remdesivir
We adapted the model in Eq. 1 to allow the emergence of resistance to remdesivir. We base the modifications on the fact that two separate mutations may induce partial resistance to remdesivir in SARS-CoV-1, which, in turn, leads to a less fit virus (38). In the case of SARS-CoV-1, two single mutations can induce to a less sensitive virus with 2.4- and 5.0-fold increase in the remdesivir EC50. When the combined mutations emerged, it mediated a 5.6-fold increase in the remdesivir EC50. We included these findings in the model by assuming that infected cells (Is) that produce sensitive virus (Vs) can transition into infected cells (Ir1 and Ir2) that produce less sensitive virus (Vr1 and Vr2), due to one mutation during the viral replication cycle. These two viral populations have an increased EC50 (2.4- and 5-fold higher). Similarly, we assumed that Ir1 and Ir2 can transition into infected cells that produce the more resistant strain Vr12 (with 5.6-fold higher EC50) after another mutation. We also allowed reversal mutation events. We assumed a mutation probability of μ = 10−5 per infection event. Under these assumptions, total viral load is defined as V = Vs + Vr1 + Vr2 + Vr12 and total number of infected cells as I = Is + Ir1 + Ir2 + Ir12. With these modifications, the model becomes
| (2) |
Here, , , , and are the antiviral effects of remdesivir in blocking virus production for each viral population.
Supplementary Material
Acknowledgments
We are grateful to study participants from around the globe who donated critical virologic data early during the pandemic. Funding: This study was supported by Fred Hutchinson Cancer Research Center faculty discretionary funds and by National Institute of Allergy and Infectious Diseases (grant 5R01AI121129-05). Author contributions: J.T.S. conceived the study. A.G. and E.F.C.-O. assembled data, wrote all code, performed all calculations and derivations, ran the models, and analyzed output data. J.T.S. wrote the manuscript with contributions from all other authors. Competing interests: J.T.S. is on the trial planning committee for a Gilead-funded trial of remdesivir but is not reimbursed for this activity. The authors declare that they have no other competing interests. Data and materials availability: All data needed to evaluate the conclusions in the paper are present in the paper and/or the Supplementary Materials. The original data and code are shared at https://github.com/ashish2goyal/SARS-COV-2_Within_host_Viral_dynamics. Additional data related to this paper may be requested from the authors.
SUPPLEMENTARY MATERIALS
Supplementary material for this article is available at http://advances.sciencemag.org/cgi/content/full/sciadv.abc7112/DC1
REFERENCES AND NOTES
- 1.Park S. E., Epidemiology, virology, and clinical features of severe acute respiratory syndrome -coronavirus-2 (SARS-CoV-2; Coronavirus Disease-19). Clin. Exp. Pediatr. 63, 119–124 (2020). [DOI] [PMC free article] [PubMed] [Google Scholar]
- 2.Wang D., Hu B., Hu C., Zhu F., Liu X., Zhang J., Wang B., Xiang H., Cheng Z., Xiong Y., Zhao Y., Li Y., Wang X., Peng Z., Clinical characteristics of 138 hospitalized patients with 2019 novel coronavirus-infected pneumonia in Wuhan, China. JAMA 323, 1061–1069 (2020). [DOI] [PMC free article] [PubMed] [Google Scholar]
- 3.Yang X., Yu Y., Xu J., Shu H., Xia J., Liu H., Wu Y., Zhang L., Yu Z., Fang M., Yu T., Wang Y., Pan S., Zou X., Yuan S., Shang Y., Clinical course and outcomes of critically ill patients with SARS-CoV-2 pneumonia in Wuhan, China: A single-centered, retrospective, observational study. Lancet Respir. Med. 8, 475–481 (2020). [DOI] [PMC free article] [PubMed] [Google Scholar]
- 4.Onder G., Rezza G., Brusaferro S., Case-fatality rate and characteristics of patients dying in relation to COVID-19 in Italy. JAMA 323, 1775–1776 (2020). [DOI] [PubMed] [Google Scholar]
- 5.Korean Society of Infectious Diseases and Korea Centers for Disease Control and Prevention , Analysis on 54 mortality cases of coronavirus disease 2019 in the Republic of Korea from January 19 to March 10, 2020. J. Korean Med. Sci. 35, e132 (2020). [DOI] [PMC free article] [PubMed] [Google Scholar]
- 6.P. G. T. Walker, C. Whittaker, O. Watson, M. Baguelin, K. E. C. Ainslie, S. Bhatia, S. Bhatt, A. Boonyasiri, O. Boyd, L. Cattarino, Z. Cucunubá, G. Cuomo-Dannenburg, A. Dighe, C. A. Donnelly, I. Dorigatti, S. van Elsland, R. FitzJohn, S. Flaxman, H. Fu, K. Gaythorpe, L. Geidelberg, N. Grassly, W. Green, A. Hamlet, K. Hauck, D. Haw, S. Hayes, W. Hinsley, N. Imai, D. Jorgensen, E. Knock, D. Laydon, S. Mishra, G. Nedjati-Gilani, L. C. Okell, S. Riley, H. Thompson, J. Unwin, R. Verity, M. Vollmer, C. Walters, H. W. Wang, Y. Wang, P. Winskill, X. Xi, N. M. Ferguson, A. C. Ghani, The Global Impact of COVID-19 and Strategies for Mitigation and Suppression. WHO Collaborating Centre for Infectious Disease Modelling, MRC Centre for Global Infectious Disease Analysis (Abdul Latif Jameel Institute for Disease and Emergency Analytics, Imperial College London, 2020), pp. 1–19.
- 7.Young B. E., Ong S. W. X., Kalimuddin S., Low J. G., Tan S. Y., Loh J., Ng O.-T., Marimuthu K., Ang L. W., Mak T. M., Lau S. K., Anderson D. E., Chan K. S., Tan T. Y., Ng T. Y., Cui L., Said Z., Kurupatham L., Chen M. I.-C., Chan M., Vasoo S., Wang L.-F., Tan B. H., Lin R. T. P., Lee V. J. M., Leo Y.-S., Lye D. C.; for the Singapore 2019 Novel Coronavirus Outbreak Research Team , Epidemiologic features and clinical course of patients infected with SARS-CoV-2 in Singapore. JAMA 323, 1488–1494 (2020). [DOI] [PMC free article] [PubMed] [Google Scholar]
- 8.Wölfel R., Corman V. M., Guggemos W., Seilmaier M., Zange S., Müller M. A., Niemeyer D., Jones T. C., Vollmar P., Rothe C., Hoelscher M., Bleicker T., Brünink S., Schneider J., Ehmann R., Zwirglmaier K., Drosten C., Wendtner C., Virological assessment of hospitalized patients with COVID-2019. Nature 581, 465–469 (2020). [DOI] [PubMed] [Google Scholar]
- 9.Kim J. Y., Ko J.-H., Kim Y., Kim Y.-J., Kim J.-M., Chung Y.-S., Kim H. M., Han M.-G., Kim S. Y., Chin B. S., Viral load kinetics of SARS-CoV-2 infection in first two patients in Korea. J. Korean Med. Sci. 35, e86 (2020). [DOI] [PMC free article] [PubMed] [Google Scholar]
- 10.Lescure F.-X., Bouadma L., Nguyen D., Parisey M., Wicky P.-H., Behillil S., Gaymard A., Bouscambert-Duchamp M., Donati F., Le Hingrat Q., Enouf V., Houhou-Fidouh N., Valette M., Mailles A., Lucet J.-C., Mentre F., Duval X., Descamps D., Malvy D., Timsit J.-F., Lina B., van-der-Werf S., Yazdanpanah Y., Clinical and virological data of the first cases of COVID-19 in Europe: A case series. Lancet Infect. Dis. 20, 697–706 (2020). [DOI] [PMC free article] [PubMed] [Google Scholar]
- 11.Ho D. D., Neumann A. U., Perelson A. S., Chen W., Leonard J. M., Markowitz M., Rapid turnover of plasma virions and CD4 lymphocytes in HIV-1 infection. Nature 373, 123–126 (1995). [DOI] [PubMed] [Google Scholar]
- 12.Perelson A. S., Neumann A. U., Markowitz M., Leonard J. M., Ho D. D., HIV-1 dynamics in vivo: Virion clearance rate, infected cell life-span, and viral generation time. Science 271, 1582–1586 (1996). [DOI] [PubMed] [Google Scholar]
- 13.Tay M. Z., Poh C. M., Rénia L., MacAry P. A., Ng L. F. P., The trinity of COVID-19: Immunity, inflammation and intervention. Nat. Rev. Immunol. 20, 363–374 (2020). [DOI] [PMC free article] [PubMed] [Google Scholar]
- 14.Holte S. E., Melvin A. J., Mullins J. I., Tobin N. H., Frenkel L. M., Density-dependent decay in HIV-1 dynamics. J. Acquir. Immune Defic. Syndr. 41, 266–276 (2006). [DOI] [PubMed] [Google Scholar]
- 15.Smith A. P., Moquin D. J., Bernhauerova V., Smith A. M., Influenza virus infection model with density dependence supports biphasic viral decay. Front. Microbiol. 9, 1554 (2018). [DOI] [PMC free article] [PubMed] [Google Scholar]
- 16.Cao B., Wang Y., Wen D., Liu W., Wang J., Fan G., Ruan L., Song B., Cai Y., Wei M., Li X., Xia J., Chen N., Xiang J., Yu T., Bai T., Xie X., Zhang L., Li C., Yuan Y., Chen H., Li H., Huang H., Tu S., Gong F., Liu Y., Wei Y., Dong C., Zhou F., Gu X., Xu J., Liu Z., Zhang Y., Li H., Shang L., Wang K., Li K., Zhou X., Dong X., Qu Z., Lu S., Hu X., Ruan S., Luo S., Wu J., Peng L., Cheng F., Pan L., Zou J., Jia C., Wang J., Liu X., Wang S., Wu X., Ge Q., He J., Zhan H., Qiu F., Guo L., Huang C., Jaki T., Hayden F. G., Horby P. W., Zhang D., Wang C., A trial of lopinavir–ritonavir in adults hospitalized with severe covid-19. N. Engl. J. Med. 382, 1787–1799 (2020). [DOI] [PMC free article] [PubMed] [Google Scholar]
- 17.Wajnberg A., Mansour M., Leven E., Bouvier N. M., Patel G., Firpo A., Mendu R., Jhang J., Arinsburg S., Gitman M., Houldsworth J., Baine I., Simon V., Aberg J., Krammer F., Reich D., Cordon-Cardo C., Humoral immune response and prolonged PCR positivity in a cohort of 1343 SARS-CoV 2 patients in the New York City region. medRxiv 2020.2004.2030.20085613 , (2020). [DOI] [PMC free article] [PubMed] [Google Scholar]
- 18.Suthar M. S., Zimmerman M. G., Kauffman R. C., Mantus G., Linderman S. L., Hudson W. H., Vanderheiden A., Nyhoff L., Davis C. W., Adekunle O., Affer M., Sherman M., Reynolds S., Verkerke H. P., Alter D. N., Guarner J., Bryksin J., Horwath M. C., Arthur C. M., Saakadze N., Smith G. H., Edupuganti S., Scherer E. M., Hellmeister K., Cheng A., Morales J. A., Neish A. S., Stowell S. R., Frank F., Ortlund E., Anderson E. J., Menachery V. D., Rouphael N., Metha A. K., Stephens D. S., Ahmed R., Roback J. D., Wrammert J., Rapid generation of neutralizing antibody responses in COVID-19 patients. Cell Rep. Med. 1, 100040 (2020). [DOI] [PMC free article] [PubMed] [Google Scholar]
- 19.Weiskopf D., Schmitz K. S., Raadsen M. P., Grifoni A., Okba N. M. A., Endeman H., van den Akker J. P. C., Molenkamp R., Koopmans M. P. G., van Gorp E. C. M., Haagmans B. L., de Swart R. L., Sette A., de Vries R. D., Phenotype and kinetics of SARS-CoV-2-specific T cells in COVID-19 patients with acute respiratory distress syndrome. Sci. Immunol. 5, eabd2071 (2020). [DOI] [PMC free article] [PubMed] [Google Scholar]
- 20.Braun J., Loyal L., Frentsch M., Wendisch D., Georg P., Kurth F., Hippenstiel S., Dingeldey M., Kruse B., Fauchere F., Baysal E., Mangold M., Henze L., Lauster R., Mall M. A., Beyer K., Röhmel J., Voigt S., Schmitz J., Miltenyi S., Demuth I., Müller M. A., Hocke A., Witzenrath M., Suttorp N., Kern F., Reimer U., Wenschuh H., Drosten C., Corman V. M., Giesecke-Thiel C., Sander L. E., Thiel A., SARS-CoV-2-reactive T cells in healthy donors and patients with COVID-19. Nature , (2020). [DOI] [PubMed] [Google Scholar]
- 21.Grifoni A., Weiskopf D., Ramirez S. I., Mateus J., Dan J. M., Moderbacher C. R., Rawlings S. A., Sutherland A., Premkumar L., Jadi R. S., Marrama D., de Silva A. M., Frazier A., Carlin A. F., Greenbaum J. A., Peters B., Krammer F., Smith D. M., Crotty S., Sette A., Targets of T cell responses to SARS-CoV-2 coronavirus in humans with COVID-19 disease and unexposed individuals. Cell 181, 1489–1501.e15 (2020). [DOI] [PMC free article] [PubMed] [Google Scholar]
- 22.Lucas C., Wong P., Klein J., Castro T. B. R., Silva J., Sundaram M., Ellingson M. K., Mao T., Oh J. E., Israelow B., Takahashi T., Tokuyama M., Lu P., Venkataraman A., Park A., Mohanty S., Wang H., Wyllie A. L., Vogels C. B. F., Earnest R., Lapidus S., Ott I. M., Moore A. J., Muenker M. C., Fournier J. B., Campbell M., Odio C. D., Casanovas-Massana A.; Yale IMPACT Team, Herbst R., Shaw A. C., Medzhitov R., Schulz W. L., Grubaugh N. D., Cruz C. D., Farhadian S., Ko A. I., Omer S. B., Iwasaki A., Longitudinal analyses reveal immunological misfiring in severe COVID-19. Nature 584, 463–469 (2020). [DOI] [PMC free article] [PubMed] [Google Scholar]
- 23.Zhao J., Zhao J., Perlman S., T cell responses are required for protection from clinical disease and for virus clearance in severe acute respiratory syndrome coronavirus-infected mice. J. Virol. 84, 9318–9325 (2010). [DOI] [PMC free article] [PubMed] [Google Scholar]
- 24.Zhao J., Zhao J., Mangalam A. K., Channappanavar R., Fett C., Meyerholz D. K., Agnihothram S., Baric R. S., David C. S., Perlman S., Airway memory CD4+ T cells mediate protective immunity against emerging respiratory coronaviruses. Immunity 44, 1379–1391 (2016). [DOI] [PMC free article] [PubMed] [Google Scholar]
- 25.Channappanavar R., Fehr A. R., Zheng J., Wohlford-Lenane C., Abrahante J. E., Mack M., Sompallae R., Mc Cray P. B. Jr., Meyerholz D. K., Perlman S., IFN-I response timing relative to virus replication determines MERS coronavirus infection outcomes. J. Clin. Invest. 129, 3625–3639 (2019). [DOI] [PMC free article] [PubMed] [Google Scholar]
- 26.Fernández-Ruiz M., Andrés A., Loinaz C., Delgado J. F., López-Medrano F., San Juan R., González E., Polanco N., Folgueira M. D., Lalueza A., Lumbreras C., Aguado J. M., COVID-19 in solid organ transplant recipients: A single-center case series from Spain. Am. J. Transplant. 20, 1849–1858 (2020). [DOI] [PMC free article] [PubMed] [Google Scholar]
- 27.Liao M., Liu Y., Yuan J., Wen Y., Xu G., Zhao J., Cheng L., Li J., Wang X., Wang F., Liu L., Amit I., Zhang S., Zhang Z., Single-cell landscape of bronchoalveolar immune cells in patients with COVID-19. Nat. Med. 26, 842–844 (2020). [DOI] [PubMed] [Google Scholar]
- 28.Chemaly R. F., Shah D. P., Boeckh M. J., Management of respiratory viral infections in hematopoietic cell transplant recipients and patients with hematologic malignancies. Clin. Infect. Dis. 59 (suppl. 5), S344–S351 (2014). [DOI] [PMC free article] [PubMed] [Google Scholar]
- 29.Huang K.-J., Su I.-J., Theron M., Wu Y.-C., Lai S.-K., Liu C.-C., Lei H.-Y., An interferon-γ-related cytokine storm in SARS patients. J. Med. Virol. 75, 185–194 (2005). [DOI] [PMC free article] [PubMed] [Google Scholar]
- 30.Zhou Y., Fu B., Zheng X., Wang D., Zhao C., Qi Y., Sun R., Tian Z., Xu X., Wei H., Pathogenic T cells and inflammatory monocytes incite inflammatory storm in severe COVID-19 patients. Natl. Sci. Rev. 7, 998–1002 (2020). [DOI] [PMC free article] [PubMed] [Google Scholar]
- 31.Wang M., Cao R., Zhang L., Yang X., Liu J., Xu M., Shi Z., Hu Z., Zhong W., Xiao G., Remdesivir and chloroquine effectively inhibit the recently emerged novel coronavirus (2019-nCoV) in vitro. Cell Res. 30, 269–271 (2020). [DOI] [PMC free article] [PubMed] [Google Scholar]
- 32.Warren T. K., Jordan R., Lo M. K., Ray A. S., Mackman R. L., Soloveva V., Siegel D., Perron M., Bannister R., Hui H. C., Larson N., Strickley R., Wells J., Stuthman K. S., Van Tongeren S. A., Garza N. L., Donnelly G., Shurtleff A. C., Retterer C. J., Gharaibeh D., Zamani R., Kenny T., Eaton B. P., Grimes E., Welch L. S., Gomba L., Wilhelmsen C. L., Nichols D. K., Nuss J. E., Nagle E. R., Kugelman J. R., Palacios G., Doerffler E., Neville S., Carra E., Clarke M. O., Zhang L., Lew W., Ross B., Wang Q., Chun K., Wolfe L., Babusis D., Park Y., Stray K. M., Trancheva I., Feng J. Y., Barauskas O., Xu Y., Wong P., Braun M. R., Flint M., McMullan L. K., Chen S.-S., Fearns R., Swaminathan S., Mayers D. L., Spiropoulou C. F., Lee W. A., Nichol S. T., Cihlar T., Bavari S., Therapeutic efficacy of the small molecule GS-5734 against Ebola virus in rhesus monkeys. Nature 531, 381–385 (2016). [DOI] [PMC free article] [PubMed] [Google Scholar]
- 33.Schiffer J. T., Swan D. A., Corey L., Wald A., Rapid viral expansion and short drug half-life explain the incomplete effectiveness of current herpes simplex virus 2-directed antiviral agents. Antimicrob. Agents Chemother. 57, 5820–5829 (2013). [DOI] [PMC free article] [PubMed] [Google Scholar]
- 34.Schiffer J. T., Swan D. A., Magaret A., Corey L., Wald A., Ossig J., Ruebsamen-Schaeff H., Stoelben S., Timmler B., Zimmermann H., Melhem M. R., Van Wart S. A., Rubino C. M., Birkmann A., Mathematical modeling of herpes simplex virus-2 suppression with pritelivir predicts trial outcomes. Sci. Transl. Med. 8, 324ra315 (2016). [DOI] [PMC free article] [PubMed] [Google Scholar]
- 35.Williamson B. N., Feldmann F., Schwarz B., Meade-White K., Porter D. P., Schulz J., van Doremalen N., Leighton I., Yinda C. K., Pérez-Pérez L., Okumura A., Lovaglio J., Hanley P. W., Saturday G., Bosio C. M., Anzick S., Barbian K., Cihlar T., Martens C., Scott D. P., Munster V. J., de Wit E., Clinical benefit of remdesivir in rhesus macaques infected with SARS-CoV-2. Nature 585, 273–276 (2020). [DOI] [PMC free article] [PubMed] [Google Scholar]
- 36.Chen J., Lau Y. F., Lamirande E. W., Paddock C. D., Bartlett J. H., Zaki S. R., Subbarao K., Cellular immune responses to severe acute respiratory syndrome coronavirus (SARS-CoV) infection in senescent BALB/c mice: CD4+ T cells are important in control of SARS-CoV infection. J. Virol. 84, 1289–1301 (2010). [DOI] [PMC free article] [PubMed] [Google Scholar]
- 37.Sanjuán R., Nebot M. R., Chirico N., Mansky L. M., Belshaw R., Viral mutation rates. J. Virol. 84, 9733–9748 (2010). [DOI] [PMC free article] [PubMed] [Google Scholar]
- 38.Agostini M. L., Andres E. L., Sims A. C., Graham R. L., Sheahan T. P., Lu X., Smith E. C., Case J. B., Feng J. Y., Jordan R., Ray A. S., Cihlar T., Siegel D., Mackman R. L., Clarke M. O., Baric R. S., Denison M. R., Coronavirus susceptibility to the antiviral remdesivir (GS-5734) Is mediated by the viral polymerase and the proofreading exoribonuclease. mBio 9, e00221-18 (2018). [DOI] [PMC free article] [PubMed] [Google Scholar]
- 39.Peterson T. J., Orozco J., Buege M., Selinexor: A first-in-class nuclear export inhibitor for management of multiply relapsed multiple myeloma. Ann. Pharmacother. 54, 577–582 (2020). [DOI] [PMC free article] [PubMed] [Google Scholar]
- 40.Uddin M. H., Zonder J. A., Azmi A. S., Exportin 1 inhibition as antiviral therapy. Drug Discov. Today , (2020). [DOI] [PMC free article] [PubMed] [Google Scholar]
- 41.Garzon R., Savona M., Baz R., Andreeff M., Gabrail N., Gutierrez M., Savoie L., Mau-Sorensen P. M., Wagner-Johnston N., Yee K., Unger T. J., Saint-Martin J.-R., Carlson R., Rashal T., Kashyap T., Klebanov B., Shacham S., Kauffman M., Stone R., A phase 1 clinical trial of single-agent selinexor in acute myeloid leukemia. Blood 129, 3165–3174 (2017). [DOI] [PMC free article] [PubMed] [Google Scholar]
- 42.Zheng S., Fan J., Yu F., Feng B., Lou B., Zou Q., Xie G., Lin S., Wang R., Yang X., Chen W., Wang Q., Zhang D., Liu Y., Gong R., Ma Z., Lu S., Xiao Y., Gu Y., Zhang J., Yao H., Xu K., Lu X., Wei G., Zhou J., Fang Q., Cai H., Qiu Y., Sheng J., Chen Y., Liang T., Viral load dynamics and disease severity in patients infected with SARS-CoV-2 in Zhejiang province, China, January-March 2020: Retrospective cohort study. BMJ 369, m1443 (2020). [DOI] [PMC free article] [PubMed] [Google Scholar]
- 43.Reeves D. B., Huang Y., Duke E. R., Mayer B. T., Cardozo-Ojeda E. F., Boshier F. A., Swan D. A., Rolland M., Robb M. L., Mascola J. R., Cohen M. S., Corey L., Gilbert P. B., Schiffer J. T., Mathematical modeling to reveal breakthrough mechanisms in the HIV Antibody Mediated Prevention (AMP) trials. PLOS Comput. Biol. 16, e1007626 (2020). [DOI] [PMC free article] [PubMed] [Google Scholar]
- 44.Gonçalves A., Bertrand J., Ke R., Comets E., de Lamballerie X., Malvy D., Pizzorno A., Terrier O., Calatrava M. R., Mentré F., Smith P., Perelson A. S., Guedj J., Timing of antiviral treatment initiation is critical to reduce SARS-CoV-2 viral load. CPT Pharmacomet. Syst. Pharmacol. 9, 509–514 (2020). [DOI] [PMC free article] [PubMed] [Google Scholar]
- 45.Kim K. S., Ejima K., Ito Y., Iwanami S., Ohashi H., Koizumi Y., Asai Y., Nakaoka S., Watashi K., Thompson R. N., Iwami S., Modelling SARS-CoV-2 dynamics: Implications for therapy. medRxiv , 2020.03.23.20040493 (2020). [Google Scholar]
- 46.Zhou F., Yu T., Du R., Fan G., Liu Y., Liu Z., Xiang J., Wang Y., Song B., Gu X., Guan L., Wei Y., Li H., Wu X., Xu J., Tu S., Zhang Y., Chen H., Cao B., Clinical course and risk factors for mortality of adult inpatients with COVID-19 in Wuhan, China: A retrospective cohort study. Lancet 395, 1054–1062 (2020). [DOI] [PMC free article] [PubMed] [Google Scholar]
- 47.INSIGHT START Study Group , Initiation of antiretroviral therapy in early asymptomatic HIV infection. N. Engl. J. Med. 373, 795–807 (2015). [DOI] [PMC free article] [PubMed] [Google Scholar]
- 48.Hayden F. G., Sugaya N., Hirotsu N., Lee N., de Jong M. D., Hurt A. C., Ishida T., Sekino H., Yamada K., Portsmouth S., Kawaguchi K., Shishido T., Arai M., Tsuchiya K., Uehara T., Watanabe A.; Baloxavir Marboxil Investigators Group , Baloxavir marboxil for uncomplicated influenza in adults and adolescents. N. Engl. J. Med. 379, 913–923 (2018). [DOI] [PubMed] [Google Scholar]
- 49.Mulangu S., Dodd L. E., Davey R. T. Jr., Tshiani Mbaya O., Proschan M., Mukadi D., Lusakibanza Manzo M., Nzolo D., Tshomba Oloma A., Ibanda A., Ali R., Coulibaly S., Levine A. C., Grais R., Diaz J., Lane H. C., Muyembe-Tamfum J.-J.; PALM Writing Group, Sivahera B., Camara M., Kojan R., Walker R., Dighero-Kemp B., Cao H., Mukumbayi P., Mbala-Kingebeni P., Ahuka S., Albert S., Bonnett T., Crozier I., Duvenhage M., Proffitt C., Teitelbaum M., Moench T., Aboulhab J., Barrett K., Cahill K., Cone K., Eckes R., Hensley L., Herpin B., Higgs E., Ledgerwood J., Pierson J., Smolskis M., Sow Y., Tierney J., Sivapalasingam S., Holman W., Gettinger N., Vallée D., Nordwall J.; PALM Consortium Study Team , A randomized, controlled trial of ebola virus disease therapeutics. N. Engl. J. Med. 381, 2293–2303 (2019). [DOI] [PMC free article] [PubMed] [Google Scholar]
- 50.Du Z., Xu X., Wu Y., Wang L., Cowling B. J., Meyers L. A., Serial interval of COVID-19 among publicly reported confirmed cases. Emerg. Infect. Dis. 26, 1341–1343 (2020). [DOI] [PMC free article] [PubMed] [Google Scholar]
- 51.Liu Y., Yan L.-M., Wan L., Xiang T.-X., Le A., Liu J.-M., Peiris M., Poon L. L. M., Zhang W., Viral dynamics in mild and severe cases of COVID-19. Lancet Infect. Dis. 20, 656–657 (2020). [DOI] [PMC free article] [PubMed] [Google Scholar]
- 52.Mitjà O., Clotet B., Use of antiviral drugs to reduce COVID-19 transmission. Lancet Glob. Health 8, e639–e640 (2020). [DOI] [PMC free article] [PubMed] [Google Scholar]
- 53.Xue K. S., Stevens-Ayers T., Campbell A. P., Englund J. A., Pergam S. A., Boeckh M., Bloom J. D., Parallel evolution of influenza across multiple spatiotemporal scales. eLife 6, e26875 (2017). [DOI] [PMC free article] [PubMed] [Google Scholar]
- 54.Zou L., Ruan F., Huang M., Liang L., Huang H., Hong Z., Yu J., Kang M., Song Y., Xia J., Guo Q., Song T., He J., Yen H.-L., Peiris M., Wu J., SARS-CoV-2 viral load in upper respiratory specimens of infected patients. N. Engl. J. Med. 382, 1177–1179 (2020). [DOI] [PMC free article] [PubMed] [Google Scholar]
- 55.Pawelek K. A., Huynh G. T., Quinlivan M., Cullinane A., Rong L., Perelson A. S., Modeling within-host dynamics of influenza virus infection including immune responses. PLOS Comput. Biol. 8, e1002588 (2012). [DOI] [PMC free article] [PubMed] [Google Scholar]
- 56.Chan P. L. S., Jacqmin P., Lavielle M., McFadyen L., Weatherley B., The use of the SAEM algorithm in MONOLIX software for estimation of population pharmacokinetic-pharmacodynamic-viral dynamics parameters of maraviroc in asymptomatic HIV subjects. J. Pharmacokinet. Pharmacodyn. 38, 41–61 (2011). [DOI] [PMC free article] [PubMed] [Google Scholar]
- 57.Thevarajan I., Nguyen T. H. O., Koutsakos M., Druce J., Caly L., van de Sandt C. E., Jia X., Nicholson S., Catton M., Cowie B., Tong S. Y. C., Lewin S. R., Kedzierska K., Breadth of concomitant immune responses prior to patient recovery: A case report of non-severe COVID-19. Nat. Med. 26, 453–455 (2020). [DOI] [PMC free article] [PubMed] [Google Scholar]
- 58.H. Akaike, Information theory and an extension of the maximum likelihood principle, in Second International Symposium on Information Theory, B. Petrov, F. Csáki, Eds. (Akadémiai Kiadó, 1973), pp. 267–281. [Google Scholar]
- 59.Nakayama R., Zhang Y.-X., Czaplinski J. T., Anatone A. J., Sicinska E. T., Fletcher J. A., Demetri G. D., Wagner A. J., Preclinical activity of selinexor, an inhibitor of XPO1, in sarcoma. Oncotarget 7, 16581–16592 (2016). [DOI] [PMC free article] [PubMed] [Google Scholar]
Associated Data
This section collects any data citations, data availability statements, or supplementary materials included in this article.
Supplementary Materials
Supplementary material for this article is available at http://advances.sciencemag.org/cgi/content/full/sciadv.abc7112/DC1