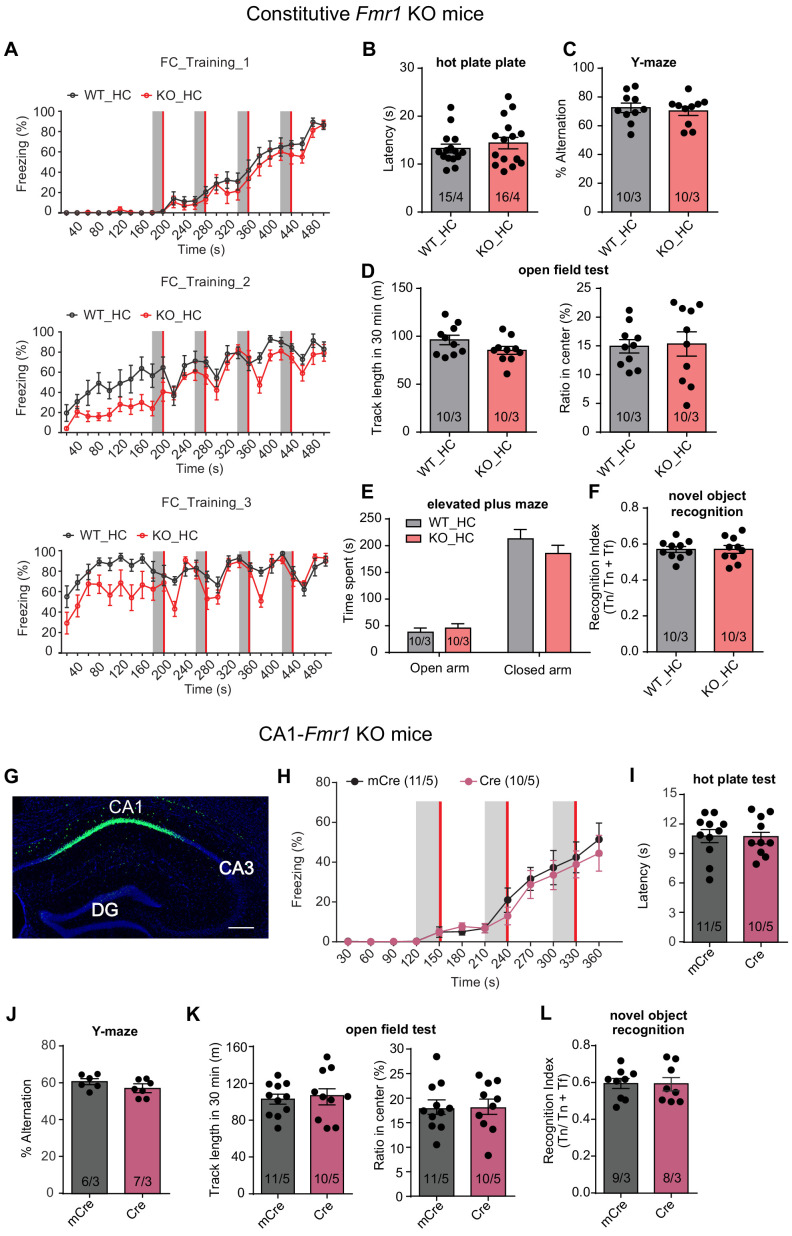
(A) Learning curves of constitutive Fmr1 KO mice in contextual fear conditioning. The intensive fear conditioning training paradigm has three sessions, each consists of four pairs of co-terminating tone (20 s, gray bar) and foot shock (2 s, red bar). Freezing levels before, during and after each tone-shock pair were quantified (Two-way repeated measure ANOVA: training 1: group factor, F(1, 16)=0.8305, p=0.3756; interaction, F(24, 384)=0.4943, p=0.9797; training 2: group factor, F(1, 16)=9.416, **p<0.01; interaction, F(24, 384)=1.170, p=0.2658; training 3: group factor, F(1, 16)=5.896, *p<0.05; interaction, F(24, 384)=1.959, **p<0.01). (B) Hot plate test. Latencies to escape were quantified (p=0.82, two-tailed Mann Whitney U test). (C) Y maze test. Percentage of spontaneous alterations was quantified (p=0.637, two-tailed unpaired t test). (D) Open field test. Left, quantification of track length in 30 min (p=0.1095, two-tailed unpaired t test); Right, quantification of percent track length in center (p=0.8692, two-tailed unpaired t test). (E) Elevated plus maze. Time spent on the open vs. closed arms was measured (Two-way ANOVA: group factor, F(1, 36)=0.5884, p=0.4481; interaction, F(1, 36)=1.853, p=0.1819). (F) Novel object recognition. Recognition index is defined as the ratio between time spent on novel object and time spent on both objects (p=0.9856, two-tailed unpaired t test). (G) A representative image of a hippocampal tissue section showing CA1-specific AAV-mediated expression of Syn-Cre-GFP. Scale bar: 200 μm. (H) Learning curves of CA1-Fmr1 KO mice in conventional contextual fear conditioning test. Three pairs of tone (30 s, gray bar) and foot shock (2 s, red bar) were delivered with a 60 s interval. Two-way repeated measure ANOVA: group factor, F(1, 19)=0.2128, p=0.6498; interaction, F(11, 209)=0.3191, p=0.9812. (I) Hot plate test. Quantification of latencies to escape (p=0.9602, two-tailed unpaired t test). (J) Y maze test. Quantification of percent spontaneous alterations (p=0.1707, two-tailed Mann Whitney U test). (K) Open field test. Left, quantification of track length in 30 min (p=0.7037, two-tailed unpaired t test); Right, quantification of percent track length in center (p=0.9375, two-tailed unpaired t test). (L) Novel object recognition. Recognition index defined as the ration between time spent on novel object and time spent on both objects (p=0.973, two-tailed unpaired t test). n/N, number of mice/number of independent litters. All graphs represent mean ± SEM.


