Abstract
Calculations of X-ray wave propagation in large objects are needed for modeling diffractive X-ray optics and for optimization-based approaches to image reconstruction for objects that extend beyond the depth of focus. We describe three methods for calculating wave propagation with large arrays on parallel computing systems with distributed memory: (1) a full-array Fresnel multislice approach, (2) a tiling-based short-distance Fresnel multislice approach, and (3) a finite difference approach. We find that the first approach suffers from internode communication delays when the transverse array size becomes large, while the second and third approaches have similar scaling to large array size problems (with the second approach offering about three times the compute speed).
1. Introduction
Diffraction limited storage rings are providing the next advance in X-ray brightness from quasi-time-continuous synchrotron light sources [1]. These allow one to combine the high penetrating power and short wavelength of X-rays for nanoscale imaging of increasingly large specimens. Due to the overlap of features in a single view of an extended object, one must use tomography to obtain a 3D view of a specimen from a series of 2D projection images. However, as the transverse spatial resolution is improved, the depth of focus (DOF) decreases according to [2,3]
| (1) |
where is the numerical aperture of the imaging optic, and comes from the Airy function for circular optics. Because of the depth of focus, features at different depths in an extended specimen are no longer sharply viewed in a single projection image. One way to overcome this limitation is to move to an optimization-based approach to image reconstruction, where one constructs a guess of the 3D object, calculates wavefield propagation through the object leading to an exit wave (and subsequently to predicted image intensities), and then adjusts the guess of the object until the difference between predicted and measured image intensities is minimized. Variations of such an approach have been demonstrated in electron microscopy [4,5], light microscopy [6–8], and X-ray microscopy [9–12].
In order to accurately represent the forward problem, these approaches all require one to implement computational wavefield modulation and propagation through a complex 3D object, and thus determine the complex exit wave leaving the object. This propagation is usually done with a multislice approach [13–15], where for one illumination direction one treats the object as being comprised of a set of slices along the beam direction with each slice being thinner than the of Eq. (1). In this approach, the wavefield entering each slice is first modulated by the cumulative non-uniform refractive index variations of the slice along the beam direction, after which the resulting wavefield is transferred through the homogeneous average refractive index of the slice of material to the entrance of the next slice.
Once one has calculated the coherent exit wave leaving the specimen, one can model the subsequent transfer of this wave to measured intensities. This might be done using a lens to produce a direct measure of this exit wave in absorption contrast, or a lens with a Zernike phase ring to transfer weak phase variations to intensities, or holography over modest propagation distances, or far-field diffraction in methods such as coherent diffraction imaging and ptychography. Each of these approaches have their own relative merits, but in all cases, one needs to know the exit wave in order to calculate the expected intensities and compare them with measured intensities to improve one’s guess of the complex refractive specimen.
Because of the potential for X-rays to be used for high resolution, beyond- imaging of thick materials, we consider the question of the computational speed of various approaches for solving the forward problem when extended to large datasets. As an example, X-ray ptychography has been used to obtain nm images of integrated circuit features through 300 m of silicon [16], and 8 nm resolution through 130 m [17]. Both examples were of near-planar feature layers so that beyond- imaging methods were not required. However, if one were to extend these results to a more general 3D object with a pixel size of half the achieved spatial resolution, one would need to propagate 2D wavefields with an array size of [(300 m)/(6 nm)]2=50,0002 or [(130 m)/(4 nm)]2=32,5002. Even larger array sizes are imaginable given that about 10% of a 15 keV incident X-ray beam is transmitted through 1 mm of silicon. It is therefore valuable to consider the computational costs of various approaches for large-array-size wave propagation through inhomogeneous materials.
The most commonly employed method [18–22] for computing evolution of an X-ray wavefield through an inhomogenous refractive object is to use the multislice (MS) method with Fresnel propagation to transfer the wavefield to the position of the next slice. As will be described in Sec. 2.1, this approach involves fast Fourier transforms (FFTs) and multiplication with the Fresnel propagator kernel of Eq. (8). However, another computational approach as described in Sec. 2.3 is to use the Helmholtz equation as a starting point, and solve for the exit wave using finite difference (FD) methods for solving partial differential equations (PDEs). In calculations for wave propagation in X-ray waveguides, this FD approach has been shown to offer speed and accuracy advantages [23,24].
We compare here multislice and finite difference based approaches for the calculation of large-array-size problems in X-ray wave propagation in inhomogeneous media. Comparisons of the two approaches at optical/UV wavelengths for fibres [25] and waveguides [26], and in the X-ray regime for waveguides as noted above, suggest that finite-difference methods are faster, and also more accurate as the propagation step size increases. However, those comparisons have been on problem sizes that fit on a single computational node, whereas for future X-ray experiments we wish to compare their performance on array sizes of 50,0002 or more pixels, as noted above. Therefore, we consider distributed memory parallel implementations of both methods. In the case of the multislice method using FFTs, we consider both a simple whole-array FFT approach, as well as a parallelized version of a short-distance tiling-based approach [27]. For the multislice and finite difference method, we make use of a well-developed software toolkit for solving partial differential equations PETSc/TS framework [28,29] on workstations as well as supercomputers. We first describe the mathematics of our approaches in Sec. 2, provide implementation details in Sec. 3, before discussing metrics in Sec. 4 and results in Sec. 6.
2. Algorithms
We consider here the forward problem of how to calculate the exit wave leaving a heterogeneous refractive index distribution for a large object. In the full-array Fresnel multislice approach, this is done by a sequence of wavefield propagation calculations for one guess of the object, which in turn, is nested within the iterative adjustment of the guess of the object to minimize the difference between predicted and measured image intensities. Because the calculation of wavefield propagation in a heterogeneous medium is undertaken repeatedly, we are interested in approaches that minimize computational time.
Specialized hardware has been developed that can calculate (10,000)2 pixel holograms in just 100 ms [30], though this hardware only solves one step in the overall optimization problem, as noted above. Using a single workstation with a graphical processing unit (GPU), a solid-state drive (SSD) for rapid transfer of partial data to and from limited random access memory (RAM), and efficient tiling strategies as will be discussed in Sec. 2.2 below, single instances of short-distance wavefield propagation of (131,072)2 pixel arrays have been demonstrated with an impressive calculation time of 3.6 minutes [27]. Doing calculations like this in a shorter computational time, and within the context of an optimization-based image reconstruction approach, can be achieved if one utilizes distributed memory parallelism in high performance computing clusters. These clusters typically consist of nodes that are connected by high-bandwidth, low-latency interconnects (with many advances on the latest supercomputers [31]), and protocols such as the message passing interface (MPI) for distribution and coordination of parallelized operations [32].
Because of our interest in X-ray microscopy applications, we limit ourselves to considering the refractive effect of an inhomogeneous medium. Most transmission imaging in X-ray microscopy is either done at soft X-ray photon energies around light element absorption edges (0.2-0.8 keV), or energies of 2–15 keV where one obtains good penetration while still maintaining reasonable contrast from microscopic features [3,33]. In our energy range of interest, X-ray interactions are well described by a complex refractive index of
| (2) |
where we have used the sign convention appropriate for writing forward wave propagation in the propagation direction as with . The phase shifting part and absorptive part of the refractive index are well tabulated [34], and are typically in the range of –, with in most cases. When representing an object in a 3D array with slice thickness along the illumination direction , the net refractive effect of the slice is determined by
| (3) |
leading to an advance in the phase of
| (4) |
and a magnitude reduction of
| (5) |
for the slice. In visible light one might want to use the mean refractive index for propagation to the plane of the next slice, and the refractive index variations the calculation of Eq. (3) for the effect of inhomogeneities within a slice. However, the small values of and for X-rays make that unnecessary.
2.1. Full-array Fresnel multislice
As noted above, full-array Fresnel multislice is a well-known approach developed first in electron microscopy [13,14] and subsequently applied in visible light optics [15] and in X-ray microscopy [18–21] studies. With our particular interest in X-ray optics, this approach has been shown to produce results for very thick optics that are equivalent to those provided by coupled-wave equations [22], allowing for the simulation of the focusing properties of combinations of diffractive X-ray optics [35] as well as accurate modeling of the forward problem for image recovery of objects extending beyond the depth of focus limit [11,12]. What the approach leaves out is the ability to account for backscattered waves [36], but this effect is weak in X-ray interactions with non-crystallline media. Starting with a wave incident on a slice, we first apply the phase advance and magnitude reductions of Eqs. (4) and (5) produced by the slice, giving
| (6) |
as the modulated wavefield, where represents pointwise multiplication. We then propagate this modulated wavefield to the exit plane of this slice, giving a downstream wavefield of
| (7) |
represents a Fourier transform and its inverse, and are the transverse coordinates in the Fourier transform domain. The reciprocal space Fresnel propagation kernel of
| (8) |
is preferred (rather than the equivalent kernel in real space) for short propagation distances to avoid aliasing artifacts [37,38]. One then has
| (9) |
slices for the overall calcuation for a specimen with thickness . This leads to Algorithm 1 for full-array Fresnel multislice.
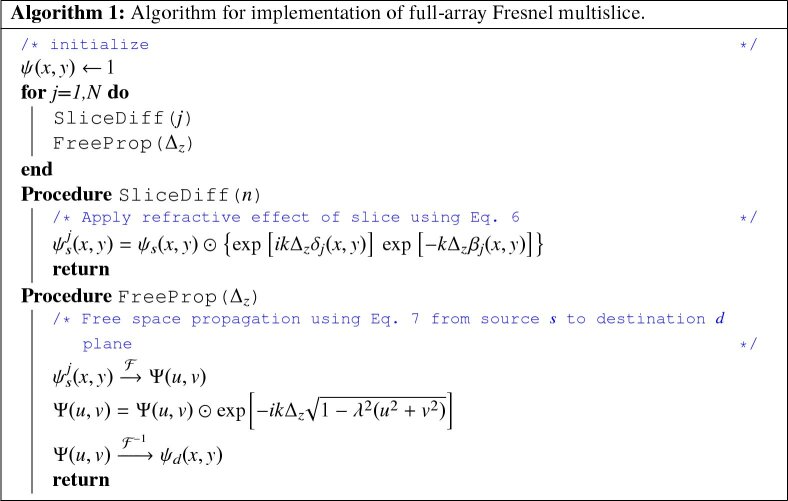
|
How thin should the slices be in the multislice method? Based on Eq. (1), one would expect to require . One comparison tested the full-array Fresnel multislice method (which can model arbitrary refractive index distributions) against coupled wave equation methods (which can be applied to easily defined, regular structures) [22]. This comparison used a parameterization that (in hindsight) is equivalent to the Klein–Cook parameter [39] of
| (10) |
for X-ray volume gratings with period and thickness aligned to the propagation direction . When is well below 1, one can use simple scalar diffraction to describe the effects of the grating, whereas corresponds to the case where volume grating effects become pronounced. If we limit the slice thickness to a value such that and assume , the slice thickness should be kept below a value of
| (11) |
or instead of . However, this is an extreme case that applies to regular gratings at the Nyquist limit, aligned to the beam propagation direction . In practice, a good approach is to start with , and reduce it towards while watching for asymptotic convergence of the exit wave.
The refractive modulation step of Eq. (6) is a per pixel operation (i.e., each pixel in the output array depends only on the corresponding pixel in the input array), leading it to be trivially parallelizable, and one could even distribute the set of and from all depth planes to the appropriate nodes prior to initiating the calculation. However, the Fourier transform of Eq. (7) is a whole-2D-array operation, so it is not trivially parallelizable. While there is considerable activity on developing efficient large-array parallel FFT implementations [40–42], inter-node communication requirements still set performance limits [43]. This motivates the use of other approaches for carrying out the operation of Eq. (7).
2.2. Tiling-based short-distance Fresnel multislice
In the mathematical definition of a discrete Fourier transform, the value of one input plane pixel affects all pixels in the transform, and vice versa. However, in short-distance wavefield propagation, information is localized due to the finite angle of first-order diffraction from the finest features that are Nyquist sampled when using a pixel size of [44,45]. For a propagation distance , this means that Nyquist-sampled diffraction information at the subsequent slice is contained within a radius of
| (12) |
where the identity has been used; the approximate result applies to our case because the pixel size is much larger than the X-ray wavelength. However, this does not incorporate the reality that interference fringes from weak features taper off in amplitude at large transverse distances. An alternative criterion is to consider diffraction from a half-edge, which can be characterized using the Cornu spiral [46] in terms of a dimensionless parameter . This gives
| (13) |
as an expression for the transverse distance for a given propagation distance . In half-edge Fresnel diffraction from a fully opaque object, one reaches the 8th dark fringe, where the intensity modulation is down to 8%, at a value of . Since X-ray microscopy usually involves weak phase objects, their effect at this transverse distance will be quite small; as a result, we use to give
| (14) |
as a reasonable transverse distance beyond which there should be little effect from neighboring features.
Recognizing the limited transverse extent of diffraction from upstream features, one can use a tiling approach to parallelize the short-distance Fresnel multislice calculation [27]. In this approach, a large 2D array is split into a large series of much smaller tiles with buffer zones around their edges as shown in Fig. 1. One can then propagate these tiles separately, discard the buffer zones, and recombine the tiles to form the large 2D array at the downstream plane. These tiles can be sized to fit GPU memory [27] or other specialized hardware [30]. They can also be distributed to nodes on a high performance computing cluster, which is the approach we use here. Consider a large input wavefield array , and a refractive index array . The number of slices is from Eq. (9), with no larger than the depth of focus of Eq. (1) and possibly as small as of Eq. (11). The tiles will have dimensions so that there are and tiles in the and dimensions, respectively. To any interior tile, one must add a buffer zone of physical width from Eq. (14), or pixel width
| (15) |
to each side of the tile with information from neighboring tiles as shown in Fig. 1. This allows one to account for diffraction from features at the edge of nearby tiles into the field of view of the particular tile being processed. For a multislice calculation, one can choose between two alternative approaches to tiling-based Fresnel diffraction using these arrays:
-
•
2D tiling: In this approach, at each slice one divides into tiles , and also the refractive index distribution for slice into tiles of and . In this case, (Eq. (14)) and (Eq. (15)) are calculated for the thickness of one slice, or . The tiles with their buffer zones are distributed to nodes. The refractive index modulation is then applied using Eq. (6), after which propagation by the slice thickness is carried out using Eq. (7) to yield . The buffer zone is then stripped, and is then returned. The various tiles of are then used to form the full input wavefield entering the next slice, and the process is repeated. Because the free space propagation step of Eq. (7) is carried out over a small distance ranging between and , this approach has the advantage of requiring a smaller buffer zone size . However, at each of the slices of the calculation, it requires collecting the tiles from the computational nodes to re-form the full array which then is used to distribute the set of , , and tile arrays to the computational nodes.
-
•
3D tiling: In this approach, at the outset one divides the input wavefield into tiles with (Eq. (14)) and thus (Eq. (15)) calculated using , the total sample thickness (a much larger value than the slice thickness ). One also generates 3D tilings of the refractive index arrays and for all the slices, which are then distributed to computational nodes. The multislice calculation through all slices can then be calculated on each node, after which the buffer zone is removed and the wavefield exiting the sample at each tile position is returned as so that the overall specimen exit wave can be assembled. This approach has the advantage of not requiring any data transfer between computational nodes during the multislice calculation, but it involves each node carrying out its calculations on a larger array due to the increased size of with .
Fig. 1.
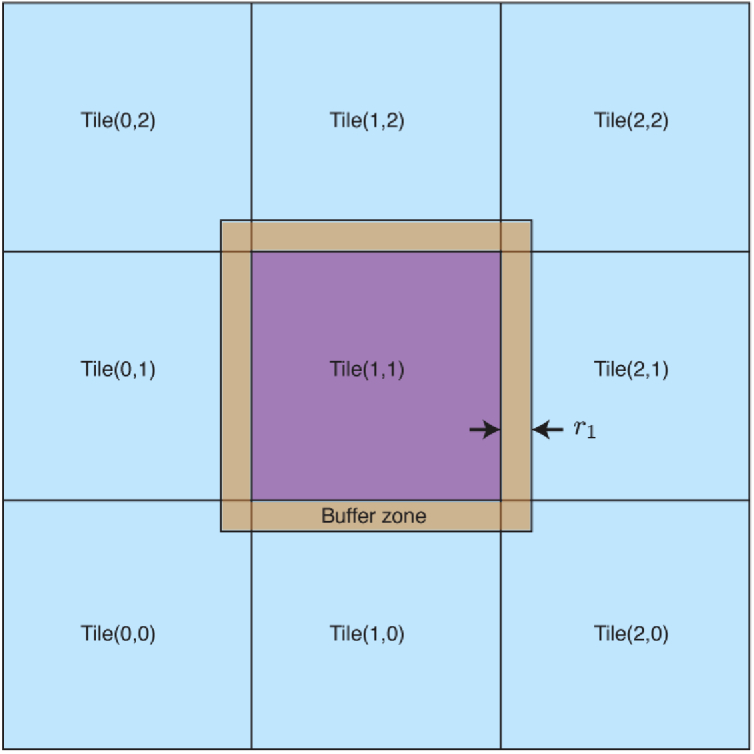
For tiling-based short-distance Fresnel multislice, one can use a tiling approach to split a large 2D array of dimension into a set of smaller arrays, each of size , so that these smaller arrays can be processed on separate computational nodes. When doing so, one must add a buffer zone of physical width (Eq. (14)), and pixel width (Eq. (15)), to each side of the tile with information from neighboring tiles. This accounts for diffraction from features at the edge of nearby tiles coming into the field of view of the tile being processed.
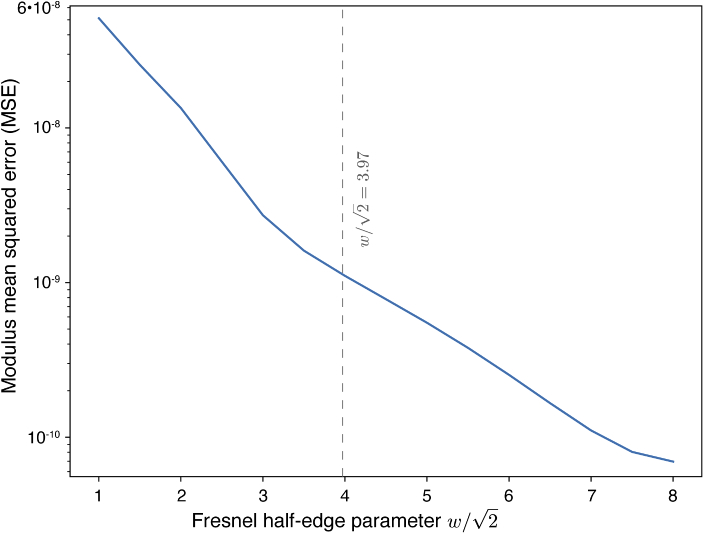
We use the 3D tiling approach, as described in Algorithm 2. Before conducting numerical experiments using the choice of as in Eq. (14), we conducted a validation test using a voxel object that was also used in another publication [12]. The object array contains a hollow capillary tube positioned in the middle. We propagated a plane wave through the object, with the object divided into four 3D tiles of in a grid. This way, each tile has a part of the non-vacuum object filling up to its edge; when the buffer zone width is too small, diffraction fringes of the object would wrap around and reenter from the opposite side, causing errors compared to the result given by full-array Fresnel multislice (the reference). We repeated the propagation simulation to sweep the value of from 1 to 8, leading to the results shown in Fig. 2. When using , which is very close to the value of 3.97 that we have chosen, the mean-squared-error (MSE) of the wavefield moduli between the output of tiling-based propagation and the reference falls to about . Given that the variance of the reference modulus is , this is a negligible error and should lead to sufficiently accurate results.
|
Fig. 2.
Mean squared error of the exit wave of a subregion of a 3D object as a function of the buffer zone width of Eq. (13), showing that the choice of of Eq. (14) gives good results (a mean squared error of compared to a variance in the reference modulus of ). Shown here is the result of using tiling-based short-distance propagation through a voxel object as used in another publication [12]. The object was split into 4 tiles with the “seams” of the tiles running across the object, and buffer zones are added around each tile.
2.3. Finite difference methods
The scalar Helmholtz equation of [2]
| (16) |
describes the propagation of a wave with wavenumber through an inhomogeneous medium with refractive index . To simplify its solution, the wave is separated into two parts: a part that varies in the weak refractive medium, and a part that is an unmodified forward-propagating wave in the propagation direction . This gives
| (17) |
Given the weak X-ray refractive index of Eq. (2), we can assume and approximate Eq. (16) with the parabolic wave equation [47,48] of
| (18) |
If we make the definitions
| (19) |
| (20) |
we can write Eq. (18) as
| (21) |
The expression of Eq. (21) presents a linear second order parabolic differential equation that describes a boundary value problem. Given that we know (at the source plane) and require (at the destination plane), it is more appropriate to rewrite Eq. (21) as an initial value problem [23] so that the equation being solved for at each plane is elliptic. Note that while a more recent formulation of an equivalent to Eq. (22) exists [24], the expression of Eq. (22) is sufficiently accurate for our purposes given the fact that we work at the hard X-ray energy regime. The formulation of Eq. (21) has also been used in prior studies of X-ray wave propagation in thick zone plates [49] and waveguides [23]. We can rewrite Eq. (21) as
| (22) |
The expression of Eq. (22) can be discretized by the use of finite difference methods. Traditionally, the space derivatives are evaluated using a central difference scheme and the time integration is performed via implicit methods (where we have defined time to be the coordinate along the propagation axis). As noted in Sec. 1, this finite difference method has been shown to outperform the full-array Fresnel multislice algorithm when comparing compute time for the same degree of accuracy on single node computers [23,24].
The general Helmholtz equation problem is known to be challenging to solve using finite difference methods [50]. Previous implementations have favored methods that only require tridiagonal matrix inversions using the Thomas algorithm [51]. For one-dimensional systems, the Crank-Nicolson method [52] has been used, while two-dimensional problems have been tackled using Alternating Direction Implicit schemes [51,53] where the wave is propagated along one axis at a time to generate the familiar tridiagonal system of equations. The main disadvantage of ADI is poor scalability to large-scale problems [54].
Instead of formulations that require tridiagonal inversions, we employ iterative solvers along with preconditioners to enable the use of the Crank-Nicholson method for both one- and two-dimensional problems. As expanded upon in the implementation section, we are not required to program these algorithms since we express the problem using PETSc [28,29] which allows us to compose scalable solvers.
The recent availability of high-level discrete adjoint frameworks [55,56] offers another approach for the optimization problem. These frameworks allow one to access the sensitivity of the parameters necessary for an optimization-based inverse-problem reconstruction algorithm. These automatically generated adjoint solvers utilizing the same mode of parallelism as the equations, and potentially run faster than the forward problem (owing to the properties of adjoints and the fact that the adjoints are implemented as a series of linear solves). This is in contrast to the approach used by algorithmic differentiation [57,58], which operates on low-level operations and therefore does not offer quite as high performance.
3. Implementation
The full-array Fresnel multislice (Sec. 2.1) and finite difference (Sec. 2.3) algorithms described above have been implemented using the 3.13.1 release of the PETSc/TS framework [28,29] which is designed to support scalable solvers for partial differential equations (with code available [59]). PETSc supports distributed memory computing using the Message Passing Interface (MPI) [60] as well as the use of graphical processing units. The tiling-based short-distance Fresnel multislice algorithm (Sec. 2.2) was implemented in Python (with code available [61]) using the mpi4py package [62,63] for distributed memory parallelism, and the scientific Python stack SciPy [64] for multithread parallelism for each MPI task. All algorithms used the HDF5 library [65] for parallel disk I/O.
PETSc was installed on workstations and clusters using the spack package manager [66] with the Intel Compiler Collection to take full advantage of the underlying hardware. The Intel Math Kernel Library was chosen as the BLAS/LAPACK implementation for optimal performance for all algorithms.
Initial development and debugging was done on a Linux-based workstation “xrmlite.” Algorithm composition and tuning for optimal distributed memory performance were carried out on the cluster “bebop,” while final scaling studies were performed using the supercomputer “theta,” both at Argonne National Laboratory. The characteristics of these systems are listed in Table 1. PETSc does not use multi-threading, but benefits from higher memory bandwidth, which is available on the KNL processor at high process counts. The tiling-based short-distance Fresnel multislice method prefers the number of ranks per node to be a perfect square, which in this case, happens to match the maximum number of physical cores. Thus, for tests of all three approaches on “theta,” we set the CPU affinity to “depth”, used one thread per rank, and one thread per core. The terminology for the configuration options is given in [67]. We used the balsam workflow manager [68] to pack multiple jobs for queue submission.
Table 1. Compute systems used and their configuration. The machine “xrmlite” is a Linux workstation at Northwestern University. The cluster “bebop” is at the Laboratory Computing Resource Center (LCRC) at Argonne National Laboratory (with four Northwestern University nodes included), while the cluster “theta” is at the Argonne Leadership Computing Facility (ALCF) [69,70]. With both “bebop” and “theta,” we used only a fraction of the large number of available nodes for the strong scaling studies described in Sec. 6.2. We note that “xrmlite” has two Quadro P5000 GPUs, each connected to the CPU via PCIe3.0.
| Compute System | Processor | Cores/node | Memory/node | Interconnect |
|---|---|---|---|---|
| xrmlite | 2x Xeon E5-2620 v4 | 16 | 512 GB | N/A |
| bebop/LCRC | Xeon Phi 7250 | 68 | 192 GB | Omni-Path Fabric |
| theta/ALCF | Xeon Phi 7230 | 64 | 192 GB | Aries Dragonfly |
3.1. Full-array Fresnel multislice
The full-array Fresnel multislice algorithm was implemented using the PETSc [28,71] framework which provides data structures for scalable and efficient linear algebra [72].
The PETSc application programmer interface (API) conceptualizes the fast Fourier transform (FFT) as a matrix multiplication by an “FFT” matrix, where is a matrix multiply , but the matrix is never explicitly constructed. Behind the scenes, the FFT is executed by the FFTW library [73] on CPUs. This matrix multiply can, however, only be performed on a specific class of vectors, since FFTW has its own requirements for distribution of data. PETSc also includes functionality to either create vectors that conform to the FFTW format (with the correct data distribution and padding), or the ability to scatter data from a regular MPI vector to a FFT-compatible vector.
We choose the “FFTW format” as the data structure for all of the vectors that are used in the full-array Fresnel multislice algorithm. This frees us from the tedious task of performing explicit data restructuring to switch between having the wave be FFTW-aligned and having it be distributed as a regular array for dot products (corresponding to Eq. (6)). The only downside to this approach is the poor scalability of distributed memory FFT for a large number of MPI ranks [40,41].
The above implementation of the multislice algorithm makes it straightforward to carry out the functions described in Algorithm 1 using the PETSc API.
3.2. Tiling-based short-distance Fresnel multislice
We used a hybrid programming model combining the message-passing interface (MPI) and multi-threading to implement the tiling-based short-distance Fresnel multislice algorithm. After propagation, the buffer zone of size on each edge of a wavefield tile is discarded, and the valid region of the wavefield is written directly into the correct position of the output array. The output array is stored in an HDF5 file that is accessed in parallel by all ranks. The HDF5 [65] library was accessed via the Python interface h5Py [74,75]. Distributed memory programming was done via the mpi4Py package [62,63] which provides Python bindings to the MPI standard. Fast Fourier transforms (FFTs) were performed using the Intel-processor-optimized package mkl-fft [76] via its NumPy bindings.
3.3. Finite difference
For the finite difference approach, the TS ODE/DAE [29] integrator library (distributed as part of PETSc/TAO) provides a wide variety of scalable solvers for ordinary differential equations (ODEs) and differentiable-algebraic equations (DAEs), obviating the need to write explicit time integration algorithms. Therefore, we chose to implement the finite difference problem as a linear time-step (TS) object in PETSc. To manage the distributed memory grid, we used PETSc’s data-management distributed-array (DMDA) object [28] which is designed for optimal performance when using logically rectangular grids (it re-orders the memory mapping to suit typical differential equation solver operations). As mentioned earlier, previous implementations [23,24] of parabolic wave equation solvers relied on algorithms that were not easily scalable to distributed parallel compute nodes. PETSc enables using a wide variety of preconditioners and Krylov solvers which can be tuned to the problem at hand, thus allowing us to design an algorithm with superior performance and scaling characteristics for parallel computing.
The discretization in space was performed via the central differencing scheme for space derivatives, and the time integration was performed by the TS object using either a first or second-order implicit method as dictated by the needs to the problem being solved. Because our eventual goal is to go from solving the forward propagation problem for a particular object guess (the forward problem), to solving for the object (the inverse problem), maintaining large propagation sizes per step is important as this ensures a minimal size of the refractive index grid while still accurately modelling the diffraction phenomenon. For this reason, we did not test explicit methods such as Euler or non-adaptive Runge-Kutta, as these are unstable at large step sizes. While a one-stage second order implicit method (known as the implicit midpoint method) gives the same result as a two-stage second order implicit method (with endpoint, known as Crank-Nicholson), the two-stage method is significantly faster. Therefore, we used the Crank-Nicholson scheme [52] in PETSc.
We used a GMRES linear solver [77,78] with preconditioning determined by the nature of diffracting object. When the object has some order to its structure (such as for simulating the focusing of thick Fresnel zone plates), algebraic multigrid preconditioning [79–81] was used. When the object of interest is better characterized as being irregular, we observed that an additive Schwarz preconditioner [82,83] was faster. For elliptic problems, one-level additive Schwarz methods are known to be non-optimal with increasing problem size (hence one needs multigrid methods). Depending on the ratio of the time-step size to the subdomain size squared for parabolic problems, it is possible to show the algorithms are optimal [84]; that is, the coarser level solvers of multigrid are not needed. This phenomena is similar to the fact one can replace the full-array Fresnel multislice method with the tiling-based short-distance Fresnel multislice method.
The general idea of multigrid schemes arises from the observation that low frequency residuals are challenging to eliminate using classical relaxation-based preconditioning schemes. Thus multigrid preconditioning works by transferring the residual to a coarser grid (where the residual now contains high frequency components), solving for which gives an estimate for the error which is then transferred back to the fine grid. Classical geometric multigrid preconditioning [85] uses interpolation operators based on the grid geometry to generate the coarse grids. However, algebraic multigrid preconditioning requires no information about the grid, and constructs coarse grids based on the system of equations being solved [80,81]. The selection of coarse grids (akin to graph partitioning) and construction of interpolation operators (with a Galerkin process) together form the “setup” phase. These coarse grids and interpolation operators can be reused for subsequent applications [80,81] of the preconditioner, thereby amortizing the cost of the setup phase. Algebraic multigrid preconditioning has been shown to work well for discretized Helmholtz operators [86].
The general idea of domain decomposition schemes is to split the task of solving the system of equations (arising from the partial differential equation discretization) from one large domain into smaller overlapping domains [82,83,87]. These sub-blocks are then solved independently and these solutions are then iteratively combined. In particular, we used the restricted additive Schwarz method as a preconditioner, which has been shown to improve performance when compared to using it as a solver [87].
4. Wavefield convergence metric
In order to numerically compare the step size sensitivity of each method, we measured the minimum number of slices that each method takes to yield a converged result. In the limit of taking thinner slices (that is, as the number of slices is increased towards ), multislice calculations converge on an exit wave with magnitudes and phases at pixel positions . However, if one were to calculate convergence using the phase of the exit wave , one would possibly need to use phase unwrapping from the complex wavefield, which can be time-consuming and prone to error. The problem can be circumvented by calculating the root-mean-square (RMS) difference of the complex wavefields. Suppose the magnitude of the wavefield calculated using steps is at pixel , while the converged magnitude one would obtain using an infinite number of infintitessimally thin slices is ; also, suppose the phases in the two cases are and , respectively. The complex wavefield RMS difference is given by
| (23) |
Because phase contrast dominates in hard X-ray imaging, we can assume everywhere, with using the Lambert-Beer law of with the X-ray refractive index [3], and indicating the spatial average within the inhomogenous specimen. Since , Eq. (23) reduces to
| (24) |
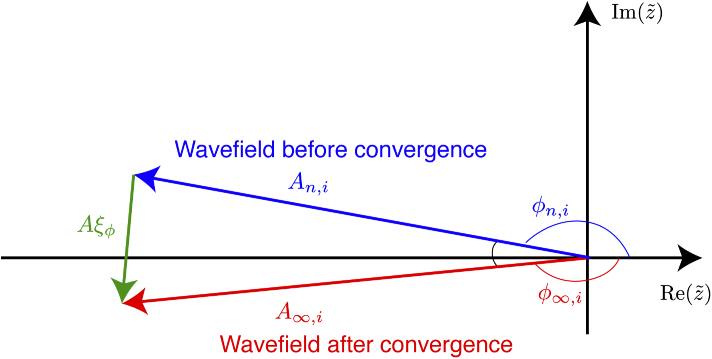
This approximation is illustrated in Fig. 3. Since the RMS phase error represents the standard deviation of a Gaussian distribution, the net reduction in the summation of amplitudes from many waves [3,88,89] is given by . Therefore if we set the requirement
| (25) |
we see that we obtain errors in the unattenuated amplitude () of a wave no greater than 4.8%, since . This is far more stringent than the usual Rayleigh quarter wave criterion for tolerance of phase errors. We therefore judge convergence by decreasing the slice thickness (and thus increasing the number of slices for a given specimen thickness ) until further decreases in lead to changes in of less than in accordance with Eq. (25). This gives us a measurement for the number of slices required to reach convergence of
| (26) |
which we will report for various tests of calculating X-ray wave propagation through thick inhomogeneous media.
Fig. 3.
Illustration of the metric for measuring the RMS average of the magnitude error at one pixel between the complex value before convergence (; shown in blue) and after convergence (; shown in red). When obtaining a particular measure of the phase difference from a complex value on the real (Re) and imaginary (Im) plane, one could obtain erroneous values in the case shown where the phase before convergence is reported as while the phase after convergence is reported as , one would obtain an erroneous phase difference of near . Calculating the RMS difference between complex wavefields (Eq. (24)) circumvents this problem by measuring the end-to-end distance between the red and blue vectors at individual pixels , a result that does not require phase wrapping. When the moduli and are similar, the average modulus of the green vector (labeled here as using Eq. (24)) is approximately linearly related to the RMS average of subtended by the blue and red vectors.
For cases where the inhomogeneous object is surrounded by a featureless outer border (such as is the case for circular zone plates within a rectangular array), the calculation of the RMS amplitude error shown below will be from the feature-containing region, with featureless regions excluded.
5. Experiments
Our goal is to understand the characteristics of the full-array Fresnel multislice, tiling-based short-distance Fresnel multislice, and finite difference methods for propagating large area X-ray wavefields through thick inhomogeneous media. To do this, we carried out numerical tests using two different diffracting objects: a Fresnel zone plate thick enough that waveguide effects become apparent (Sec. 5.1), and a X-ray microtomography reconstruction of a charcoal specimen scaled to match the conditions of nanoscale imaging (Sec. 5.2). In order to understand the relative scattering power of these objects, we calculated the object’s RMS phase deviation as
| (27) |
where refers to a uniform object with the phase shifting part of the refractive index set to the weighted mean of the refractive indices of the same slice (with axial coordinate ). For our calculations, we assumed a photon energy of keV (giving nm), and a transverse calculation grid size or pixel size of nm. Assuming that half-period features can be as small as , one can use Eq. (1) to find a calculation depth of focus of nm, and Eq. (11) to find that the thickness at which the Klein-Cook parameter becomes is given by nm (so that one can assume scalar diffraction, without waveguide effects, within one slice thickness). However, one can in fact use larger slice thicknesses and still meet our convergence criteria from Eq. (25), as will be shown below.
5.1. Fresnel zone plate test object
Fresnel zone plates (Fig. 4) are widely used as X-ray nanofocusing optics [3], since they offer normal incidence mounting and easy energy tunability. For conventional Fresnel zone plates, the spatial resolution is given by where is the width of the outermost, finest zone, and for gold zone plates at keV a thickness along the X-ray beam direction of about m is required to achieve focusing efficiencies that can in theory be as high as about 25%. Since we wish to test the ability of different wave propagation calculation methods to account for waveguide effects in thick structures, we chose to simulate a zone plate with a finest outermost zone width of nm and a thickness of m, giving a Klein-Cook parameter (Eq. (10)) of for the zone width rather than the pixel size. For this zone plate, the depth of focus corresponding to the spatial resolution of is m (Eq. (1)), while the distance over which the zone width would produce a value for the Klein-Cook parameter of is m (Eq. (11)). The magnitude of the exit wave for a zone plate averaged over the central region ( side length) is for a plane wave input with a magnitude of unity. Thus, threshold for convergence (Eq. (24)) for the zone plate test object is
| (28) |
Within this central region, the diffractive power (Eq. (27)) was calculated to be .
Fig. 4.
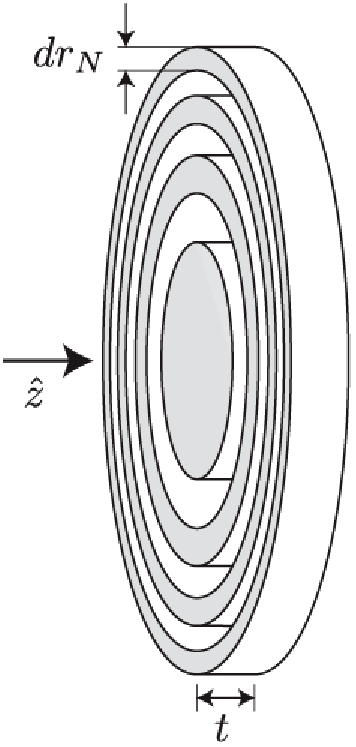
Fresnel zone plate test object, with a thickness and a finest zone width of . The beam propagation direction is also indicated.
Because we wanted to explore the scaling of our calculation with increasing array size with constant pixel size nm, at each array size we generated a zone plate with the above minimum zone width and thickness , but with a diameter equal to 80% of the array size, or . We used partial voxel filling of the zone plate material’s refractive index to handle the cases where the boundary of a zone plate zone was within a voxel [22]. Since there is no variation of the zone structure along the direction of propagation , we only need to store one two-dimensional array for each array which greatly simplifies storage issues. When using a plane wave for illumination, we would be able to propagate the exit wave to the focus position given by
| (29) |
which we have done in other studies [22,35]. However, for our present purposes, we just wish to find the minimum number of slices that lead to convergence of the exit wave to approximately the same value obtained with using a much larger number of slices in the calculation: that is, as described by Eq. (26).
5.2. Porous aluminum test object
As noted above, a Fresnel zone plate provides a structure that can be extended axially to the case where waveguide effects come into play. However, a zone plate is also a highly regular structure, whereas more general specimens in X-ray microscopy are quite irregular.
For a test object that more accurately represents objects that are imaged at synchrotron sources, we used part of an X-ray tomographic reconstruction of an activated charcoal sample acquired in a previous study [90], and now available as the dataset “activated-charcoal” in TomoBank [91]. This 4 mm diameter specimen was imaged using 25 keV X-rays, with a reconstruction pixel size of 0.6 m, resulting in object slices of pixels, and a total number of 4198 object slices (or a voxel array). We then generated a baseline phantom from a subvolume from this array in a manner we now describe (and which is illustrated in Fig. 5). Each object slice in the original reconstruction had a slight ring artifact near the rotation axis center due to imperfect alignment of the data on the reconstruction rotation axis, and these rings could have contributed to a cylindrical waveguide artifact in the final phantom. Therefore, a voxel subregion was selected that did not include this ring artifact. This subregion was then replicated into a grid in the plane of the object slices, with pyramid blending [90,92] used at the tile overlaps, and the outermost 15% of the object slice area blended out to vaccum (that is, to a specimen density of zero). This resulted in a voxel volume, which was then rotated so that the original tomographic rotation axis became the beam propagation direction. Since the multislice propagation slice thickness is usually much larger than the transverse pixel size , we then selected 51 tomographic reconstruction object slices (each separated from its neighbor by 50 slices, out of the center slices in the 4198 slice direction) from this volume. This way, the selected slices are sufficiently different to avoid waveguide effects. This yielded a voxel array, with pixels in the transverse direction and 51 pixels along the beam propagation direction . Finally, the “baseline” phantom in our numerical study is assumed to contain 500 slices of thickness m along the beam propagation direction . This voxel baselone object was formed by looping the 51 object slices back and forth (i.e., arranging the slices in the order 1, 2, , 50, 51, 50, 49, , 2, 1, 2, and its repeat). For convergence tests where was varied to find of Eq. (26) in both Fresnel multislice methods, a smaller number of slices were obtained by linear interpolation of the baseline object along the propagation direction , leading to a modified phantom of voxels.
Fig. 5.
The process used to generate the porous aluminum phantom object (right). A larger scale tomographic reconstruction of an activated charcoal specimen (left) was used as the data source. From the 4198 tomographic reconstruction slices of pixels each, a voxel subregion was selected through all slices to avoid ring artifacts near the rotation axis. This subregion was then replicated into a grid in the plane of the object slices, with pyramid blending used at the tile overlaps and the edges blended out to vaccum (that is, to a specimen density of zero). The resulting voxel array was then rotated so that the original data rotation axis (veritcal, at left) became the beam propagation direction in the phantom object at right, after which both the pixel size and the contrast of the object were modified to yield the porous aluminum phantom object.
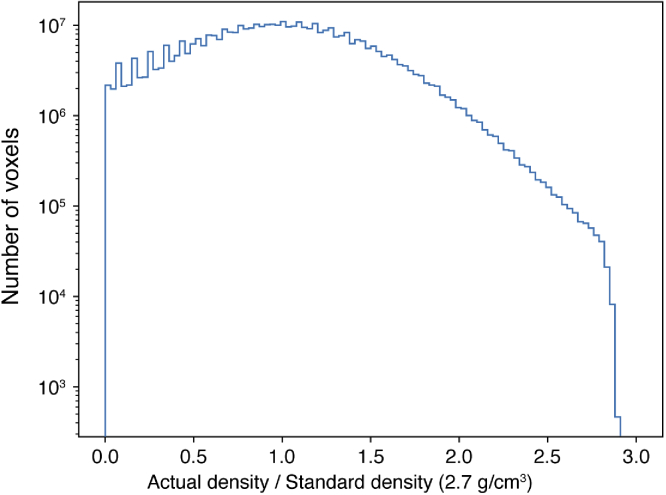
The original tomographic reconstruction was acquired using absorption contrast, whereas we wished to simulate a complex object. Therefore we normalized the absorption map so that it had a mean occupancy of 1, and multiplied it by the tabulated value [93] of (Eq. (2)) for aluminum at 15 keV, effectively giving each voxel a different fractional filling with aluminum. The histogram of the resulting densities shown in Fig. 6 reveals that this led to some pixels having unphysically high densities (which we realized after our convergence and scaling tests were complete), but this only serves to make the object have slightly larger refractive properties with no impact on measuring convergence or calculating speeds of the algorithms tested. We also added to each slice 10–20 disk-shaped gold particles with radii ranging from 5 to 20 pixels (10–40 nm), and a thickness of one slice (or m) to create strongly scattering features. This was accomplished by replacing the of aluminum with that of gold at those positions. The total object thickness was set to m so that the object gave the same diffractive power (Eq. (27)) as the zone plate object. The object thus created had a magnitude of its exit wave of averaged over the central region, leading to a threshold for convergence (Eq. (24)) of
| (30) |
We refer to this test specimen as the porous aluminum phantom.
Fig. 6.
Histogram of voxel densities of the porous aluminum test object. By setting the average occupancy of the charcoal test object to 1 and then multiplying by the refractive index of aluminum, the porous aluminum test object was inadvertently created with voxel densities exceeding the actual density of aluminum. This means that the test object was more strongly refracting than a true aluminum object would be, but this does not affect our measurement of the convergence or timing properties of the algorithms tested.
6. Results
6.1. Convergence results
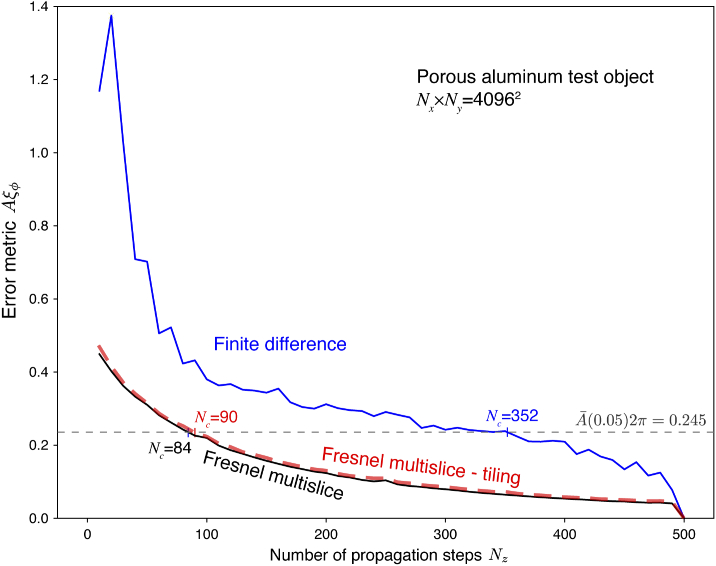
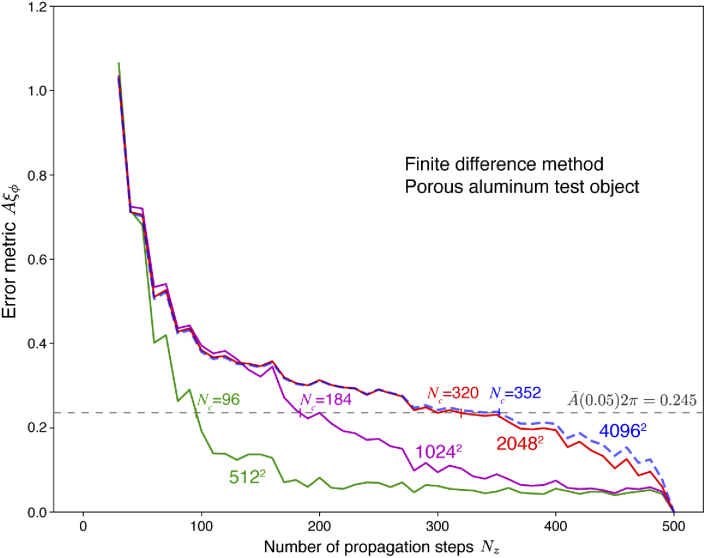
Our first test was to compare the convergence of the three algorithms as a function of the number of slices (Eq. (9)). For this test, we used the porous aluminum test object with thickness m and transverse pixels. The object was re-sampled along the propagation direction to vary and thus . The exit wave was then calculated with the three algorithms of Sec. 2 and successful convergence was measured using of Eqs. (24) and (25) using the value of Eq. (30). As seen in Fig. 7, the Fresnel multislice approaches gave similar values for the minimum number of slices for full-array Fresnel multislice and for tiling-based short-distance Fresnel multislice. The corresponding maximum slice thicknesses of and m, respectively, are both well beyond the minimum pixel value of m noted above. For the finite-difference algorithm, a much larger minimum number of slices of was required, corresponding to m for this irregular object.
Fig. 7.
Convergence test for the three algorithms of Sec. 2 using the porous aluminum test object. For this test, the transverse subarray of the object was selected, and the thickness m was bilinearly re-sampled onto a variable number of slices . Using the convergence criterion of Eq. (26) giving a tolerance for this sample of (Eq. (30)), the full-array Fresnel multislice approach reached convergence with slices with m while the tiling-based short-distance Fresnel multislice approach required slices with m. The finite difference method required slices with m for this irregular object.
We also used the porous aluminum object to test the performance of the finite difference algorithm as a function of the transverse array size , with results shown in Fig. 8. As the array size was decreased from to transverse pixels, the minimum number of slices decreased from to , with the result corresponding to a slice thickness of m which is more similar to what is required for the Fresnel multislice approaches.
Fig. 8.
Convergence of the finite difference approach as a function of transverse array size for the porous aluminum object. As in Fig. 7, the indicated size of transverse array (ranging from to pixels) was extracted from the object, and the total object thickness m was bilinearly sampled along the propagation direction to vary . For each array size, the minimum number of slices (Eq. (26)) was calculated using the convergence threshold of Eq. (30). As can be seen, the finite difference method converges more quickly with smaller transverse arrays, reaching (with slice thickness m) at transverse grid size with this irregular object.
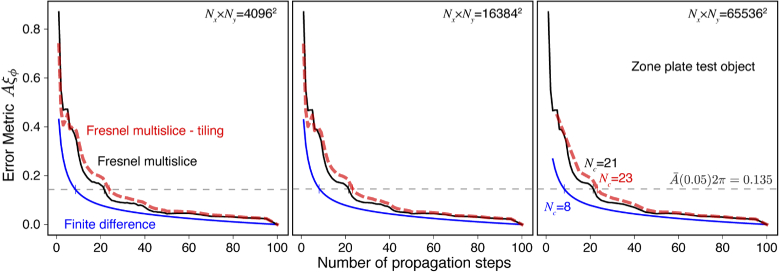
We then tested the three algorithms on the m thick Fresnel zone plate test object, where one would expect to see the finest zone width nm give rise to depth of focus effects (Eq. (1)) at m and waveguide effects (Eq. (11)) at m. We tested the convergence of all three algorithms as a function of transverse array size as shown in Fig. 9, where the zone plate diameter (and thus focal length ) was adjusted to fill 80% of the transverse array size in each case. With this highly regular object, the finite difference algorithm required fewer slices to converge (, giving m) while the two Fresnel multislice algorithms required more slices ( and m for full-array Fresnel multislice, and and m for tiling-based short-distance Fresnel multislice). Since the finite difference method has been shown to converge quickly in calculations of X-ray waveguides [23,24], it is not surprising that it performs better with the regular structure of thick zone plates. All three cases required slice thicknesses that are within a factor of 2 of the Klein-Cook thickness m estimated using Eq. (11), and all three cases had convergence properties that did not depend on the transverse grid size.
Fig. 9.
Convergence test of the three algorithms for a Fresnel zone plate as a highly regular test object. In all cases, the zone plate thickness was m and the minimum zone width was nm, but the diameter (and thus focal length ) of the zone plate was adjusted to match 80% of the transverse array size for , , and transverse pixels, respectively. Using the convergence threshold (Eq. (28)) for this object to find the minimum number of slices (Eq. (26)), all three algorithms had minimum slice numbers that were independent of transverse array size and that were within a factor of 2 of the thickness m (Eq. (11)) at which waveguide effects would be expected for this specimen. The finite difference method required fewer slices with and m, while the two Fresnel multislice methods required slightly more slices ( and m for full-array Fresnel multislice, and and m for tiling-based short-distance Fresnel multislice).
6.2. Scaling results
Having established the convergence of each approach, we then considered performance scalings on parallel computing systems as required for future image reconstruction problems with increasingly large array sizes. Because of the need to adjust transverse array sizes for these tests, we used the Fresnel zone plate test object described in Sec. 5.1, where the zone plate diameter was 80% of the transverse array size. Based on the results shown in Fig. 9, we used slices for the finite difference approach, for the full-array Fresnel multislice approach, and slices for the tiling-based short-distance Fresnel multislice approach. We carried out these tests on the compute system “theta” with properties described in Table 1. The tiling-based short-distance Fresnel multislice approach requires the number of ranks per node to be a perfect square, so we were able to use 64 MPI ranks per compute node, matching the number of compute cores available on each node of “theta.”
The finite difference approach includes a “setup” phase that constructs a new preconditioner object each time a new calculation size is encountered (for the algebraic multigrid preconditioner, this involves setting up the coarse grids and interpolation matrices as described in Sec 3). This preconditioner can then be reused for subsequent applications on the same array size. In our tests below, a preconditioner was constructed for the first propagation step and used, as is, for all the following steps. In an optimization context where the time-stepping (TS) object (which handles the time integration, as described in Sec 3) is re-used, this setup cost would amount to a negligible amount of total runtime.
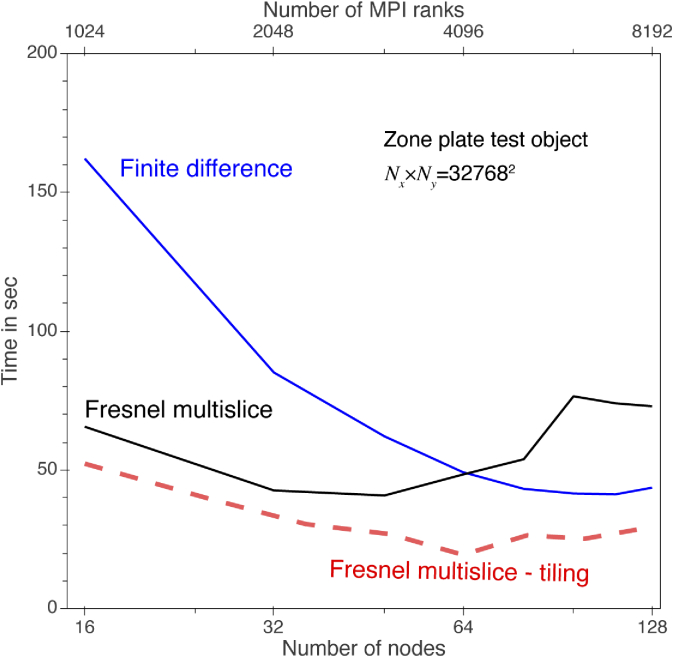
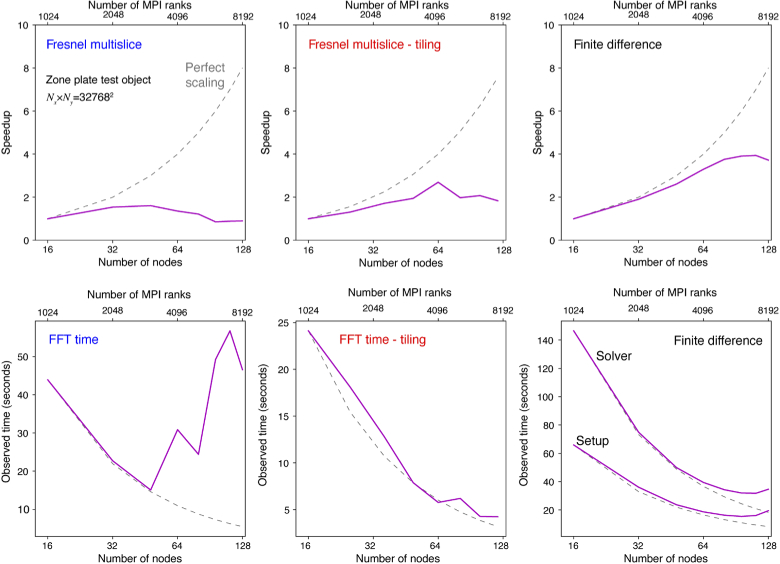
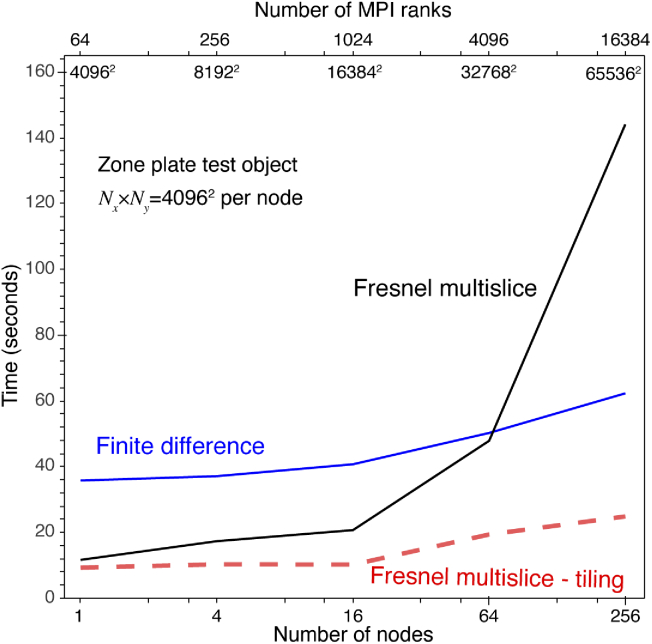
Our first test was to look at the total computation time for a fixed transverse array size of pixels while increasing the number of computational nodes used. In the case of 100% parallel computing efficiency, this so-called “strong scaling” test would be carried out in the time it takes one node to do the entire problem divided by the number of nodes used. As seen in Fig. 10, the full-array Fresnel multislice approach shows only a modest decrease in compute time when more nodes are used, until at 64 nodes and above the calculation time begins to increase, rather than decrease. The “strong scaling” details shown in Fig. 11 show why: the time for doing a fast Fourier transform (FFT) increases with these many nodes as internode communication speed limits outweigh the gains offered by using more cores when carrying out FFTs on large arrays. Because the tiling-based short-distance Fresnel multislice approach gives each node a subarray to work on with communication only at the calculation start (when each node is given its data) and end (when the full exit wave is assembled), it has improved scaling properties especially in terms of FFT time as shown in the bottom row of Fig. 11. The finite difference method implemented using PETSc takes a longer time even though a smaller number of slices are required (Fig. 9), but using more nodes for the same problem gives a more rapid relative decrease in calculation time (that is, better “strong scaling”) until there is no further gain when using more than about 100 nodes for this problem size.
Fig. 10.
Time for calculating the exit wave from the zone plate test object as a function of the number of nodes used. This “strong scaling” test was done with a constant transverse grid size of pixels on the computational cluster “theta” (see Table 1), and using the number of slices each algorithm required for convergence to the error tolerance of Eq. (28) (the resulting values of were consistently within 1 or 2 slices of the values shown in Fig. 9). While the finite difference method takes the longest amount of time with a small number of nodes, it benefits the most from increased parallelization so that the calculation time drops significantly by the time 128 nodes are employed. The full-array Fresnel multislice method shows only a modest time decrease as more nodes are employed, until at 64 nodes the calculation time begins to increase due to the requirement for considerable data communication between nodes. Because the tiling-based short-distance Fresnel multislice approach allows each node to proceed through to the exit wave plane before inter-node communication is again required, it takes the least time but after 64 nodes one again sees a slight increase in calculation time if additional nodes are used. Note that 64 nodes corresponds to a transverse array size of 40962 pixels per node. Further details on this “strong scaling” test are provided in Fig. 11.
Fig. 11.
Further details on the “strong scaling” test results shown in Fig. 10. These tests were of the zone plate test object on a pixel transverse grid. For each of the three calculation methods, we show at top the speedup versus the number of nodes used (with a a linear “perfect scaling” trend showing up as a curved line on this log-linear plot). This shows that the finite difference method has the best scaling to calculation speedup with increased number of nodes. At bottom we show the time required for key operations in the various methods: the time required for a fast Fourier transform (FFT) in the full-array Fresnel multislice and tiling-based short-distance Fresnel multislice methods, and the time for problem setup and then problem solution for the finite difference method. With the full-array FFT approach, the advantage of having more processors is outweighed by data communication overhead when 64 or more nodes are used.
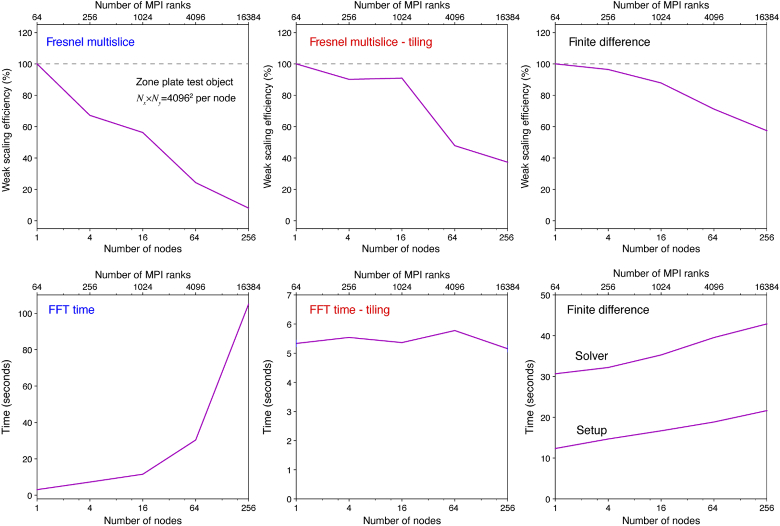
Because our ultimate goal is to use parallel computing to calculate X-ray propagation through increasingly large objects, our next test was to consider array sizes that scaled up with increasing numbers of nodes used. Based on the observation in Figs. 10 and 11 that FFT performance decreases when each node is required to work with array sizes smaller than , we used an array size of in this “weak scaling” test. We increased the number of nodes by factors of 4 () for the full-array Fresnel multislice method in order to have radix-2 array sizes, and also for the finite difference method; since the tiling-based short-distance Fresnel multislice approach requires splitting a large transverse array into an integer number of tiles in each direction, for that method, we increased by a series of perfect squares (). As shown in Fig. 12, the total compute time for the full-array Fresnel multislice approach increases dramatically when the transverse array size goes beyond , with Fig. 13 making it clear that this is due to the time of calculating the FFT of a single large array with lots of internode data communication. The tiling-based short-distance Fresnel multislice approach is the fastest in this test, with the FFT time essentially unaffected by overall transverse array size as shown in Fig. 13; this is as expected given that in this approach each node works only on its local “tile” of the larger array. Once again, the finite difference approach is slower than the tiling-based short-distance Fresnel multislice approach, but it also shows more favorable scaling efficiency with larger problem size as shown in Fig. 13.
Fig. 12.
Time for calculating the exit wave for the zone plate test object as a function of increasing the transverse array size along with the number of nodes, with each node given a transverse grid size of (leading to a net array size of for 256 nodes, as indicated just below the top of the plot). For each algorithm, the number of slices was as required for convergence to the error tolerance of Eq. (28), giving values of that were in all cases within 1 or 2 slices of the values shown in Fig. 9. This “weak scaling” test shows that both the finite difference and tiling-based short-distance Fresnel multislice approaches scale well as the problem size increases with the number of nodes used, consistent with the “strong scaling” test results of Fig. 10. With the full-array Fresnel multislice approach, the time required for data communication between nodes for full-array FFTs means that even with many nodes available large problems require considerably more time to compute.
Fig. 13.
Further details on the “weak scaling” test results shown in Fig. 12. These tests were of the zone plate test object with a constant array size of per node, leading to a net array size of for 256 nodes. The top row shows the scaling efficiency for each of the three algorithms, which is the completion time compared to the 1 node result divided by the number of nodes used. The bottom row shows the time for key operations in each method: a fast Fourier transform or FFT for the Fresnel multislice approaches, and problem setup and solution for the finite difference method. As can be seen, the full-array Fresnel multislice approach has especially poor “weak scaling” performance due to the need for internode communcation at each slice position, while the tiling-based short-distance Fresnel multislice approach offers better parallel performance. The finite difference approach takes a longer time, but with less of a decrease in efficiency for larger transverse array size.
While the largest transverse array size used in the scaling tests described above was , we also carried out one calculation using the tiling-based short-distance Fresnel multislice approach on a pixel array. This was done on “theta” using 256 nodes and 64 ranks per node. This calculation took 12 seconds for data reading and tile division, 99 seconds for writing the array out to an HDF5 file, and 25 seconds for a series of slices, or about 1.1 seconds per slice. Recognizing that the scale of compute power available from “theta” makes this a completely unfair comparison, this is much faster than the 3.6 minute calculation time reported for the equivalent of 1 slice on a standard workstation [27]. We also carried out a tiling-based short-distance Fresnel multislice calculation on a zone plate test object broken into four tiles, with these tiles divided between two graphical processing units (GPUs) on the compute server “xrmlite” (Table 1). In this case, it took 3.68 seconds for CPU–GPU communication, and 0.14 seconds for the FFT calculation, confirming the benefits of GPU based parallelism for FFTs (as expected [94]). Therefore, distributed GPU parallelism is a viable approach for the tiling-based short-distance Fresnel multislice algorithm when the tiles fit in GPU memory.
While the main components of PDE solvers involve sparse linear algebra that are also memory-bound due to their low arithmetic intensity [28], optimal design and implementation of solvers for good performance on GPUs [95] remains a challenge that is being currently addressed [96,97]. In particular PETSc’s algebraic multigrd (GAMG) can execute the solve phase entirely on the GPUs and there is ongoing development on performing the setup phase on the GPUs as well [97]. These performance benefits are passed onto users and do not require changes to application codes. Thus, we note that our finite difference solver will be able to use GPU parallelism when available with minimal code changes.
7. Conclusion
To reach the full potential of X-ray microscopy of combining high penetration in thick samples with nanoscale spatial resolution, it will become necessary to compute wave propagation through inhomogeneous media with a very large array size. This can be used both for calculating the performance of X-ray focusing optics, and also for creating a forward model that can be used for image reconstruction using numerical optimization approaches.
Two approaches used thus far in X-ray microscopy are the finite difference method [23,24], and the Fresnel multislice method [18–22]. We have implemented the finite difference method using the PETSc package [28,29], which offers efficient scaling on distributed memory compute systems. For the Fresnel multislice approach, we have used the fast Fourier transform interfaces built into PETSc for the full-array Fresnel multislice algorithm. We have also used mpi4py to implemented a parallelized version of the tiling-based short-distance Fresnel multislice approach that has been developed first for digital holography [27]. All three algorithms can compute moderately large transverse array problems in a reasonable time. In contrast to multislice methods, the finite difference approach requires fewer slices for convergence when applied to the highly-regular, strong-waveguide-effect zone plate test object (Fig. 9), with more slices, required for the irregular porous aluminum test object. Additionally, for an irregular object, the finite difference approach requires fewer slices to convergence at larger pixel sizes (Fig. 8), which is opposite to the behavior of full-array Fresnel multislice approach. This behavior of the finite difference approach could be used for robust reconstructions at downsampled resolutions.
With the full-array Fresnel multislice approach, one begins to suffer from internode communication bottlenecks at array sizes of on the compute cluster “theta” described in Table 1. The finite difference method and the tiling-based short-distance Fresnel multislice approach offer much better scaling to large array sizes, as shown in Figs. 12 and 13, with the latter approach requiring roughly a third less compute time. We have also tested the tiling-based short-distance Fresnel multislice approach on array sizes as large as with good results. Together, these approaches show that parallelized software packages on high performance compute clusters allow one to calculate X-ray wave propagation in inhomogeneous media with reasonable execution times for very large array sizes. The combination of advances in bright X-ray sources [1] and in high performance computing therefore makes it possible to contemplate nanoscale X-ray imaging of macro-sized objects. The methods tested here show that the forward problem of simulating the exit wave for a guess of the object is computationally tractable, allowing for its use in an optimization approach for object reconstruction.
Acknowledgments
We thank Tim Salditt and Jacob Soltau for helpful discussions regarding the finite difference method. We thank Hong Zhang for programming advice and bug fixes for linear TS solver, and PETSc developers on the petsc-users mailing list for general guidance. We also thank Ed Bueler for providing a preprint of the forthcoming book “PETSc for Partial Differential Equations.” We also thank Argonne Leadership Computing Facility staff for help with optimizing the performance of the algorithms, including but not limited to Sudheer Chunduri for MPI tuning, and Kevin Harms and Taylor Childers for I/O tuning.
Funding
Basic Energy Sciences10.13039/100006151 (DE-AC02-06CH11357); Advanced Scientific Computing Research10.13039/100006192 (DE-AC02-06CH11357); National Institute of Mental Health10.13039/100000025 (R01MH115265).
Disclosures
The authors declare no conflicts of interest.
References
- 1.Eriksson M., van der Veen J. F., Quitmann C., “Diffraction-limited storage rings – a window to the science of tomorrow,” J. Synchrotron Radiat. 21(5), 837–842 (2014). 10.1107/S1600577514019286 [DOI] [PubMed] [Google Scholar]
- 2.Born M., Wolf E., Principles of Optics (Cambridge University Press, Cambridge, 1999), seventh ed. [Google Scholar]
- 3.Jacobsen C., X-ray Microscopy (Cambridge University Press, Cambridge, 2020). [Google Scholar]
- 4.Van den Broek W., Koch C. T., “Method for retrieval of the three-dimensional object potential by inversion of dynamical electron scattering,” Phys. Rev. Lett. 109(24), 245502 (2012). 10.1103/PhysRevLett.109.245502 [DOI] [PubMed] [Google Scholar]
- 5.Ren D., Ophus C., Chen M., Waller L., “A multiple scattering algorithm for three dimensional phase contrast atomic electron tomography,” Ultramicroscopy 208, 112860 (2020). 10.1016/j.ultramic.2019.112860 [DOI] [PubMed] [Google Scholar]
- 6.Maiden A. M., Humphry M. J., Rodenburg J. M., “Ptychographic transmission microscopy in three dimensions using a multi-slice approach,” J. Opt. Soc. Am. A 29(8), 1606–1614 (2012). 10.1364/JOSAA.29.001606 [DOI] [PubMed] [Google Scholar]
- 7.Kamilov U. S., Papadopoulos I. N., Shoreh M. H., Goy A., Vonesch C., Unser M., Psaltis D., “Learning approach to optical tomography,” Optica 2(6), 517–522 (2015). 10.1364/OPTICA.2.000517 [DOI] [Google Scholar]
- 8.Kamilov U. S., Papadopoulos I. N., Shoreh M. H., Goy A., Vonesch C., Unser M., Psaltis D., “Optical tomographic image reconstruction based on beam propagation and sparse regularization,” IEEE Trans. Comput. Imaging 2(1), 59–70 (2016). 10.1109/TCI.2016.2519261 [DOI] [Google Scholar]
- 9.Suzuki A., Furutaku S., Shimomura K., Yamauchi K., Kohmura Y., Ishikawa T., Takahashi Y., “High-resolution multislice x-ray ptychography of extended thick objects,” Phys. Rev. Lett. 112(5), 053903 (2014). 10.1103/PhysRevLett.112.053903 [DOI] [PubMed] [Google Scholar]
- 10.Tsai E. H. R., Usov I., Diaz A., Menzel A., Guizar-Sicairos M., “X-ray ptychography with extended depth of field,” Opt. Express 24(25), 29089–29108 (2016). 10.1364/OE.24.029089 [DOI] [PubMed] [Google Scholar]
- 11.Gilles M. A., Nashed Y. S. G., Du M., Jacobsen C., Wild S. M., “3D x-ray imaging of continuous objects beyond the depth of focus limit,” Optica 5(9), 1078–1086 (2018). 10.1364/OPTICA.5.001078 [DOI] [PMC free article] [PubMed] [Google Scholar]
- 12.Du M., Nashed Y. S. G., Kandel S., Gürsoy D., Jacobsen C., “Three dimensions, two microscopes, one code: Automatic differentiation for x-ray nanotomography beyond the depth of focus limit,” Sci. Adv. 6(13), eaay3700 (2020). 10.1126/sciadv.aay3700 [DOI] [PMC free article] [PubMed] [Google Scholar]
- 13.Cowley J. M., Moodie A. F., “The scattering of electrons by atoms and crystals. I. A new theoretical approach,” Acta Crystallogr. 10(10), 609–619 (1957). 10.1107/S0365110X57002194 [DOI] [Google Scholar]
- 14.Ishizuka K., Uyeda N., “A new theoretical and practical approach to the multislice method,” Acta Crystallographica A 33(5), 740–749 (1977). 10.1107/S0567739477001879 [DOI] [Google Scholar]
- 15.Van Roey J., van der Donk J., Lagasse P. E., “Beam-propagation method: analysis and assessment,” J. Opt. Soc. Am. 71(7), 803–810 (1981). 10.1364/JOSA.71.000803 [DOI] [Google Scholar]
- 16.Deng J., Hong Y. P., Chen S., Nashed Y. S. G., Peterka T., Levi A. J. F., Damoulakis J., Saha S., Eiles T., Jacobsen C., “Nanoscale x-ray imaging of circuit features without wafer etching,” Phys. Rev. B 95(10), 104111 (2017). 10.1103/PhysRevB.95.104111 [DOI] [PMC free article] [PubMed] [Google Scholar]
- 17.Deng J., Preissner C. A., Klug J. A., Mashrafi S., Roehrig C., Jiang Y., Yao Y., Wojcik M. J., Wyman M. D., Vine D. J., Yue K., Chen S., Mooney T., Wang M., Feng Z., Jin D., Cai Z., Lai B. P., Vogt S., “The Velociprobe: An ultrafast hard x-ray nanoprobe for high-resolution ptychographic imaging,” Rev. Sci. Instrum. 90(8), 083701 (2019). 10.1063/1.5103173 [DOI] [PubMed] [Google Scholar]
- 18.Hare A. R., Morrison G. R., “Near-field soft X-ray diffraction modelled by the multislice method,” J. Mod. Opt. 41(1), 31–48 (1994). 10.1080/09500349414550061 [DOI] [Google Scholar]
- 19.Kopylov Y. V., Popov A. V., Vinogradov A. V., “Diffraction phenomena inside thick Fresnel zone plates,” Radio Sci. 31(6), 1815–1822 (1996). 10.1029/96RS01939 [DOI] [Google Scholar]
- 20.Wang Y., Jacobsen, “A numerical study of resolution and contrast in soft x-ray contact microscopy,” J. Microsc. 191(2), 159–169 (1998). 10.1046/j.1365-2818.1998.00353.x [DOI] [PubMed] [Google Scholar]
- 21.Yan H., “X-ray nanofocusing by kinoform lenses: A comparative study using different modeling approaches,” Phys. Rev. B 81(7), 075402 (2010). 10.1103/PhysRevB.81.075402 [DOI] [Google Scholar]
- 22.Li K., Wojcik M., Jacobsen C., “Multislice does it all: calculating the performance of nanofocusing x-ray optics,” Opt. Express 25(3), 1831–1846 (2017). 10.1364/OE.25.001831 [DOI] [PubMed] [Google Scholar]
- 23.Fuhse C., Salditt T., “Finite-difference field calculations for two-dimensionally confined x-ray waveguides,” Appl. Opt. 45(19), 4603–4608 (2006). 10.1364/AO.45.004603 [DOI] [PubMed] [Google Scholar]
- 24.Melchior L., Salditt T., “Finite difference methods for stationary and time-dependent x-ray propagation,” Opt. Express 25(25), 32090–32109 (2017). 10.1364/OE.25.032090 [DOI] [PubMed] [Google Scholar]
- 25.Scarmozzino R., Osgood R. M., Jr., “Comparison of finite-difference and Fourier-transform solutions of the parabolic wave equation with emphasis on integrated-optics applications,” J. Opt. Soc. Am. A 8(5), 724–731 (1991). 10.1364/JOSAA.8.000724 [DOI] [Google Scholar]
- 26.Chung Y., Dagli N., “An assessment of finite difference beam propagation method,” IEEE J. Quantum Electron. 26(8), 1335–1339 (1990). 10.1109/3.59679 [DOI] [Google Scholar]
- 27.Blinder D., Shimobaba T., “Efficient algorithms for the accurate propagation of extreme-resolution holograms,” Opt. Express 27(21), 29905–29915 (2019). 10.1364/OE.27.029905 [DOI] [PubMed] [Google Scholar]
- 28.Balay S., Abhyankar S., Adams M. F., Brown J., Brune P., Buschelman K., Dalcín L., Dener A., Eijkhout V., Gropp W. D., Karpeyev D., Kaushik D., Knepley M. G., May D. A., McInnes L. C., Mills R. T., Munson T., Rupp K., Sanan P., Smith B. F., Zampini S., Zhang H., Zhang H., “PETSc users manual,” Tech. Rep. ANL-95/11 - Revision 3.11, Argonne National Laboratory (2019).
- 29.Abhyankar S., Brown J., Constantinescu E. M., Ghosh D., Smith B. F., Zhang H., “PETSc/TS: a modern scalable ODE/DAE solver library,” arXiv:1806.01437 (2018).
- 30.Sugie T., Akamatsu T., Nishitsuji T., Hirayama R., Masuda N., Nakayama H., Ichihashi Y., Shiraki A., Oikawa M., Takada N., Endo Y., Kakue T., Shimobaba T., Ito T., “High-performance parallel computing for next-generation holographic imaging,” Nat. Electron. 1(4), 254–259 (2018). 10.1038/s41928-018-0057-5 [DOI] [Google Scholar]
- 31.Zimmer C., Atchley S., Pankajakshan R., Smith B. E., Karlin I., Leininger M. L., Bertsch A., Ryujin B. S., Burmark J., Walker-Loud A., Clark M. A., Pearce O., “An evaluation of the CORAL interconnects,” in Proceedings of the International Conference for High Performance Computing, Networking, Storage and Analysis, (Association for Computing Machinery, New York, NY, USA, 2019), SC ’19. [Google Scholar]
- 32.Bernholdt D. E., Boehm S., Bosilca G., Gorentla Venkata M., Grant R. E., Naughton T., Pritchard H. P., Schulz M., Vallee G. R., “A survey of MPI usage in the US exascale computing project,” Concurrency Computat. Pract. Exper. 32(3), e4851 (2020). 10.1002/cpe.4851 [DOI] [Google Scholar]
- 33.Attwood D., Sakdinawat A., X-rays and Extreme Ultraviolet Radiation (Cambridge University Press, Cambridge, 2017), 2nd ed. [Google Scholar]
- 34.Henke B. L., Gullikson E. M., Davis J. C., “X-ray interactions: Photoabsorption, scattering, transmission, and reflection at E=50–30,000 eV, Z=1–92,” At. Data Nucl. Data Tables 54(2), 181–342 (1993). 10.1006/adnd.1993.1013 [DOI] [Google Scholar]
- 35.Li K., Jacobsen C., “More are better, but the details matter: combinations of multiple Fresnel zone plates for improved resolution and efficiency in x-ray microscopy,” J. Synchrotron Radiat. 25(4), 1048–1059 (2018). 10.1107/S1600577518007208 [DOI] [PMC free article] [PubMed] [Google Scholar]
- 36.Chen M., Ren D., Liu H.-Y., Chowdhury S., Waller L., “Multi-layer Born multiple-scattering model for 3D phase microscopy,” Optica 7(5), 394–403 (2020). 10.1364/OPTICA.383030 [DOI] [Google Scholar]
- 37.Goodman J. W., Introduction to Fourier optics (W.H. Freeman, 2017). [Google Scholar]
- 38.Li K., Jacobsen C., “Rapid calculation of paraxial wave propagation for cylindrically symmetric optics,” J. Opt. Soc. Am. A 32(11), 2074–2081 (2015). 10.1364/JOSAA.32.002074 [DOI] [PubMed] [Google Scholar]
- 39.Klein W. R., Cook B. D., “Unified approach to ultrasonic light diffraction,” IEEE Trans. Sonics Ultrason. 14(3), 123–134 (1967). 10.1109/T-SU.1967.29423 [DOI] [Google Scholar]
- 40.Franchetti F., Spampinato D. G., Kulkarni A., Thom Popovici D., Low T. M., Franusich M., Canning A., McCorquodale P., Straalen B. V., Colella P., “FFTX and SpectralPack: A first look,” in 2018 IEEE 25th International Conference on High Performance Computing Workshops (HiPCW), (2018), pp. 18–27. [Google Scholar]
- 41.Takahashi D., “Implementation of parallel FFTs on cluster of Intel Xeon Phi processors,” (2018). SIAM-PP-2018.
- 42.Takahashi D., Parallel FFT Algorithms for Distributed-Memory Parallel Computers (Springer Singapore, 2019), pp. 77–112. [Google Scholar]
- 43.Ibeid H., Olson L., Gropp W., “FFT, FMM, and multigrid on the road to exascale: Performance challenges and opportunities,” J. Parallel Distr. Com. 136, 63–74 (2020). 10.1016/j.jpdc.2019.09.014 [DOI] [Google Scholar]
- 44.Yoshikawa H., “Fast computation of Fresnel holograms employing difference,” Opt. Rev. 8(5), 331–335 (2001). 10.1007/s10043-001-0331-y [DOI] [Google Scholar]
- 45.Shimobaba T., Masuda N., Ito T., “Simple and fast calculation algorithm for computer-generated hologram with wavefront recording plane,” Opt. Lett. 34(20), 3133–3135 (2009). 10.1364/OL.34.003133 [DOI] [PubMed] [Google Scholar]
- 46.Jenkins F. A., White H. E., Fundamentals of Optics (McGraw-Hill, 1976), 4th ed. [Google Scholar]
- 47.Fock V. A., Electromagnetic diffraction and propagation problems (Pergamon, Oxford, UK, 1995). [Google Scholar]
- 48.Vlasov S. N., Talanov V. I., “The parabolic equation in the theory of wave propagation,” Radiophys. Quantum Electron. 38(1-2), 1–12 (1996). 10.1007/BF01051853 [DOI] [Google Scholar]
- 49.Kopylov Y. V., Popov A. V., Vinogradov A. V., “Application of the parabolic wave equation to x-ray diffraction optics,” Opt. Commun. 118(5-6), 619–636 (1995). 10.1016/0030-4018(95)00295-J [DOI] [Google Scholar]
- 50.Ernst O. G., Gander M. J., “Why it is difficult to solve Helmholtz problems with classical iterative methods,” in Numerical Analysis of Multiscale Problems, Graham I. G., Hou T. Y., Lakkis O., Scheichl R., eds. (Springer Berlin Heidelberg, Berlin, Heidelberg, 2012), pp. 325–363. [Google Scholar]
- 51.Thomas J. W., Numerical Partial Differential Equations: Finite Difference Methods (Springer New York, 1995). [Google Scholar]
- 52.Crank J., Nicolson P., “A practical method for numerical evaluation of solutions of partial differential equations of the heat-conduction type,” Math. Proc. Cambridge Philos. Soc. 43(1), 50–67 (1947). 10.1017/S0305004100023197 [DOI] [Google Scholar]
- 53.Peaceman D. W., Rachford H. H., Jr., “The numerical solution of parabolic and elliptic differential equations,” J. Soc. Ind. Appl. Math. 3(1), 28–41 (1955). 10.1137/0103003 [DOI] [Google Scholar]
- 54.Saad Y., van der Vorst H. A., “Iterative solution of linear systems in the 20th century,” J. Comput. Appl. Math. 123(1-2), 1–33 (2000). Numerical Analysis 2000. Vol. III: Linear Algebra. 10.1016/S0377-0427(00)00412-X [DOI] [Google Scholar]
- 55.Farrell P. E., Ham D. A., Funke S. W., Rognes M. E., “Automated derivation of the adjoint of high-level transient finite element programs,” SIAM J. Sci. Comput. 35(4), C369–C393 (2013). 10.1137/120873558 [DOI] [Google Scholar]
- 56.Zhang H., Constantinescu E. M., Smith B. F., “PETSc TSAdjoint: a discrete adjoint ODE solver for first-order and second-order sensitivity analysis,” arxiv:1912.07696 (2019).
- 57.Griewank A., Walther A., Evaluating Derivatives (Society for Industrial and Applied Mathematics, 2008), 2nd ed. [Google Scholar]
- 58.Naumann U., The Art of Differentiating Computer Programs (Society for Industrial and Applied Mathematics, 2011). [Google Scholar]
- 59.Ali S., https://github.com/s-sajid-ali/xwp_petsc.
- 60.Forum M. P. I., “A message-passing interface standard, version 3.1,” https://www.mpi-forum.org/docs/mpi-3.1/mpi31-report.pdf.
- 61.Du M., https://github.com/mdw771/beyond_dof.
- 62.Dalcín L., Paz R., Storti M., “MPI for Python,” J. Parallel Distr. Com. 65(9), 1108–1115 (2005). 10.1016/j.jpdc.2005.03.010 [DOI] [Google Scholar]
- 63.Dalcín L., Paz R., Storti M., D’Elía J., “MPI for Python: Performance improvements and MPI-2 extensions,” J. Parallel Distr. Com. 68(5), 655–662 (2008). 10.1016/j.jpdc.2007.09.005 [DOI] [Google Scholar]
- 64.Oliphant T. E., “Python for scientific computing,” Comput. Sci. Eng. 9(3), 10–20 (2007). 10.1109/MCSE.2007.58 [DOI] [Google Scholar]
- 65.The HDF Group , “Hierarchical Data Format, version 5,” http://www.hdfgroup.org/HDF5/ (1997–2019).
- 66.Gamblin T., LeGendre M., Collette M. R., Lee G. L., Moody A., de Supinski B. R., Futral S., “The Spack package manager: bringing order to HPC software chaos,” in SC15: International Conference for High-Performance Computing, Networking, Storage and Analysis, (IEEE Computer Society, Los Alamitos, CA, USA, 2015), pp. 1–12. [Google Scholar]
- 67.Facility A. L. C., “Affinity on theta,” https://www.alcf.anl.gov/support-center/theta/affinity-theta.
- 68.Salim M. A., Uran T. D., Childers J. T., Balaprakash P., Vishwanath V., Papka M. E., “Balsam: Automated scheduling and execution of dynamic, data-intensive HPC workflows,” arxiv:1909.08704 (2019).
- 69.Facility A. L. C., “Theta machine overview,” https://www.alcf.anl.gov/support-center/theta/theta-machine-overview.
- 70.Harms K., Leggett T., Allen B., Coghlan S., Fahey M., Holohan C., McPheeters G., Rich P., “Theta: Rapid installation and acceptance of an XC40 KNL system,” Concurrency Computat. Pract. Exper. 30(1), e4336 (2018). 10.1002/cpe.4336 [DOI] [Google Scholar]
- 71.Balay S., Abhyankar S., Adams M. F., Brown J., Brune P., Buschelman K., Dalcín L., Dener A., Eijkhout V., Gropp W. D., Karpeyev D., Kaushik D., Knepley M. G., May D. A., McInnes L. C., Mills R. T., Munson T., Rupp K., Sanan P., Smith B. F., Zampini S., Zhang H., Zhang H., “PETSc Web page,” https://www.mcs.anl.gov/petsc (2019).
- 72.Balay S., Gropp W. D., McInnes L. C., Smith B. F., “Efficient management of parallelism in object oriented numerical software libraries,” in Modern Software Tools in Scientific Computing, Arge E., Bruaset A. M., Langtangen H. P., eds. (Birkhäuser Press, 1997), pp. 163–202. [Google Scholar]
- 73.Frigo M., Johnson S. G., “The design and implementation of FFTW3,” Proc. IEEE 93(2), 216–231 (2005). Special issue on “Program Generation, Optimization, and Platform Adaptation”. 10.1109/JPROC.2004.840301 [DOI] [Google Scholar]
- 74.Collette A., “HDF5 for Python,” (2008).
- 75.“HDF5 for Python, https://www.h5py.org/.
- 76.Pavlyk O., Nagorny D., Guzman-Ballen A., Malakhov A., Liu H., Totoni E., Anderson T. A., Maidanov S., “Accelerating scientific Python with Intel optimizations,” in Proceedings of the 16th Python in Science Conference, Huff K., Lippa D., Niederhut D., Pacer M., eds. (2017), pp. 106–112. [Google Scholar]
- 77.Saad Y., Schultz M. H., “GMRES: A generalized minimal residual algorithm for solving nonsymmetric linear systems,” SIAM J. Sci. and Stat. Comput. 7(3), 856–869 (1986). 10.1137/0907058 [DOI] [Google Scholar]
- 78.Saad Y., “A flexible inner-outer preconditioned GMRES algorithm,” SIAM J. Sci. Comput. 14(2), 461–469 (1993). 10.1137/0914028 [DOI] [Google Scholar]
- 79.Briggs W. L., Henson V. E., McCormick S. F., A Multigrid Tutorial: Second Edition, Other Titles in Applied Mathematics (Society for Industrial and Applied Mathematics, 2000). [Google Scholar]
- 80.Stüben K., “A review of algebraic multigrid,” J. Comput. Appl. Math. 128(1-2), 281–309 (2001). Numerical Analysis 2000. Vol. VII: Partial Differential Equations. 10.1016/S0377-0427(00)00516-1 [DOI] [Google Scholar]
- 81.Yang U. M., “Parallel algebraic multigrid methods — high performance preconditioners,” in Numerical Solution of Partial Differential Equations on Parallel Computers, Bruaset A. M., Tveito A., eds. (Springer Berlin Heidelberg, Berlin, Heidelberg, 2006), pp. 209–236. [Google Scholar]
- 82.Widlund O., Dryja M., An additive variant of the Schwarz alternating method for the case of many subregions, Technical Report 339, Ultracomputer Note 131 (Department of Computer Science, Courant Institute, 1987). [Google Scholar]
- 83.Smith B. F., Bjørstad P. E., Gropp W. D., Domain decomposition: parallel multilevel methods for elliptic partial differential equations (Cambridge University Press, Cambridge, UK, 1996). [Google Scholar]
- 84.Cai X.-C., “Additive Schwarz algorithms for parabolic convection-diffusion equations,” Numer. Math. 60(1), 41–61 (1991). 10.1007/BF01385713 [DOI] [Google Scholar]
- 85.Hülsemann F., Kowarschik M., Mohr M., Rüde U., “Parallel geometric multigrid,” in Numerical Solution of Partial Differential Equations on Parallel Computers, Bruaset A. M., Tveito A., eds. (Springer Berlin Heidelberg, Berlin, Heidelberg, 2006), pp. 165–208. [Google Scholar]
- 86.Adams M. F., “Algebraic multigrid methods for direct frequency response analyses in solid mechanics,” Comput. Mech. 39(4), 497–507 (2007). 10.1007/s00466-006-0047-8 [DOI] [Google Scholar]
- 87.Gander M. J., “Schwarz methods over the course of time,” Electronic Transactions on Numerical Analysis 31, 228–255 (2008). [Google Scholar]
- 88.Maréchal A., “Étude des effects combinés de la diffraction et des aberrations géométriques sur l’image d’un point lumineux,” Revue D’Optique Théorique et Instrumentale 26, 257–277 (1947). [Google Scholar]
- 89.Ruze J., “The effect of aperture errors on the antenna radiation pattern,” Nuovo Cimento 9(S3), 364–380 (1952). 10.1007/BF02903409 [DOI] [Google Scholar]
- 90.Vescovi R. F. C., Du M., De Andrade V., Scullin W., Gürsoy D., Jacobsen C., “Tomosaic: efficient acquisition and reconstruction of teravoxel tomography data using limited-size synchrotron x-ray beams,” J. Synchrotron Rad. 25(5), 1478–1489 (2018). 10.1107/S1600577518010093 [DOI] [PMC free article] [PubMed] [Google Scholar]
- 91.De Carlo F., Gürsoy D., Ching D. J., Batenburg K. J., Ludwig W., Mancini L., Marone F., Mokso R., Pelt D. M., Sijbers J., Rivers M., “TomoBank: a tomographic data repository for computational x-ray science,” Meas. Sci. Technol. 29(3), 034004 (2018). 10.1088/1361-6501/aa9c19 [DOI] [Google Scholar]
- 92.Adelson E. H., Anderson C. H., Bergen J. R., . Burt P. J., Ogden J. M., “Pyramid methods in image processing,” RCA Engineer 29, 33–41 (1984). [Google Scholar]
- 93.Schoonjans T., Brunetti A., Golosio B., Sanchez del Rio M., Solé V. A., Ferrero C., Vincze L., “The xraylib library for x-ray–matter interactions. Recent developments,” Spectrochim. Acta, Part B 66(11-12), 776–784 (2011). 10.1016/j.sab.2011.09.011 [DOI] [Google Scholar]
- 94.Steinbach P., Werner M., “gearshifft – the FFT benchmark suite for heterogeneous platforms,” in High Performance Computing Kunkel J. M., Yokota R., Balaji P., Keyes D., eds. (Springer International Publishing, Cham, 2017), pp. 199–216. [Google Scholar]
- 95.Anzt H., Boman E., Falgout R., Ghysels P., Heroux M., Li X., Curfman McInnes L., Tran Mills R., Rajamanickam S., Rupp K., Smith B., Yamazaki I., Meier Yang U., “Preparing sparse solvers for exascale computing,” Phil. Trans. R. Soc. A 378(2166), 20190053 (2020). 10.1098/rsta.2019.0053 [DOI] [PMC free article] [PubMed] [Google Scholar]
- 96.Mills R. T., “Progress with PETSc on manycore and GPU-based systems on the path to exascale,” https://www.mcs.anl.gov/petsc/meetings/2019/slides/mills-petsc-2019.pdf.
- 97.Smith B., Mills R. T., Munson T., Wild S., Adams M., Balay S., Betrie G., Brown J., Dener A., Hudson S., Knepley M., Larson J., Marin O., Morgan H., Navarrow J.-L., Rupp K., Sanan P., Zhang H., Zhang H., Zhang J., “Recent PETSc/TAO enhancements for exascale,” https://ecpannualmeeting.com/assets/overview/posters/petsc-ecp2020-poster.pdf.


