

Abstract
We developed cis-X, a computational method for discovery of regulatory noncoding variants in cancer by integrating whole genome and transcriptome sequencing data from a single cancer sample. cis-X first finds aberrantly cis-activated genes that exhibit allele-specific expression accompanied by an elevated outlier expression. It then searches for causal noncoding variants that may introduce aberrant transcription factor binding motifs or enhancer hijacking by structural variations. Analysis of 13 T-lineage acute lymphoblastic leukemias (T-ALL) identified a recurrent intronic variant predicted to cis-activate the TAL1 oncogene, a finding validated in vivo by ChIP-seq of a patient-derived xenograft (PDX). Candidate oncogenes include the prolactin receptor PRLR activated by a focal deletion which removes a CTCF insulated neighborhood boundary. cis-X may be applied to pediatric and adult solid tumors that are aneuploid and heterogeneous. In contrast to existing approaches which require large sample cohorts, cis-X enables discovery of regulatory noncoding variants in individual cancer genomes.
Even though noncoding regions constitute over 98% of the human genome1, the role of noncoding variants in human cancers remains poorly understood. Recent epigenetic profiling studies have shown that more than 80% of the human genome is potentially functional1, and that the noncoding genome is enriched for disease-associated germline variants discovered by genome-wide association studies (GWAS)2. The oncogenic potential of somatically-acquired noncoding variants is also becoming increasingly apparent3. Studies have shown that different types of noncoding variants can activate neighboring proto-oncogene transcription in cis, such as genomic rearrangements4–7, local genome duplication8, and sequence mutations9–11. At present, whole genome sequence (WGS) analysis alone has limited power for discovery of noncoding regulatory variants12; interpretation of the functional impact of noncoding variants is inherently challenging, given the lack of a direct read-out analogous to amino acid changes in coding regions13. On the other hand, alteration of gene transcription is an expected outcome of regulatory noncoding variants. Therefore, adaptation of eQTL-like approaches, which test for association of expression level and mutation status have been used for discovery of regulatory noncoding variants in several pan-cancer studies5,14. However, these approaches require both recurrence of somatic variants and availability of a large cohort of cancer samples.
Important features shared by regulatory noncoding variants causing aberrant transcriptional activation in cis in cancer include allelic bias with high levels of expression of the affected allele compared to the other allele, and expression levels of the gene qualifying as statistical outliers within a particular tumor type. These features have not been evaluated systematically by robust computational pipelines as the key features of noncoding regulatory variants in cancer12,14–17. Because many cancer genomes are now analyzed by both WGS and whole transcriptome sequencing (RNA-seq)18, it has become feasible to systematically identify genes with both aberrant allele-specific expression and outlier high expression. Thus, we have developed cis-X (cis-eXpression), a computational tool that analyzes individual cancer genomes by systematically identifying candidate oncogenes with these two features. The computational pipeline then searches for noncoding genomic abnormalities, including copy number variations, structural variations, and point mutations (SNVs and indels) occurring within the same topologically associating domain (TAD)19.
As a demonstration of cis-X’s ability to identify oncogenes overexpressed due to noncoding variants, here we apply cis-X to 13 pediatric T-lineage acute lymphoblastic leukemias (T-ALLs) from Shanghai Children’s Medical Center (SCMC), which were analyzed by both WGS and RNA-seq. T-ALL represents an ideal model for this demonstration, because it is one of the best-studied cancers genomically, with a wealth of existing studies connecting various types of somatic noncoding variants with oncogenic activation of transcription factors9,20–25. In addition, RNA-seq data generated from more than 260 T-ALLs by the Therapeutically Applicable Research to Generate Effective Treatments (TARGET) project21 provides an ideal reference data set to establish statistically significant outlier high expression patterns for candidate genes identified in our study. We further show that cis-X is applicable for finding regulatory non-coding variants in aneuploid solid tumors such as neuroblastoma. Our results conclusively demonstrate that cis-X can not only identify known and novel regulatory noncoding variants targeting known oncogenes, but also implicate putative oncogenes for subsequent studies to establish selective dependency.
Results
Design of cis-X
cis-X was developed for discovery of cis-activating somatic variants in individual cancer genomes through integrative variant analysis in WGS and RNA-seq (Figure 1 and Methods). Its core components identify candidate cis-activated genes that exhibit combined allele-specific expression (ASE) and outlier high expression (OHE) to implicate regulatory noncoding variants. Allelic imbalance in each tumor was examined for heterozygous markers in DNA, including both germline single nucleotide polymorphisms (SNPs) and somatic single nucleotide variants (SNVs), across the whole genome (Figure 1).
Figure 1.
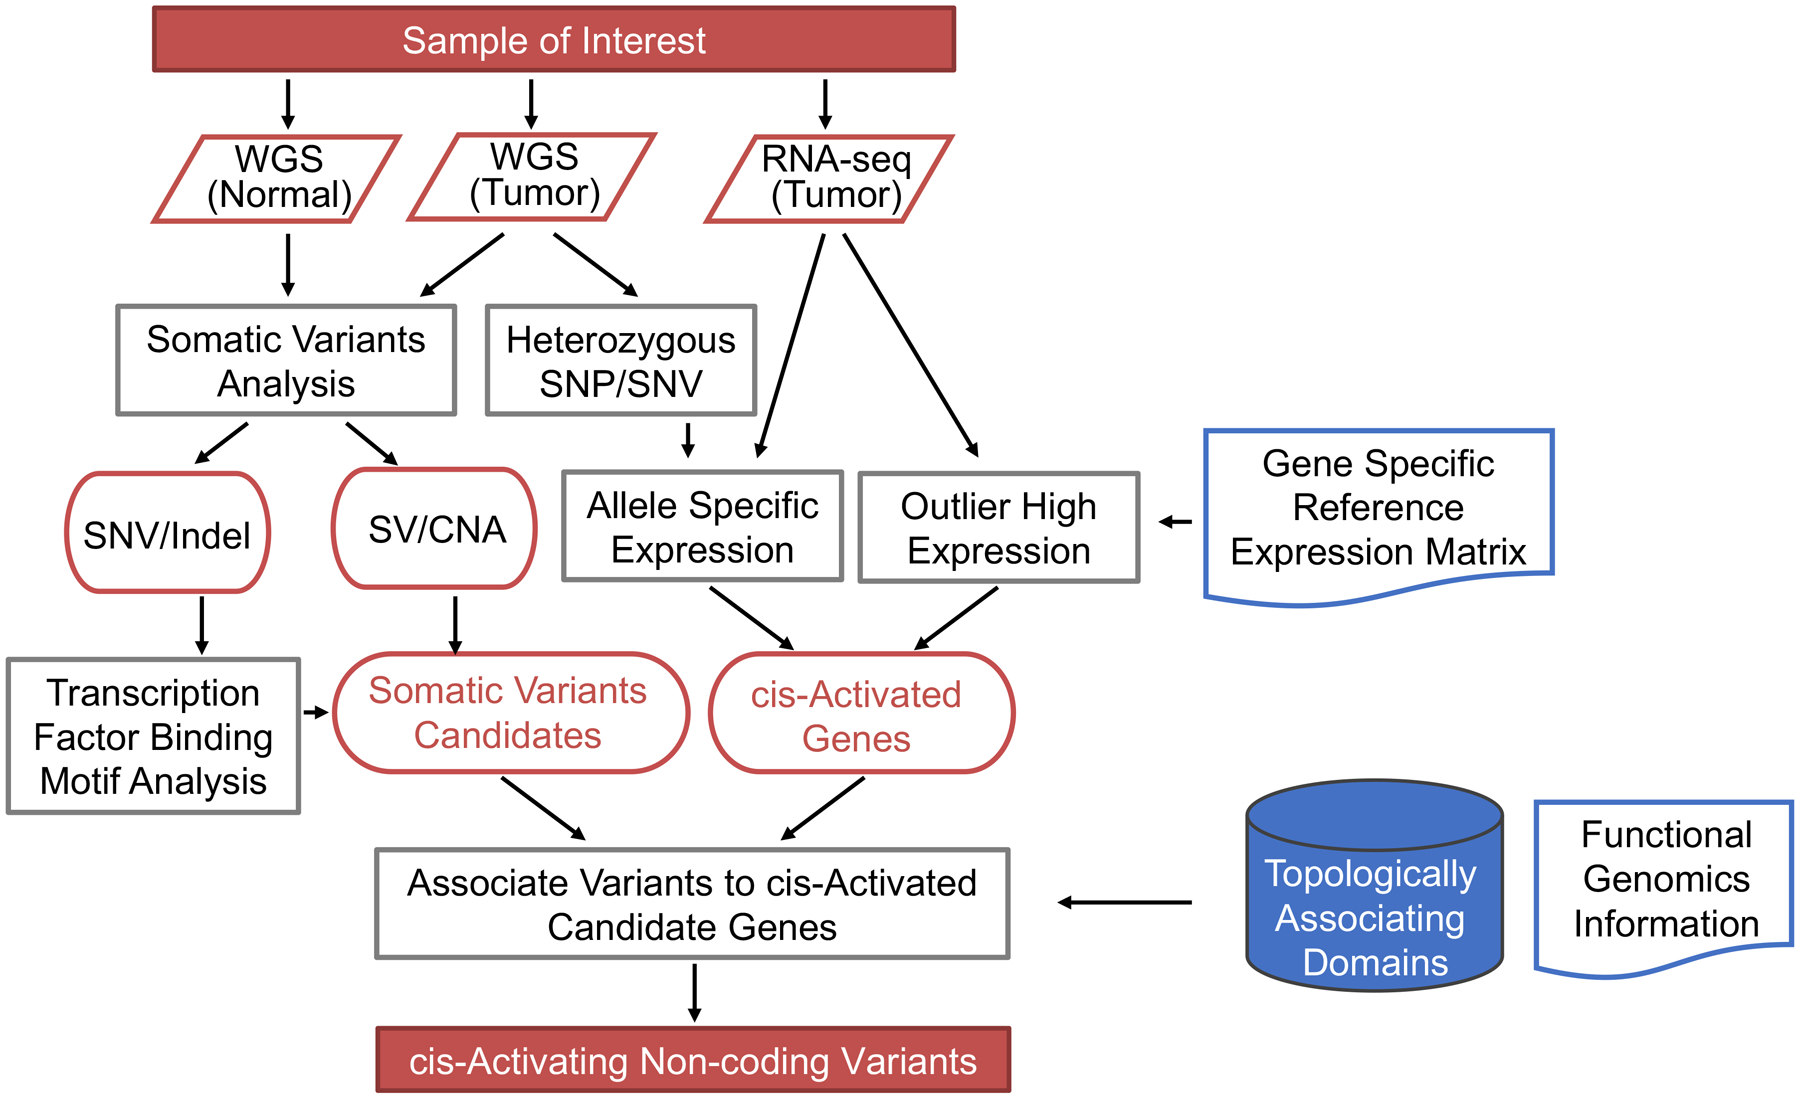
cis-X workflow. cis-X is designed to perform integrated analysis of WGS and RNA-seq data generated from an individual tumor genome. It integrates allele-specific expression and outlier high expression as key signatures of cis-activated genes to seed discovery of regulatory noncoding variants in the context of three-dimensional architecture of the genome. Functional genomics data such as ChIP-seq generated from samples with matching tissue of origin and variant context can be provided by the user for enhancing candidate variant annotation. SV, structural variant. CNA, copy number aberration.
ASE was determined by measuring statistically significant over-representation of one variant allele in RNA-seq for heterozygous markers in tumor DNA. To accomplish that, we first compared allelic imbalance in empirical RNA-seq data with the theoretical binomial distribution and discovered a constant shift toward imbalance in regions expected to have balanced expression. To correct that, we applied a RNA-seq coverage dependent Gaussian distribution to measure this deviation, and test the ASE for each marker under the balanced transcription model characterized by the convolution of the two distributions (Gaussian and binomial). The convolution model provides a better description of experimentally observed gene transcription than other published ASE detection models such as MBASED26 across a wide range of RNA-seq coverages (Extended Data Figure 1 and Supplementary Note). A multi-marker ASE-run analysis was implemented in addition to single-marker test (Methods). Genes would be identified as ASE candidates if they contain exonic or intronic ASE variants or overlap with an ASE-run. A simulation analysis showed that the power for detecting allelic imbalance with convoluted model in cis-X is dependent on imbalanced transcription ratio, aneuploidy, number of heterozygous markers, and the expression level of the target gene (Extended Data Figure 2 and Supplementary Note).
For each gene, outlier high expression of a cancer sample of interest was determined by comparing its expression level to those of reference samples with the same tissue type (Extended Data Figure 3 and Methods). A null distribution of “leave-one-out (LOO)” t-statistic score27 was established using the reference samples. This was then used for determining the FDR of LOO t-statistic score of a cancer sample of interest, and those with FDR <0.05 were retained as having significant outlier high expression.
For the candidate genes with ASE and outlier high expression, somatically acquired variants within or across their TAD boundaries are considered candidate regulatory noncoding variants. These candidate variants are subsequently annotated for their potential to alter transcription factor binding motifs and other related sequence features (Methods).
Identification of cis-activated genes in pediatric T-ALL
We applied cis-X to analyze candidate cis-activated genes in 13 patients diagnosed as T-ALL at SCMC (Supplementary Table 1) using a reference expression data matrix generated from 264 T-ALL RNA-seq from the NCI TARGET project.
On average, the T-ALLs had 6,459 expressed protein-coding genes per case, each of which had at least one heterozygous variant in DNA (range from 5,321–7,091) that could be used to assess ASE (Supplementary Table 2 and 3). From these, an average of 416 genes per sample (ranging from 216 to 977) exhibited significantly imbalanced expression from one of the two alleles, and thus are ASE genes. By intersecting ASE genes with those which showed outlier high expression (Figure 2), we found a total of 222 candidate cis-activated genes in these 13 T-ALL cases, ranging from 10 to 31 predicted cis-activated genes per sample (Supplementary Table 4a and 4b).
Figure 2.

Candidate cis-regulated genes identified by cis-X in 13 pediatric T-ALLs. Each dot represents a cis-activated candidate gene identified in a single tumor that passes the allele-specific expression test (y-axis) and outlier high expression test (x-axis). The significance of genes showed outlier high expression and higher transcription from one allele compared to the other are shown on X and Y-axis, separately, as -log10(q-value) after multiple-testing correction (Methods). The cis-activated candidates nominated from ASE-runs alone are shown at the bottom of the plot. The horizontal and vertical lines in blue represent q-value of 0.05. The candidates are color-coded into different groups based on the cis-activating genomic aberrations and candidate gene status.
To assess the sensitivity of cis-X, we compared the predicted cis-activated genes with 15 T-ALL oncogenes known to be cis-activated by chromosomal translocations, upstream deletions, or small noncoding insertions or SNVs20 identified by paired tumor-normal WGS analysis. This benchmark gene set includes TAL1/2 (n=7), LMO1/2/3 (n=7) and TLX3 (n=1). cis-X identified 14 of the 15 (93.3%) of the benchmark genes (Figure 2). Only one cis-regulated LMO2 gene was missed because LMO2 expression in the sample did not reach statistical significance as an over-expressed outlier.
Identification of somatic noncoding regulatory variants
We next searched for somatic genomic aberrations that could cause cis-activation of the 222 candidate cis-activated genes identified by cis-X (Methods). Of the 222 candidate genes, 33 had somatic alterations located within their TADs that cis-X predicted as candidate causal variants for cis-activation of the candidates (Figure 2). These included 18 structural alterations affecting 14 unique genes, and 12 point mutations (SNVs/indels) targeting 11 unique genes (Supplementary Table 5a and 5b). As expected, we were able to detect the known noncoding variants for well-recognized T-ALL oncogenes including those activating TAL1/2, LMO1/2 and TLX3. While point mutations generally have a single regulatory target, SVs can potentially affect the expression levels of multiple targets in the neighborhood. For example, cis-X identified both ABTB2 and TMEM38B as cis-activated by structural variants; however, both genes were adjacent to known proto-oncogenes in the same TAD (LMO2 and TAL2 respectively) and thus were potentially co-regulated by an aberrant enhancer. In addition to frequently dysregulated transcription factors, LMO3 exhibited aberrantly high levels of mono-allelic expression due to a translocation between LMO3 and the TCRB locus in a single T-ALL (Extended Data Figure 4a and 4b). LMO3 activation is rare in T-ALL, having been previously identified in only a single T-ALL by chromatin conformation capture-on-chip (4C) technology28. Similarly, this is the only tumor with LMO3 activation in the current study, and LMO3 was not expressed in any of the 264 T-ALLs used to construct the reference gene expression matrix. Consistent with the functional similarity to LMO1/2, LMO3 activation in this T-ALL yielded an expression pattern similar to other TAL/LMO driven T-ALLs (Extended Data Figure 4c).
In addition to identifying known noncoding abnormalities, analysis by cis-X has led to the discovery of novel noncoding variants which may affect gene regulation. For example, a recurrent noncoding mutation was detected in two T-ALLs that had cis-activated TAL1 yet did not harbor any previously known regulatory variants. We also detected noncoding variants predicted to cause cis-activation of novel genes such as PRLR in this cohort.
A recurrent intronic mutation activating TAL1 expression
cis-X identified mono-allelic high expression of TAL1 in two T-ALLs; both harbor a recurrent heterozygous C to T mutation located in intron 1 of TAL1 (chr1, g.47696311C>T, hg19, Extended Data Figure 5a). The TAL1 expression levels in these two T-ALLs were comparable to those carrying known regulatory insertions or structural variations (Figures 3a and 3b). The mutation was predicted to introduce a de novo binding motif for YY1, a transcription factor recently found to contribute to enhancer-promoter interactions similar to those mediated by CTCF29. Luciferase assays revealed transcriptional activity of the mutant allele was enhanced 1.6-fold (p=0.003, two-sided t-test) compared with the reference allele (Figure 3c). The same mutation was also evident in additional three T-ALLs in an independent cohort (data not shown). The recurrent presence of this somatic mutation in concert with aberrantly high TAL1 expression levels from one allele, along with enhancer activity demonstrated by luciferase assays, provide multiple lines of evidence supporting this as a novel pathogenic noncoding sequence mutation in T-ALL.
Figure 3.

Discovery and validation of a recurrent intronic noncoding mutation activating TAL1 oncogene. (a) Allele specific expression of TAL1 in the two T-ALLs carrying a recurrent somatic mutation in intron 1 of TAL1. ASE status was determined by the mono-allelic expression of heterozygous germline/somatic variants labeled on top of the wiggle plot, with blue and red representing the reference and alternative alleles, respectively. Arrow indicates position of the novel noncoding C>T mutation. (b) Expression of TAL1 in the two T-ALLs (shown in red text) carrying the novel mutation is comparable to those carrying known cis-activating regulatory variants of TAL1, including the insertion upstream of TAL1, STIL-TAL1 deletion, and other rearrangements in TAL1 locus as shown in different colors. (c) Luciferase assay shows increased transcription activity in cells that transformed with the mutant T allele compared to the wild type C allele. Data are presented as mean value +/− standard deviation (n=3 independent experiments). Two-sided t-test is performed. (d) The mutation introduces transcription factor YY1 binding and an active enhancer at TAL1 locus in vivo, defined by YY1 and H3K27Ac ChIP-seq profiling generated from patient-derived xenograft of the patient carrying this mutation. The YY1 binding and enhancer are only detected on the mutant allele as all reads under the peaks from the ChIP-seq experiment carry the mono-allelic mutant T allele (red), as shown at the bottom. By contrast, the tumor DNA harbors a heterozygous C to T mutation (Extended Data Figure 5).
We further investigated this noncoding mutation in a patient-derived xenograft (PDX) mouse model generated from one of the patient samples (SJALL018373) containing this mutation. We performed H3K27Ac and YY1 ChIP-seq analysis on genomic DNA from this PDX tumor to assay enhancer activity and transcription factor binding caused by this mutation in the native three-dimensional genomic architecture of these leukemia cells. An active enhancer defined by H3K27Ac was observed around the noncoding mutation (Figure 3d), but was absent in both normal T cells and those T-ALL cell lines neither carrying this mutation nor expressing TAL1 (Extended Data Figure 5b). Notably, significant allelic imbalance was observed within this active enhancer, as all H3K27Ac ChIP-seq reads contained the mutant allele (Figure 3d, mutant to wild-type allele ratio is 11:0, p=9.8×10⁻⁴, two-sided binomial test), indicating that the enhancer was only present on the mutant allele but not on the wildtype allele. Importantly, YY1 ChIP-seq analysis of the PDX showed a sharp peak at the mutant site with the mutant allele present in nearly all aligned reads (Figure 3d, p=1.5×10⁻⁸, two-sided binomial test), validating YY1 binding at this mutant enhancer site.
cis-activation of PRLR in T-ALL by upstream deletion
PRLR, which encodes the prolactin receptor, was one of the cis-activated candidate genes identified by cis-X, and showed both allele-specific expression and outlier high expression in a T-ALL sample SJALL043558_D1 (Figure 4a and 4b). A matching 546.7Kb focal deletion located 63.5Kb distal to the transcription start site of PRLR was detected in this tumor. This large focal deletion spans the entire locus of SPEF2 as well as part of IL7R, both of which are protein coding genes. However, PRLR is the only cis-activated candidate gene identified in the 1Mb-region surrounding the deletion (Figure 4b, Extended Data Figure 6a and 6b), implicating PRLR dysregulation as the target of this noncoding structural variation. Notably, PATRUN and PATFYZ, the two T-ALLs in the NCI TARGET cohort with high PRLR expression (Figure 4b), also harbor somatic focal deletions in the same region (Figure 4c). The deletions included the nodal CTCF binding sites forming the boundary of the insulated neighborhood containing the PRLR gene, as defined by ChIA-PET interactions in Jurkat cells4, a T-ALL cell line with no somatic alteration in this region (Figure 4c). An active enhancer could be observed beyond the breakpoint of the deletion furthest upstream of PRLR in tumors with positive IL7R transcription (Extended Data Figure 6c). The deletion disrupts the boundaries of the insulated neighborhood between PRLR and IL7R, bringing the active enhancer from the adjacent insulated neighborhood to PRLR promoter, thus cis-activating PRLR.
Figure 4.
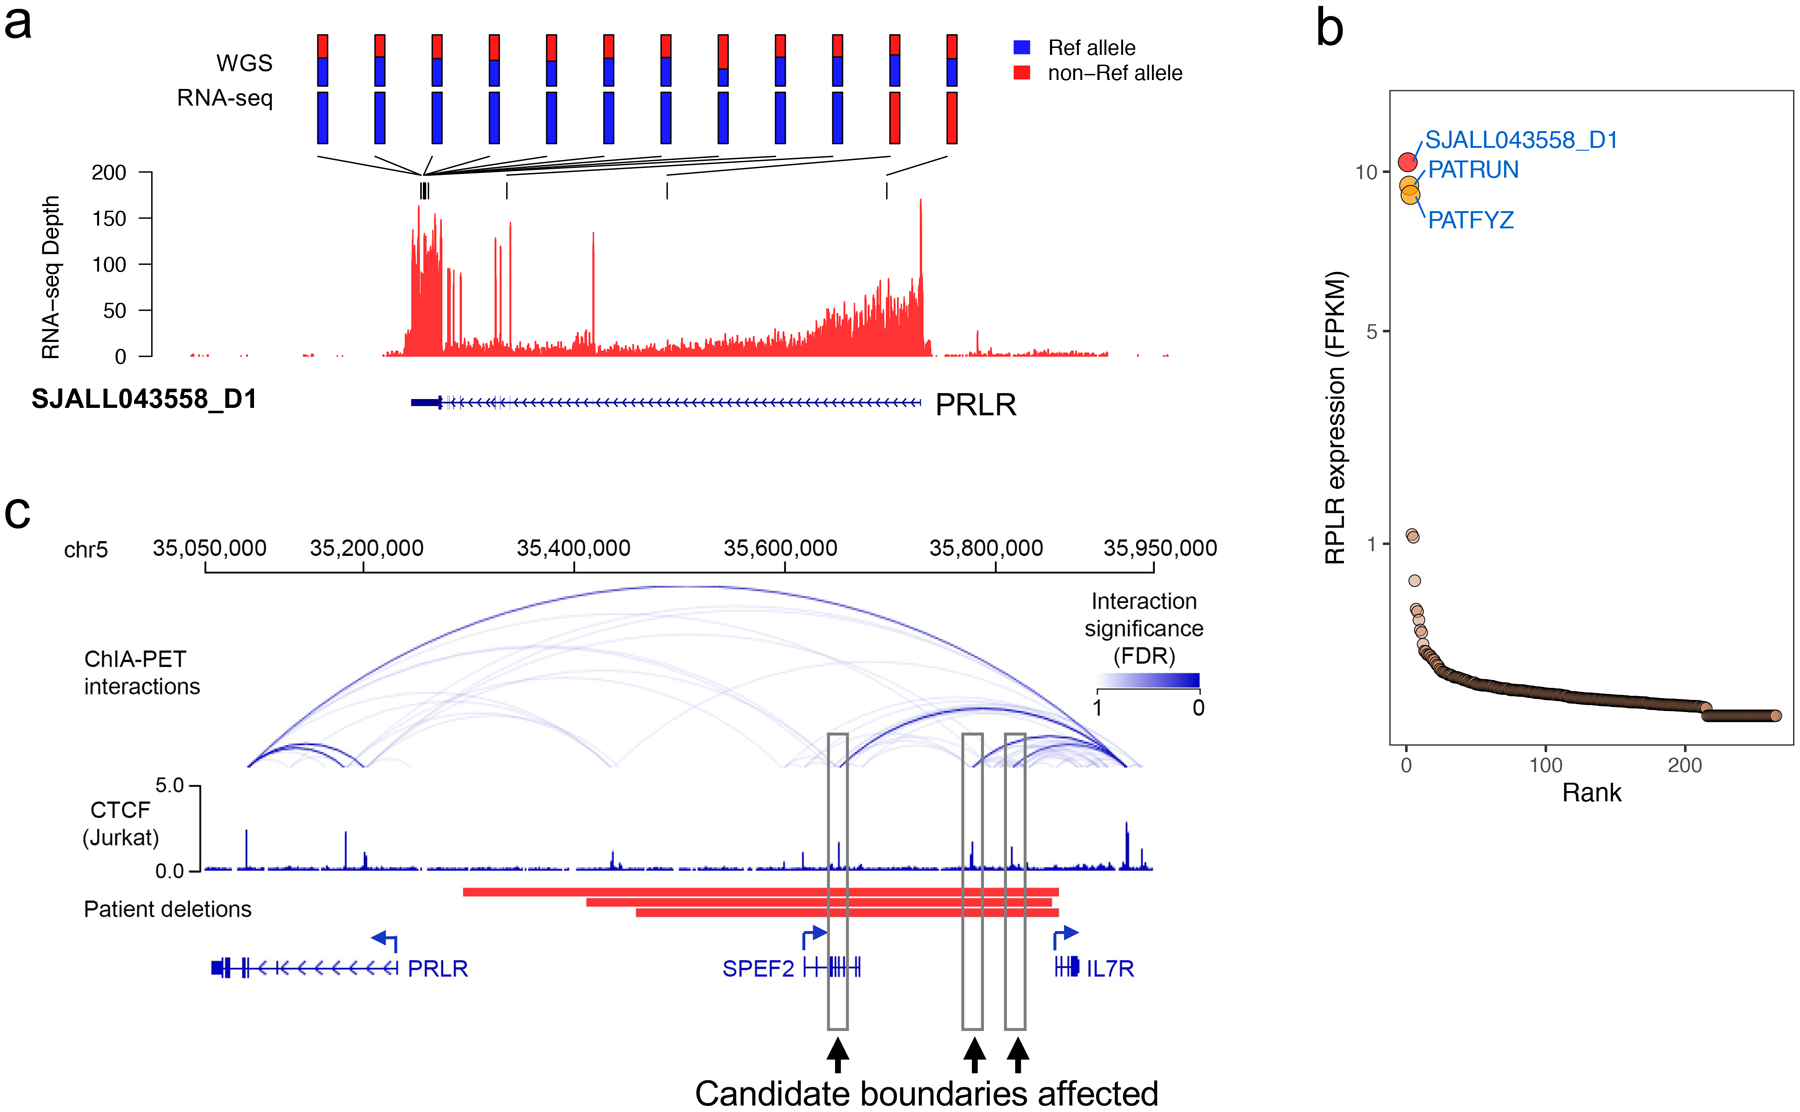
A putative oncogene PRLR in T-ALL identified by cis-X. (a) Allele specific expression of PRLR in T-ALL SJALL043558_D1. Twelve heterozygous germline/somatic variants in this locus all exhibit mono-allelic expression as indicated by their reference allele (blue color) and non-reference allele (red color) fraction in WGS and RNA-seq displayed on top of the RNA-seq wiggle plot. (b) Outlier high expression of PRLR found in sample SJALL043558_D1 (red) together with additional two T-ALLs (orange) from NCI TARGET T-ALL cohort (n=264 samples). PRLR expression level (FPKM) was plotted on y-axis. (c) Focal deletions identified in all 3 T-ALLs exhibiting outlier PRLR expression shown in (b). Cohesin ChIA-PET interactions and CTCF binding profile (blue) collected from Jurkat cells4 show the insulated neighborhood structure of the wild-type PRLR locus, as no somatic alterations were detected in this region in Jurkat cells. Candidate boundaries of the insulated neighborhood affected by the deletions detected in three T-ALL patient samples are indicated by boxes.
These findings implicate PRLR as a candidate oncogene in T-ALL. PRLR is known to activate signaling through JAK2, which in turn activates the STAT5, MAPK and AKT signaling pathways30,31. Notably, all three T-ALLs with cis-activated PRLR are of the TLX1 (PATFYZ) or TLX3 (SJALL043558_D1 and PATRUN) subtypes known to be enriched for mutations that activate JAK-STAT signaling pathways21.
cis-activating noncoding variants in neuroblastoma
We applied cis-X in neuroblastoma (NBL) to test the broad applicability of cis-X on solid tumors with complex genomes. First, we analyzed matched WGS and RNA-seq data generated from four NBL cell lines, with a focus on finding regulatory copy number aberrations and structural variants in aneuploid genomes (Methods, Extended Data Figure 7a). The gene-specific reference expression matrix was built with a cohort of 123 NBL samples from the NCI TARGET project18,32. Using the same parameters applied in T-ALL analysis, cis-X identified a total of 342 cis-activated candidates in the four NBL cell lines, ranging from 25 to 117 per sample. Detected candidate noncoding variants consisted of 22 structural variants affecting 17 unique genes (Supplementary Table 6 and Extended Data Figure 7b). Notably, TERT was identified to be cis-activated by inter-chromosome translocations in three cell lines, replicating previous findings of TERT activation in NBL33,34 and other tumors35,36.
To assess the performance of cis-X on heterogeneous tumor samples, we analyzed 90 NBL primary tumor samples with matching RNA-seq and WGS from the TARGET cohort (Supplementary Table 7), 42 of which had positive immune cell infiltration signature based on prior analysis18. With a focus on TERT, we found that among the 10 samples identified to have TERT cis-activation by structural re-arrangements, 6 had immune cell infiltration signatures and 6 had amplifications at the TERT region (Extended Data Figure 8). These results demonstrate that cis-X can identify regulatory variants in cancer genomes of aneuploidy and tumor heterogeneity.
cis-X analysis of adult melanoma
To evaluate the performance of cis-X on adult cancer, we ran the pipeline on 38 TCGA melanoma that have both paired tumor-normal WGS and tumor RNA-seq (Supplementary Table 8)37. ATAC-seq and H3K27Ac Chip-seq generated from melanoma and normal melanocytes cell lines38–41 were used as input for annotating candidate non-coding variants. However, the two well-known TERT promoter mutations (i.e. chr5, g.1295228C>T and g.1295250C>T, hg19)10,11 were not detected by cis-X because mutation-positive samples lack outlier high TERT expression (FPKM: median 0.095, range 0.012–0.528) in contrast to TERT cis-activation (FPKM: median 3.326, range 0.903–8.088) by re-arrangement detected in neuroblastoma samples (Extended Data Figure 9).
We identified 89 candidate genes predicted to be cis-activated by non-coding variants (Methods), 66 of which involve SNVs associated with UV-like mutational signature (Supplementary Table 9 and Methods). Among the 14 candidate noncoding structural variants was a deletion predicted to cis-activate CDKN2A in sample TCGA-DA-A1HY-06, which appeared to be paradoxical given that CDKN2A is a known tumor suppressor gene. The CDKN2A locus encodes two proteins translated in different reading frames: p16Ink4a, a negative regulator of CDK4/6 of the RB pathway; and ARF, a negative regulator of MDM2 of the TP53 pathway. The deletion in TCGA-DA-A1HY-06 is distinct from the other CDKN2A deletions in that it removes only the exon 1β and the flanking intronic region unique to ARF but retains the full reading frame of p16Ink4a (Figure 5a). Notably, RNA-seq data showed close-to-null expression of ARF but very high expression of p16Ink4a (Figure 5b, c). This is consistent with previous studies of mouse models which found up-regulation of p16Ink4a in pre-B lymphocytes and keratinocytes lacking exon 1β42,43. TCGA-DA-A1HY-06 also has the highest expression of the CDKN2A loci of the entire cohort, suggesting that the elevated expression of p16Ink4a was not caused by loss of competition for alternative usage of exon 1β. It is possible that p16Ink4a cis-activation in TCGA-DA-A1HY-06 was caused by the loss of a repressive element around exon 1β identified recently by CRISPR screening44 and further functional experiment is needed to investigate this possibility. Importantly, mono-allelic expression of the somatic mutation p.Pro81Leu in exon 2 (Figure 5c) known to disable p16Ink4a binding to CDK4/6 and to cause cytoplasmic mis-localization of p16Ink4a 45,46 indicates that cis-activation of the mutant p16Ink4a allele likely contributed to the tumorigenesis of this melanoma sample.
Figure 5.

Cis-activation of p16Ink4a in melanoma. (a) Somatic deletions at CDKN2A locus detected in 38 TCGA melanoma samples. The deletion in sample TCGA-DA-A1HY-06 (marked in red) is unique as it removes only the unique exon (exon 1β) of ARF without affecting the p16Ink4 locus. (b) Expression of CDKN2A locus measured by FPKM in the melanoma cohort color-coded by deletion status. The red dot represents TCGA-DA-A1HY-06 which harbors the unique exon 1β deletion. (c) RNA-seq expression of CDKN2A locus in sample TCGA-DA-A1HY-06 which shows expression of exon 1β is almost undetectable suggesting the sample is ARF-null but p16Ink4 intact. The arrow points to the coverage of exon 1β estimated to have <2% level of that of exon 1α. Mono-allelic expression of CDKN2A p.Pro81Leu mutation suggest that cis-activation occurred on the mutant allele.
Discussion
We have developed a novel computational method cis-X, which systematically identifies genes in individual cancer genomes that exhibit both unusually (outlier) high levels of expression and allelic bias such that one allele was expressed at significantly higher levels than the other. cis-X enables discovery of somatically acquired noncoding regulatory DNA alterations that operate in cis to activate the expression of neighboring proto-oncogenes on the same allele in individual human cancers. This design overcomes two major limitations of existing approaches (i.e. hotspot analysis or mutation-expression association test): the requirement for a large cohort of samples, which is usually only attainable in a pan-cancer study and the requirement that non-coding variants are recurrent to achieve statistical significance. By contrast, cis-X can be applied to identify activated oncogenes in individual cancer samples. This was demonstrated in our discovery of LMO3 and PRLR in a single case in the 13 T-ALLs from SCMC and the finding of PRLR cis-activation was subsequently replicated in two T-ALLs in TARGET by utilizing the copy number variation data generated from SNP arrays. Cis-X analysis can also unveil heterogeneity in the disruption of normal gene regulation by different variant types (i.e. point mutations or structural alterations) dispersed in multiple regions. For example, our finding of the TAL1 intronic mutation is located 8.7 kb distal to the previously identified somatic insertion hotspot upstream of transcription initiation9 and the two regulatory mutations we found that activate LMO2 are 53 kb apart24,25. This capability becomes especially important in precision medicine where genome analysis is applied in a case-specific way.
By effectively utilizing the genetic variation data in WGS and interrogating associated expression status in RNA-seq, cis-X can identify the cis-regulated candidate genes within a single cancer genome and has the flexibility to analyze RNA-seq data mapped by different algorithms (Supplementary Note). One potential limitation is posed by a lack of heterozygous variants in a gene; this can be ameliorated to some extent by the ASE-run analysis implemented in cis-X, which enables utilization of informative markers flanking the genes. Meanwhile, broad adoption of total RNA sequencing could further increase the power of cis-X, as transcribed intronic variants from unspliced RNA can provide additional informative markers for ASE analysis. In addition to the number of heterozygous variants, imbalanced transcription ratio (effect size), aneuploidy, and the expression level of the target gene can all affect the power for detecting ASE (Supplementary Note). Currently cis-X is designed only for identifying cis-activating candidates that exhibit outlier high expression and will miss regulatory variants causing down-regulation as reduced expression of one allele can be caused by many alternative mechanisms such as imprinting or nonsense mediated decay (NMD) due to the presence of truncation variants. Additionally, it may not be effective in detecting regulatory noncoding variants on sex chromosomes due to scarcity of bi-allelic expression in normal cells, or in detecting variants that do not cause outlier high expression (Supplementary Note). Despite these limitations, cis-X provides an approach that complements the existing recurrence-based methods in detecting cis-activating somatic variants and can be applied for analyzing solid tumors that may have extensive aneuploidy and heterogeneity (Figure 5, Extended Data Figure 8).
Functional genomics data including three-dimensional genome architecture and epigenetic profiling of regulatory elements could provide valuable information to noncoding variant prediction. We have incorporated TAD structure for defining regulatory territory of a given cis-activated candidate in noncoding variant discovery, as this is relatively stable across different tissue types47. In the current implementation, the TAD structure of the human embryonic stem cells (H1) is used as the default because a good fraction of proto-oncogenes are actively transcribed during the embryonic stage48. This can be replaced by custom TAD data generated from a matching cellular context provided by a user. On the other hand, epigenetic data such as H3K27Ac ChIP-seq used for enhancer profiling can be highly specific to a tissue type, a cell lineage or presence of a regulatory variant. For example, the novel intronic TAL1 mutation identified by cis-X in T-ALL patient samples resulted in an active enhancer present only in the H3K27Ac ChIP-seq data generated from the PDX model but not in other publicly available data sets (Figure 3 and Extended Data Figure 5b). Therefore, the ideal data set for non-coding variant annotation is the epigenetic data generated from a matching sample such as PDX, which can be supplied as a custom input for cis-X analysis (Figure 1). Given the challenges in acquiring a matching epigenetic data set, epigenetic profiling data of the ROADMAP project49, considered to be the most comprehensive epigenetic data resource, is used as an alternative for variant annotation by cis-X.
Experimental validation of predicted noncoding variant candidates is an important step in the discovery of bona-fide regulatory noncoding variant. Ideally, such experiments should be carried out in patient-derived xenograft (PDX) model as demonstrated in our validation of the novel TAL1 intronic variant in a T-ALL patient sample (Figure 3). However, in vivo validation may not always be feasible or possible as not all tumors can be engrafted successfully50. In vitro reporter assays can be an alternative approach, but the results may be confounded by lack of the matching transcriptional regulatory network and the high-order genomic architecture required for accurate assessment of the regulatory function. In an attempt to perform a preliminary validation on the 12 SNV/indel candidate non-coding variants identified in T-ALL, we found that the read-out from the luciferase report assay in Jurkat (Supplementary Note), a commonly used T-ALL cell line, contains false negatives as well as reduced read-out signal. This experience highlights the importance of in vivo validation in interpreting the functional impact of a candidate noncoding variant.
Our experience in applying cis-X in T-ALL demonstrates that this method effectively identifies noncoding variants that are known to activate oncogene expression in this tumor, and more importantly enables the discovery of both novel candidate oncogenes and the somatically acquired genomic abnormalities that mediate their high levels of expression. Analysis of WGS and RNA-seq data using cis-X, which complements the recurrence-based methods employed by the Pan-Cancer Analysis of Whole Genomes (PCAWG) Consortium in a recent study12, will lead to new insight on the noncoding driver variants that cause oncogenic activation. The publicly available cis-X software provides a powerful approach for investigating the functional role of noncoding variants. We expect it will spur extensive laboratory investigations and functional studies, both to assess the level of tumor cell dependency on the activated oncogene, and to establish experimentally the mechanisms underlying aberrant transcriptional activation.
Online Methods
cis-X analysis
The cis-X computational pipeline is designed to analyze somatically acquired regulatory noncoding variants from individual tumor genomes. The workflow for cis-X includes the following steps.
Modeling balanced transcription. To query heterozygous genetic variations in DNA that exhibits allelic imbalance in RNA expression we first define i, a value of imbalance, to quantitatively measure ASE:
Where Ra and Rb denotes RNA-seq read count of allele a and allele db of a heterozygous variant in tumor DNA. This value can range from 0, i.e. balanced expression of two alleles (Ra=Rb) to 1, mono-allelic expression (Ra = 0 or Rb = 0).
First, we compared the distribution of i collected from the empirical data with the theoretical binomial distribution assuming balanced expression, which implies the probability of success is equal to the probability of observing one of the alleles, p = 0.5, and a number of tries is equal to the coverage in RNA-seq. Our preliminary analysis, which compared the empirical WGS and RNA-seq data from 10 T-ALL cell lines (including Jurkat, Loucy, Molt3, CCRF-CEM, DND41, DU528, KOPT-K1, P12-ICHIKWA, PF-382 and RPMI-8402, unpublished data) with the theoretical binomial distribution, revealed a constant shift of empirically measured i towards less balanced transcription (Extended Data Figure 1). We reasoned that the shift in empirical data is caused by a combination of sampling bias of the two alleles and allelic transcription fluctuations. As a result, the balanced transcription can be modeled by convolution of corresponding distributions:
Where B denotes binomial distribution, G denotes Gaussian distribution, N denotes coverage in RNA-seq for a given marker, k denotes the number of reads for one allele observed in RNA-seq and p for possibility of transcription of one allele over the other, which equals to the variant allele frequency in DNA for balanced transcription (e.g. 0.5 for diploid regions, 0.33 or 0.67 for regions with 3-copy number). An asterisk denotes operation of convolution.
To estimate the sigma in Gaussian distribution for balanced transcription, we analyzed the WGS and RNA-seq data generated from 10 T-ALL cell lines, as above. To select the balanced transcribed variants, we excluded genes with heterozygous variants within promoter regions (defined as 2kb upstream transcription start site) or 3’-UTR; known as imprinting genes; or overlapping non-diploid regions based on WGS analysis. This resulted in a list of 408,257 markers, with which the sigma could be estimated as below:
Where N denotes coverage in RNA-seq.
The model was used to test the null hypothesis: balanced transcription for each individual marker as below.
where k denotes tested number of reads, N denotes coverage at tested marker, and p is a probability calculated from balanced transcription model.
Allele-specific expressed (ASE) candidate analysis. Heterozygous variants extracted from individual tumor genome, were used for allelic imbalance analysis in RNA-seq data. A coverage threshold of 10 in both WGS and RNA-seq was applied in the current study. cis-X first identifies markers with allele-specific expression signal by comparing variant allele frequency (VAF) between genomic DNA and RNA transcripts with the convolution model. P-values for individual markers showing imbalanced expression were further combined based on gene structure and corrected for multiple testing. Genes with FDR<0.05 and an average |VAFDNA - VAFRNA| ≥ 0.3 (a threshold of 0.2 will be used if over 30% of markers in the gene fall into CNA/LOH regions) were considered to be ASE candidates. A multi-marker analysis was implemented in parallel to identify regions with consecutive markers that exhibit ASE as ASE-runs. An ASE run requires a minimum of 4 markers showing significant ASE or mono-allelic expression and terminates if two or more markers were not qualified in these criteria sequentially. Genes overlapping with the ASE-run were considered as allele-specific transcribed.
Outlier high expression (OHE) candidate analysis. The expression of a given gene in the tumor sample under analysis was compared to a pre-calculated gene-specific reference expression matrix with leave-one-out (LOO) test27. Tumors of the same histotype were used in constructing the reference expression matrix, ensuring the same cell of origin. For our T-ALL demonstration project, we built the reference expression matrix from a cohort of 264 T-ALLs generated by the Therapeutically Applicable Research to Generate Effective Treatments (TARGET) project21, with matched whole exome sequencing and RNA-seq available. For each gene, bi-allelic expressed samples were selected to build the reference expression matrix in order to exclude any sample that could potentially carry a cis-regulatory genomic aberration, as indicated by allelic biased expression. Samples with known genomic aberrations capable of dysregulating expression of the given gene were also excluded. We further applied one round of LOO test for each gene to remove cases with bi-allelic outlier expression, which could result from trans-activation. We required a minimum of 10 cases to build the reference expression matrix for each gene. For genes that could not meet the criteria, the expression value from the cohort as a whole was used. A null distribution of t-statistic from LOO test was established and used to estimate the false discovery rate in OHE analysis. Gene with FDR<0.05 was considered OHE. Genes with both aberrant ASE and significant OHE signature with FPKM greater than a user-specified threshold (FPKM>5 was used in the T-ALL analysis presented in this study) were considered as cis-activated candidates. Potential oncogenes presented in the COSMIC database51 were nominated if they showed |BAFDNA - BAFRNA|≥0.4 for over 90% of markers inside the gene and significant OHE with FPKM≥1.
Transcription factor binding site (TFBS) analysis for somatic SNV/Indels. The mutations were evaluated for potential regulatory function with a combined approach that takes into account p value of motif prediction, expression level of the transcription factor in the tumor sample and absence of prediction in the reference genome. First, sequences were extracted from human genome with twoBitToFa (http://genome.ucsc.edu) and TF motif analysis was carried out with the FIMO52 package, with a p-value threshold of 10−3. A total of 614 human TF binding motifs from the HOCOMOCO53 database were included in this analysis. Only mutations that could introduce a transcription factor binding motif that was absent from the reference sequence were kept for downstream analysis. We further require the predicted transcription factors were highly expressed (FPKM>10) in the individual tumor. The combined approach enables the detection of well-document non-coding regulatory variants which can be missed by using a stringent p value cutoff alone. For example, in T-ALL analysis presented in this study, the known validated TAL1 super enhancer mutation which introduces a MYB binding motif9 would have been missed if standard false discovery rate were applied as the FDR of motif prediction was 0.236. Experimental validation of the predicted TF binding motif using an in vivo model may be required for further investigation.
Predict potential regulatory variants for cis-activated candidate genes. The somatic variants were assigned to dysregulated genes in the same topologically associating domains19 (TAD) defined by human ES cell (H1) Hi-C data as the default. This is because the TAD boundaries are relatively stable across different tissue types and independent of gene transcription status47; and the cellular linage of H1 is a good model for representing reactivation of proto-oncogenes normally expressed only in embryo development. Alternatively, TAD structure generated from a matching cellular context could be provided by user. For sequence mutations, we limited the distance between mutation and the promoter (−2kb to 200bp of the RefSeq transcription start site)15 of the potential cis-activated candidate to 200kb, mimicking the median length of contact domains in the human genome54. The candidate sequence mutations were further annotated with the DNaseI-accessible regulatory regions defined by the Roadmap Epigenomics Project49. In addition, user provided functional genomics data such as ChIP-seq or ATAC-seq generated from samples with matching tissue and variant context can be incorporated for annotation. In situations where multiple variants were present in the same regulatory neighborhood of cis-activated gene, gross alterations (e.g. SVs or CNAs) were rated as having higher impact than sequence mutations due to their potential for causing enhancer hijacking.
Cis-X was developed under Perl version 5.10.1, java version 1.8.0 and R version 3.1.0.
Simulation of allelic specific expression
A simulation was carried out to emulate the performance of cis-X in identifying the ASE in regions with different ploidy. Variables that could affect ASE detection were included in this simulation, which included: Copy number (CN) alterations. Both diploid regions and CNA regions with 1 or 2 copy gains were simulated; Coverage for each marker in RNA-seq. A variety of coverages were tested, ranging from 10 to 500, to represent different level of gene expression. On the other hand, a DNA coverage equal to 30 was used as constant in this analysis for diploid regions. DNA coverage will increase along with the copy number gains, with 45 when CN equals 3 and 60 for CN equals 4; The number of heterozygous markers within a single gene ranging from 1 to 20; Imbalance transcription ratio between alleles. An imbalance ratio of 1:1 was used to represent the balanced transcription for estimation of the false positive rate, while a complete allelic specific expression was represented with a ratio of 10000:1. Meanwhile, a set of different allelic imbalance ratio in between were tested, including 2:1, 3:1, 4:1, 5:1, 10:1 and 100:1. A number of 2,000 simulations were carried out for each combination. Random sampling was performed for the alleles with different probabilities controlled by allelic imbalance ratio. The imbalance between DNA and RNA was tested with the convoluted balanced transcription model as described above.
Patients and samples
Tumor and paired remission samples were collected from a total of 13 T-ALL patients diagnosed as T-ALL from Shanghai Children’s Medical Center (SCMC). The study was approved by the SCMC Institutional Review Boards (IRB). Informed consent was obtained from parents for all patients.
Whole genome sequencing and analysis
DNA were extracted with QIAamp DNA Blood Mini Kit (Qiagen, Hilden, Germany, cat. 51106) according to the manufacturer’s instructions and quantified by agarose gel electrophoresis and Qubit ds DNA BR Assay Kit (Life Technologies, Carlsbad, CA, Cat. No. Q32850). 1μg genomic DNA (OD260/280 ratio ranging from 1.8 to 2.0) was diluted with 1× low TE buffer to a total volume of 50μl and fragmented by sonication on the CovarisS2 (Covaris, Woburn, MA). Fragmented DNA was repaired, ligated with Illumina adapters, and size selected, aiming for a 250–300bp product. The size-selected DNA library was then PCR amplified for 15 cycles and validated using the Agilent 2100 Bioanalyzer (Agilent Technologies, Palo Alto, CA, USA). The library was sequenced on Illumina HiSeq X-Ten sequencer following Illumina provided protocols for 2×150 paired-end sequencing.
WGS data were mapped to reference human genome assembly GRCh37-lite with bwa55. Somatic variants in each tumor were analyzed by Bambino56 (SNV/Indel), CONSERTING57 (in both paired and tumor-only mode for somatic and germline CNA) and CREST58 (SV). The SVs discovered in the neuroblastoma cell lines were further filtered against the DGV database59 with AnnotSV60, as well as a local germline rearrangements database constructed from analyzing WGS data in the PCGP project to remove common structural variants in human genome. The detected somatic aberrations were manually curated to further rule out false discoveries.
Transcriptome sequencing (RNA-seq) and analysis
RNA purification, reverse transcription, library construction and sequencing were performed at WuXi NextCODE at Shanghai according to the manufacturer’s instructions (Illumina). The rRNA-depleted sequencing libraries from total RNA were prepared using Illumina TruSeq® Stranded Total RNA Gold Library Preparation Kit following the vendor recommendations. Approximately 1ug of total RNA was used as input material, and the Ribo-Zero Gold kit was used to remove both cytoplasmic and mitochondrial rRNA. Sequencing was performed using a HiSeq 2500 following the 2×125 paired-end sequencing protocol.
RNA-seq data were mapped with StrongArm (Michael Rusch, Michael Edmonson, Wen Ji, Tim Shaw, John Easton, et al, manuscript in preparation), as previously described61. Gene-level read count was generated with HTseq-count62, and the number of fragments per kilobase of transcript per million mapped reads (FPKM) was calculated on the basis of the transcript models in GENCODE v19. Cluster analysis was carried out with Ward’s minimum variance method with the same list of genes as used in previous study21.
Patient derived xenograft (PDX)
The mononuclear cells (MNCs) isolated from the patient BM samples were engrafted into 5 irradiated NOG mice (3–4 week-old female mice, Beijing Vital River Laboratory Animal Technology Co., Ltd., Beijing, China) via intravenous (i.v.) injection. Weekly monitoring of peripheral appearance of leukemic cells (CD45+) was performed via flow cytometry analysis with retro-orbital bleeding. Mice were housed in animal facility with 12h/12h dark cycle, 20–26°C temperature, and 40–70% humidity. Experiments were conducted under sterile conditions at Crown Bioscience SPF facility, and performed strictly under the Guide for the Care and Use of Laboratory Animals of the National Institutes of Health. The protocol was approved by the Committee on the Ethics of Animal Experiments of Crown Bioscience (Crown Bioscience IACUC Committee).
ChIP-seq and analysis
ChIP and input DNA libraries were performed as previously described63. Briefly, cells were cross-linked with 1% formaldehyde for 10min at room temperature and formaldehyde was then inactivated by the addition of 125mM glycine for 5min. Sonicated DNA fragments with 100–300bp were pre-cleared and immunoprecipitated with Protein A+G Magnetic beads coupled with Anti-H3K27Ac antibody (ab4729, Abcam) or Anti-YY1 antibody (#61779, active motif). 5μg antibody per 1ml volume reaction was added for both antibodies. After reverse crosslinking, immunoprecipitated DNAs and input DNAs were end-repaired and ligated adapters to the DNA fragments using NEBNext Ultra End-Repair/dA-Tailing Module (E7442, NEB) and NEBNext Ultra Ligation Module (E7445, NEB). High-throughput sequencing of the ChIP fragments was performed using Illumina NextSeq 500 following the manufacturer’s protocols.
Analysis was carried out with ChIP-seq analysis pipeline on St. Jude Cloud (https://platform.stjude.cloud/tools/chip-seq). Briefly, the reads were aligned to the human genome (GRCh37-lite) with bwa55 (v0.7.12), then ambiguously-mapped and duplicate reads were removed. Fragment length was estimated based on a cross-correlation plot generated by SPP64 (v1.10.1). MACS65 (v2.1.1) was used to call the peaks. The results were filtered against known false positive peaks using the ENCODE black list66.
Visualization of ChIP-seq and ChIA-PET data on GenomePaint
Results from ChIP-seq experiments and the interactions from ChIA-PET data were visualized on GenomePaint (https://proteinpaint.stjude.org/genomepaint, Xin Zhou, Jian Wang, Jaimin Patel, Marc Valentine, Ying Shao, et al, manuscript in preparation). Interactions from ChIA-PET data generated from previous study4 were used. Wiggle files for the following ChIP-seq data were downloaded from GEO (https://www.ncbi.nlm.nih.gov/geo/): CTCF in Jurkat cell (GSM1689152), H3K27Ac for CD3 primary cells (GSM1058764), Native CD4+ T cells (GSM772835), CD8 primary cells (GSM1102781), LOUCY (GSM2037788) and KOPT-K1 (GSM2318734). Wiggle files were transformed into bigwig format with wigToBigWig from UCSC genome browser.
Analysis of neuroblastoma cell lines and patient samples by cis-X
Reference expression matrix was constructed from 123 TARGET neuroblastoma RNA-seq samples18,32, following the same process as described above. WGS and RNA-seq data from four neuroblastoma cell lines, GIMEN, NB16, NB1643 and KELLY, were analyzed with cis-X as described above. For patient samples, we used somatic SVs identified in 90 pediatric neuroblastoma samples with paired tumor-normal WGS and tumor RNA-seq data in TARGET project18 as the input for cis-X. The curated somatic SNVs, indels, SVs and CNVs and the germline SNPs characterized in our prior pan-cancer analysis18 were analyzed for candidate noncoding driver variants.
Analysis of adult melanoma by cis-X
A total of 38 adult melanoma cases with paired tumor-normal WGS and tumor RNA-seq data generated in TCGA project67 were analyzed. Raw data were downloaded from GDC (https://portal.gdc.cancer.gov/legacy-archive/search/f). For RNA-seq, the fastq files were mapped to GRCh37-lite as described above. For WGS data, the downloaded aligned BAM files were firstly transformed to fastq with bedtools68 (v2.25.0) and processed as described above. Epigenetic dataset included five ATAC-seq data from five melanoma cell lines and twelve H3K27Ac ChIP-seq data from nine melanoma and two normal human melanocyte cell lines39,41,69,70. The ChIP-seq data were processed as described above. ATAC-seq data were mapped to GRCh37-lite with bwa55 (v0.7.15). Ambiguously-mapped and duplicated reads were removed subsequently with Picard (v2.6.0, http://broadinstitute.github.io/picard). Aligned reads were transformed to bedpe format with bedtools68 (v2.25.0) and only nucleosome-free fragments (fragment length<109) were kept for peak calling using MACS265 (v 2.1.1), with default parameters. The resulting peaks from ChIP-seq and ATAC-seq of melanoma cell lines were combined for annotating the cis-activated candidates detected by cis-X. Candidate variants were manually curated to remove false positives. Variants with hard-to-define target genes were excluded, such as SVs involved in chromothripsis with many-to-many mapping of SVs and target genes. SNVs with UV-like signature (i.e. cosmic signature 7) were identified and labeled accordingly.
Cell culture
Jurkat cell were cultured in suspension system at 37oC/5%CO2 for in complete RPMI media, containing 10%FBS, 2mM Glutamine, 100U/ml Penicillin, and 100μg/ml Streptomycin. Mycoplasma contamination was tested negative.
Luciferase assay
DNA fragments were synthesized from IDT (Integrated DNA Technologies) and loaded into the pGL3-Promoter Vector (Promega, E1761). 1×10⁶ Jurkat cells were resuspended in 100μl of nucleofector solution mixture (Lonza, Amaxa cell line nucleofector kit V), then 1.5μg of each reporter vector and 0.5μg of pRL-TK Renilla control luciferase reporter vector (Promega) were added. Cells with reporter plasmid DNA were electroporated into Jurkat cells using program X-005 on Lonza Nucleofector 2b (Lonza) and resuspended in 2ml of RPMI medium supplemented with 10% FCS and penicillin-streptomycin. After being incubated at 37°C/5%CO2 for 48 hours, cells were collected by centrifugation and luciferase activities were measured using the Dual-Luciferase Reporter Assay system (Promega, E1960). For each putative enhancer, experiments were performed in triplicates and replicated independently for 3 or 2 times (Supplementary Note). Cell numbers and transfection efficiency were normalized to Renilla luciferase activity.
Statistics and reproducibility
Statistical difference between mutant and reference sequences in luciferase assay was performed by two-sided t-test. Each experiment was replicated by at least two independent experiments. Overrepresentation of mutant allele than reference allele in H3K27Ac and YY1 ChIP-seq data was performed with two-sided binomial test. Analysis were performed with Prism version 8.0 and R version 3.1.0.
Reporting Summary
Further information on research design is available in the Life Sciences Reporting Summary linked to this article.
Extended Data
Extended Data Fig. 1. Transcription imbalance modeling.
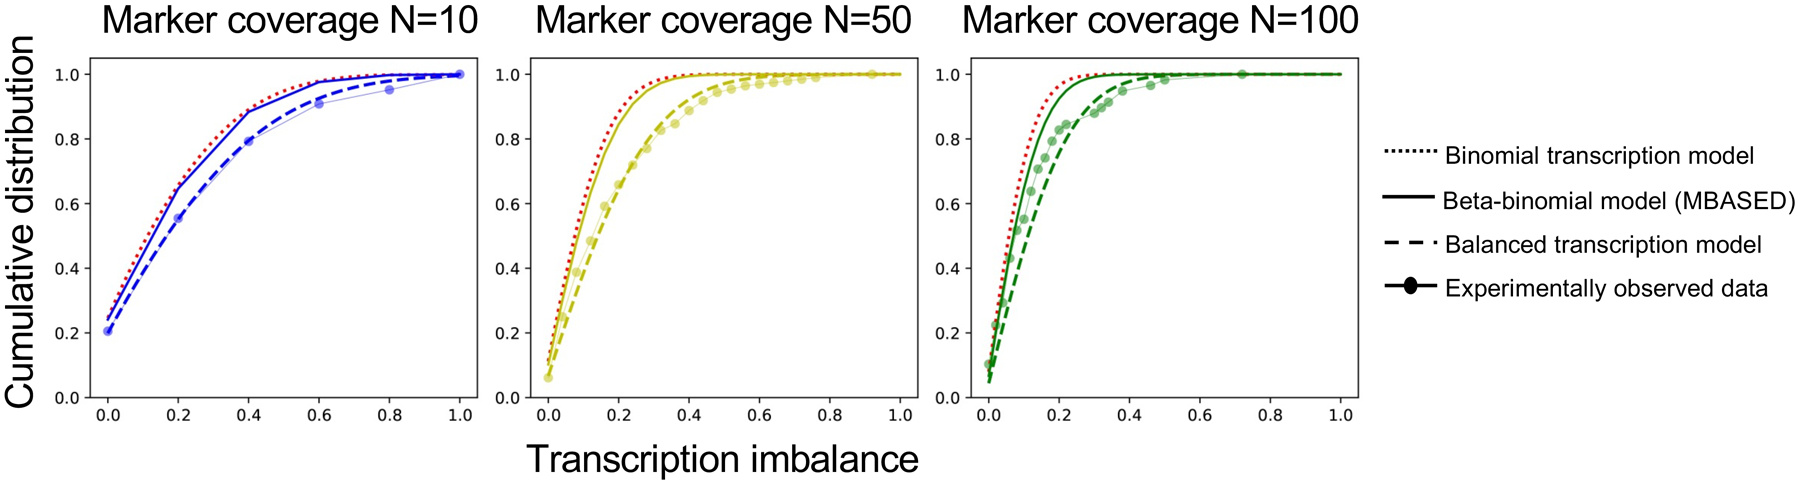
Cumulative distribution of transcription imbalance under binomial transcription model (dotted line), beta-binomial model as implemented in MBASED (solid line), balanced transcription model (dashed line) and experimentally observed data (dots). Different RNA-seq coverages (N=10, 50 and 100) are shown separately.
Extended Data Fig. 2. Simulation analysis of allele-specific expression detection in cis-X.
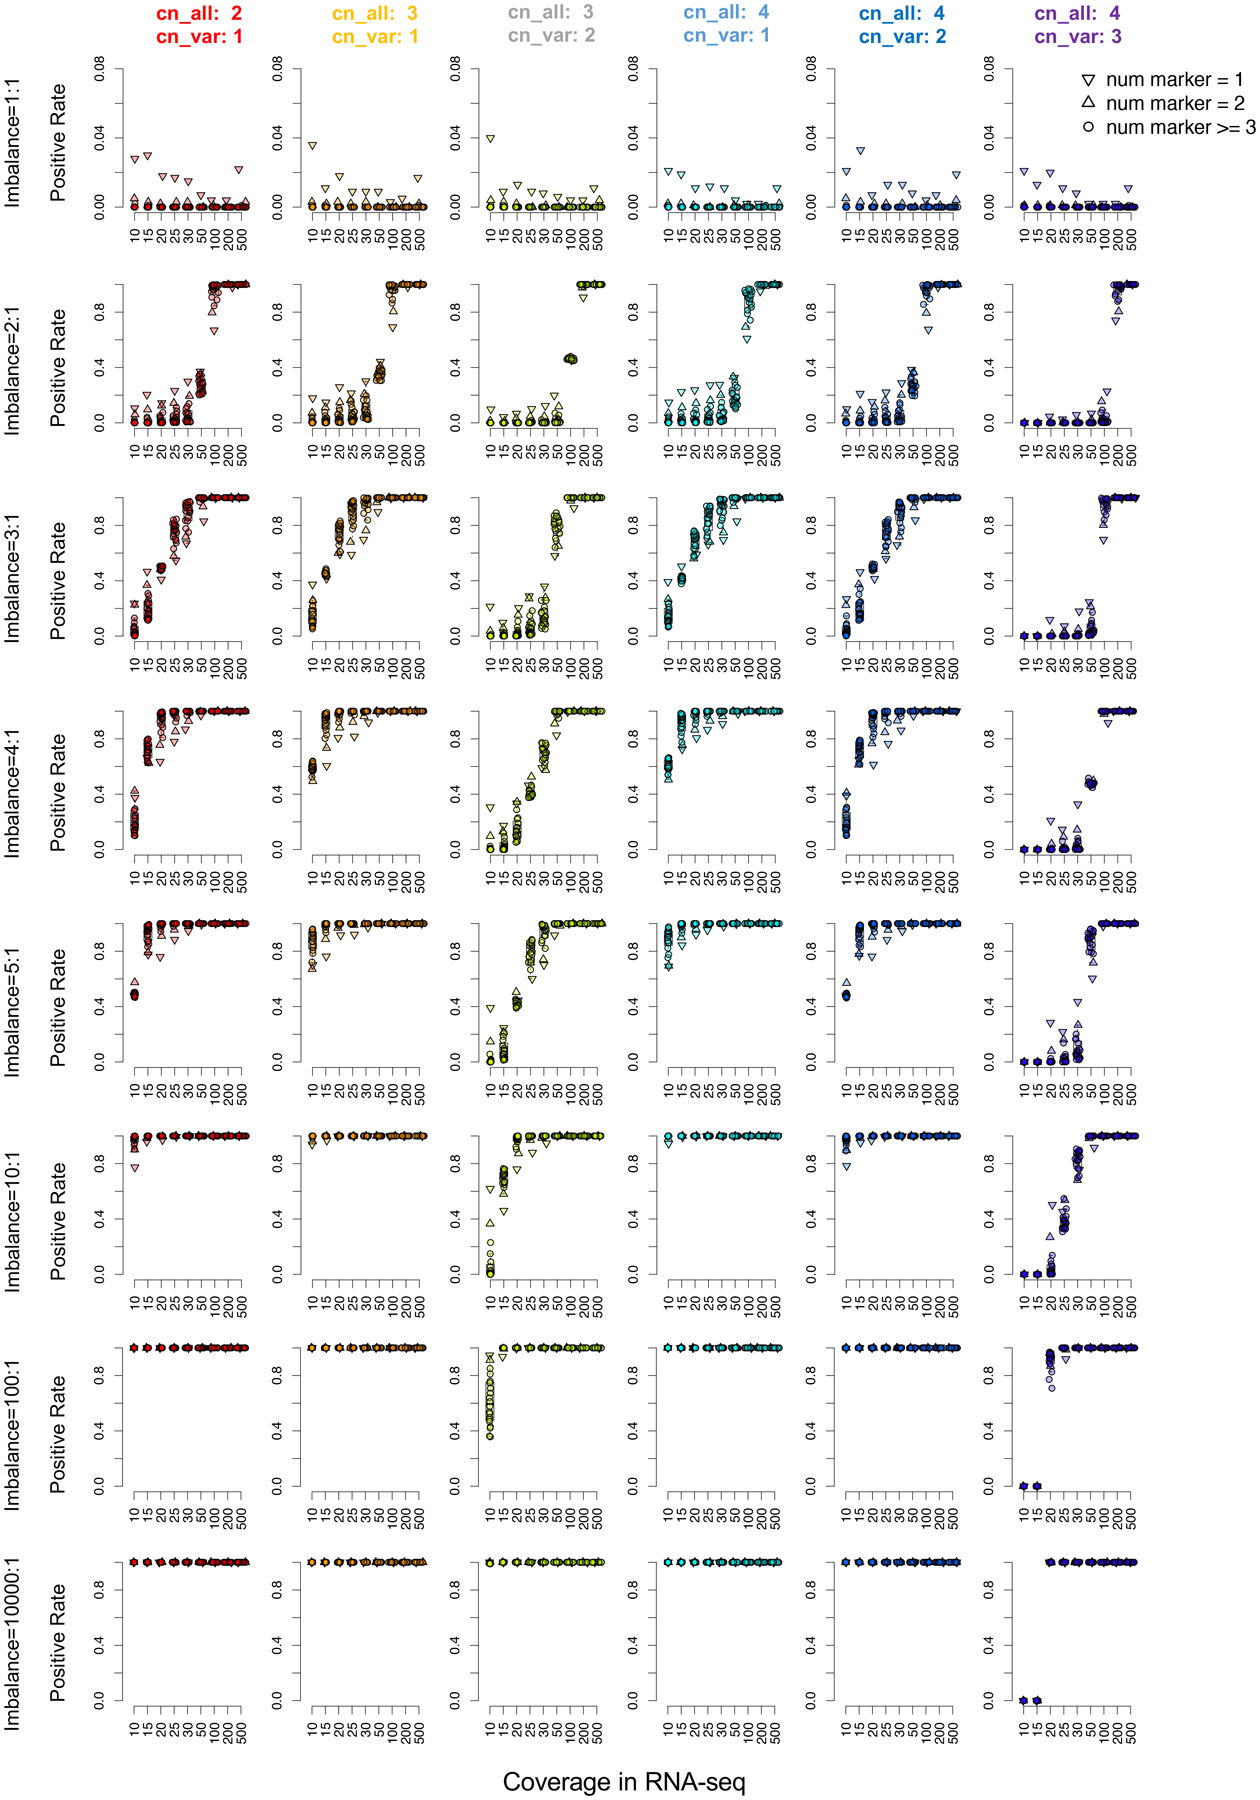
Each panel represents a simulation of allelic imbalance ranging from 1:1 (no allele-specific expression) to 10000:1 (complete mono-allelic expression). Percentage of simulations identified as allele-specific expression from a group of 2,000 simulations are shown on y-axis, with plots on each panel representing simulation results with different imbalanced transcription ratio between two alleles. The imbalanced ratio of 1:1 represents the false positive rate was showed on the top, while plots in the other lines represent false negative rates of detecting transcription imbalance at various allelic ratio. Coverage for the markers in RNA-seq is shown on the x-axis. Each column, labeled by a distinct color, represents a distinct ploidy group (i.e. copy number alterations), while shape of each plot represents the number of markers within a gene for assessing allele-specific expression.
Extended Data Fig. 3. Workflow for constructing the gene-specific reference expression matrix.

Workflow for constructing the gene-specific reference expression matrix.
Extended Data Fig. 4. LMO3 activation in T-ALL.

(a) Allele specific expression of LMO3 in T-ALL SJTALL013797_D1. Eight heterozygous variants are present in LMO3 locus in this tumor, with the B-allele fractions from WGS and RNA-seq plotted on the top of the wiggle plot. (b) Outlier high expression of LMO3 was observed in this sample compared to the NCI TARGET T-ALL cohort (n=264 samples). (c) Gene expression based clustering of the combined cohort of 13 SCMC T-ALLs and 264 NCI TARGET T-ALLs showed that SJTALL013797_D1 is clustered with other T-ALLs driven by TAL/LMO activation. The same genes from the previous study (Liu et al. Nature Genetics, 2017) were used in clustering the combined cohort. Colors on the top track represent different T-ALL subtypes.
Extended Data Fig. 5. Somatically acquired noncoding mutation activating TAL1 in T-ALL sample SJALL018373.
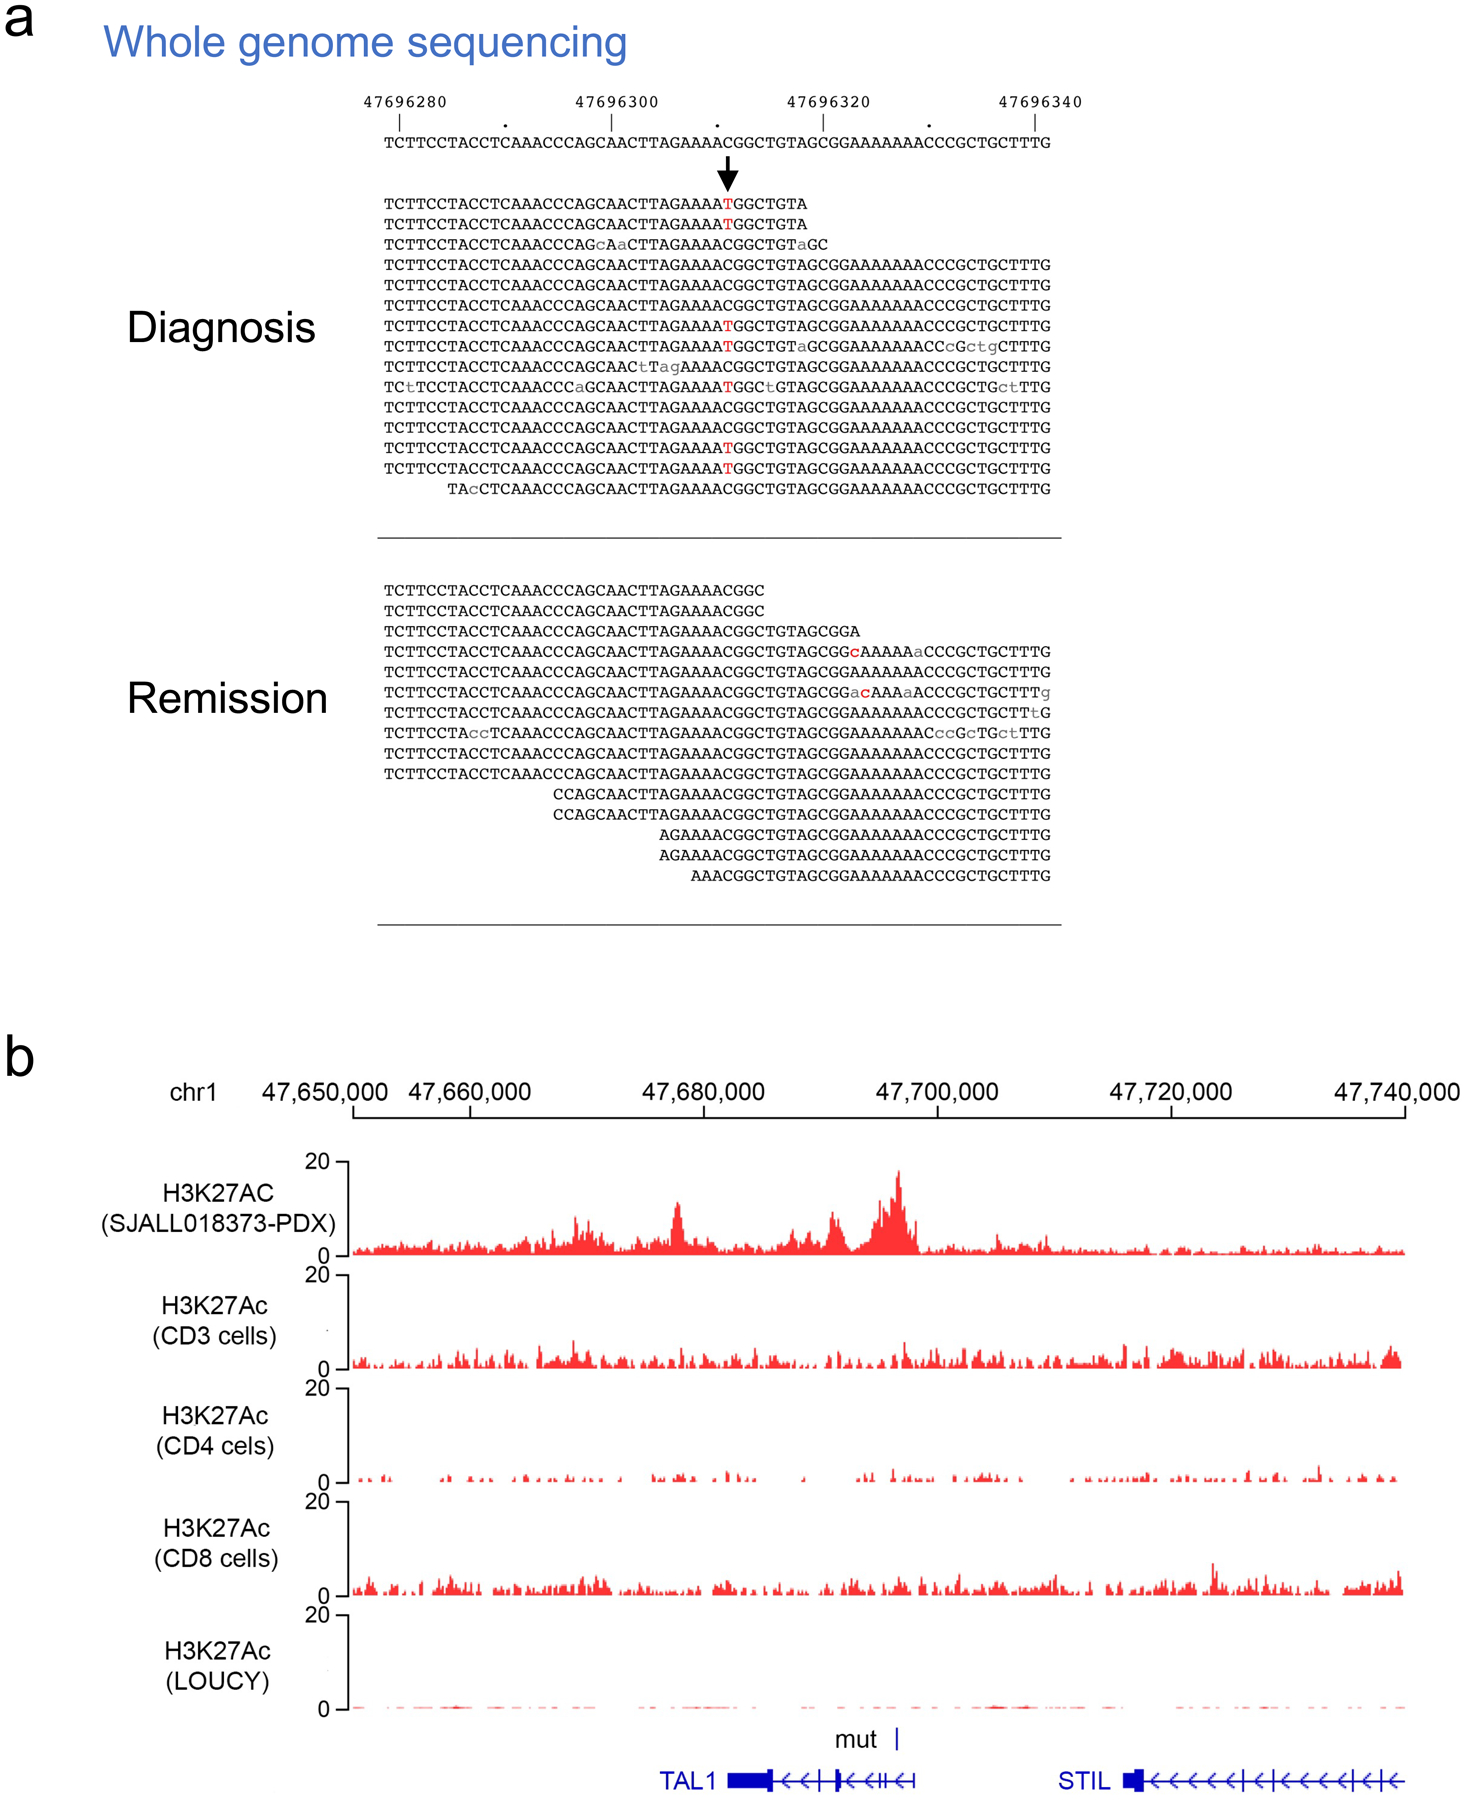
(a) The heterozygous C to T mutation (indicated by arrow, with mutant allele T shown in red) was only present in the tumor DNA but not in the remission sample from whole genome sequencing data. (b) H3K27Ac profile from ChIP-seq at TAL1 locus. The active enhancer present in the mutation positive PDX sample (as shown in Figure 3d) was absent from normal T cells (CD3, CD4 and CD8) or from the T-ALL cell line (LOUCY) with no TAL1 expression.
Extended Data Fig. 6. Activating deletion upstream PRLR.

Expression (FPKM on y-axis) of SPEF2 (a) and IL7R (b) in the T-ALLs. The 3 tumors carrying the focal deletions (SJALL043558_D1, PATFYZ, and PATRUN) are labeled. (c) H3K27Ac profiles from ChIP-seq show active enhancer upstream of IL7R in the PDX (derived from patient SJALL018373) and a T-ALL cell line (KOPT-K1) having high IL7R transcription; both samples have the wild-type allele at this locus.
Extended Data Fig. 7. Analysis of pediatric neuroblastoma with cis-X.

(a) Copy number variations identified in the four neuroblastoma cell lines. The blue and red colors represent the deletion and amplifications, respectively, identified in these cell lines. (b) Circos plot showing the cis-activating structural rearrangements identified in NBL cell lines by cis-X. The copy number alterations in each genome are shown in the inner track, with blue lines representing a copy number of 1 and red a copy number of three. The cis-activating structural variants are shown as links in the middle of the plot, with purple links representing inter-chromosome translocations and green for intra-chromosome translocations. The target genes activated by these rearrangements are labeled on the outer track of each plot.
Extended Data Fig. 8. TERT cis-activation by somatic non-coding variants in neuroblastoma.

The analysis was based on 90 NBL primary tumor samples with matching RNA-seq and WGS from TARGET, 42 of which had positive immune cell infiltration signature based on prior analysis (Ma et al, Nature, 2018). (a) Samples with somatic copy number alterations (CNA, marked by red or blue blocks) or/and structural variations (SVs, marked by circles) at TERT locus. All except for one (PARAMT, marked #) were detected by cis-X as cis-activated candidates. Samples marked with * have immune cell infiltration signature. Samples highlighted in gray are used to illustrate allele-specific expression (ASE) below. (b) Examples of ASE detected in neuroblastoma with or without infiltrating immune cells. Variant allele fraction in DNA (by WGS) and RNA (by RNA-seq) of SNPs, depicted as bar graph, demonstrates that ASE analysis is not affected by the presence of immune cell infiltration signature in tumor samples.
Extended Data Fig. 9. TERT expression in melanoma and neuroblastoma.
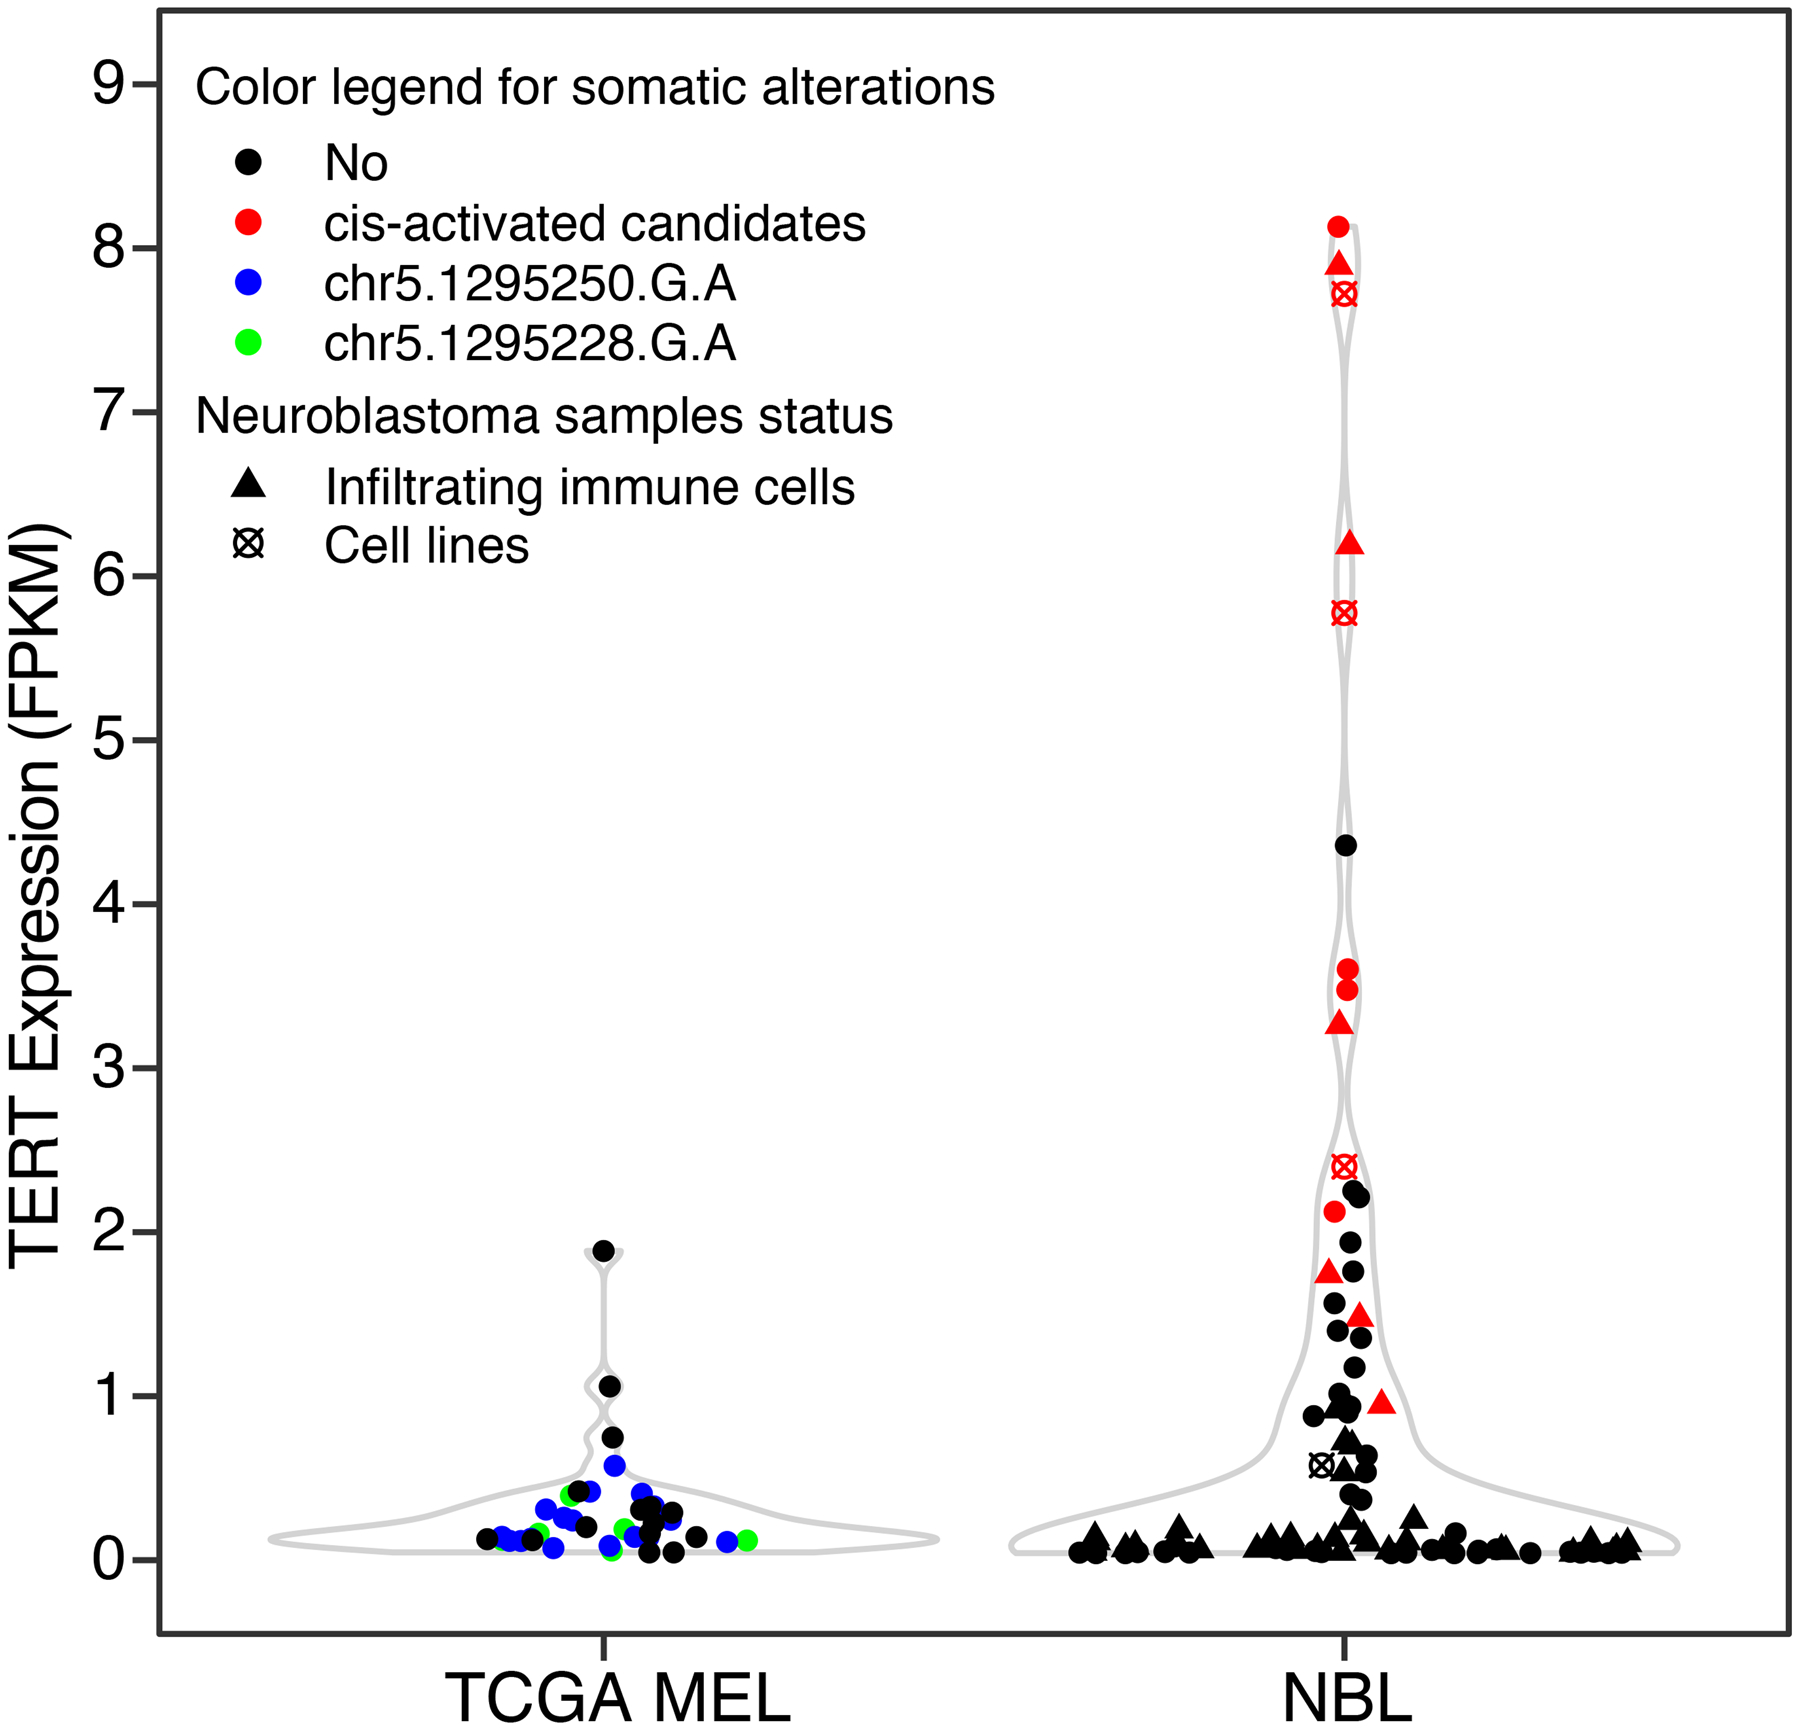
TERT expression in adult TCGA melanoma (MEL) samples (n=38), pediatric neuroblastoma (NBL) patient samples from TARGET project (n=90) and cell lines (n=4) analyzed in this study. The MEL samples were color-coded by TERT promoter mutation status while the NBL samples were marked by the status of cis-activation, infiltrating immune cells and cell-lines as depicted in figure legend.
Supplementary Material
Acknowledgements
This work was funded in part by the NIH grants 1R35 CA210064-01 (A.T.L.). 1R01CA216391-01A1 (J. Z.) and the Cancer Center Support Grant P30CA021765 from National Cancer Institute and the American Lebanese Syrian Associated Charities of St. Jude Children’s Research Hospital. We thank Drs. B. Abraham, M. Zimmerman, A. Durbin. D. Wheeler and D. Flasch for critical review of the manuscript, and Dr. C. Sherr for providing the literature relevant for p16 activation.
Footnotes
Data availability
Whole genome sequencing and RNA-seq data for the SCMC cohort analyzed in this study can be accessed from Genome Sequence Archive for Human under National Genomics Data Center of China (http://bigd.big.ac.cn/gsa-human), with accession number HRA000097 [https://bigd.big.ac.cn/gsa-human/browse/HRA000097] and HRA000096 [https://bigd.big.ac.cn/gsa-human/browse/HRA000096] for WGS and RNA-seq respectively. The data are publicly available to users following standard access application process for human genomic and associated phenotypic data. ChIP-seq data generated in this study can be accessed from GEO under accession number GSE113565 [https://www.ncbi.nlm.nih.gov/geo/query/acc.cgi?acc=GSE113565] and GSE145549 [https://www.ncbi.nlm.nih.gov/geo/query/acc.cgi?acc=GSE145549], for H3K27Ac and YY1 respectively, with the called peaks (in bed format) available upon request. WES and RNA-seq data for TARGET T-ALL and NBL cohort have been deposited in the database of genotypes and phenotypes (dbGaP; http://www.ncbi.nlm.nih.gov/gap) in previous projects under accession numbers phs000464 [https://www.ncbi.nlm.nih.gov/projects/gap/cgi-bin/study.cgi?study_id=phs000464.v19.p8] and phs000467 [https://www.ncbi.nlm.nih.gov/projects/gap/cgi-bin/study.cgi?study_id=phs000467.v19.p8], respectively. The WGS and RNA-seq data for TCGA melanoma were downloaded from GDC (https://portal.gdc.cancer.gov/legacy-archive/search/f). The complete list of somatic variant calls for the 13 T-ALLs used as input of cis-X analysis presented in the manuscript can be accessed from our research lab page at http://www.stjuderesearch.org/site/lab/zhang/cis-x.
Code availability
The cis-X package, together with detailed instructions and demo data, is available at https://www.stjuderesearch.org/site/lab/zhang/cis-x, https://platform.stjude.cloud/workflows/cis-x and https://github.com/stjude/cis-x. In addition to the source code, we also provide a Docker file along with the package to run cis-X in a container via Docker, to minimize the difficulty of running cis-X on different computing platforms.
Competing interests
The authors declare no competing interests.
References
- 1.Encode Project Consortium. An integrated encyclopedia of DNA elements in the human genome. Nature 489, 57–74 (2012). [DOI] [PMC free article] [PubMed] [Google Scholar]
- 2.Maurano MT et al. Systematic localization of common disease-associated variation in regulatory DNA. Science 337, 1190–5 (2012). [DOI] [PMC free article] [PubMed] [Google Scholar]
- 3.Khurana E et al. Role of non-coding sequence variants in cancer. Nat Rev Genet 17, 93–108 (2016). [DOI] [PubMed] [Google Scholar]
- 4.Hnisz D et al. Activation of proto-oncogenes by disruption of chromosome neighborhoods. Science 351, 1454–8 (2016). [DOI] [PMC free article] [PubMed] [Google Scholar]
- 5.Weischenfeldt J et al. Pan-cancer analysis of somatic copy-number alterations implicates IRS4 and IGF2 in enhancer hijacking. Nat Genet (2016). [DOI] [PMC free article] [PubMed] [Google Scholar]
- 6.Northcott PA et al. Enhancer hijacking activates GFI1 family oncogenes in medulloblastoma. Nature 511, 428–34 (2014). [DOI] [PMC free article] [PubMed] [Google Scholar]
- 7.Zhang J et al. Deregulation of DUX4 and ERG in acute lymphoblastic leukemia. Nat Genet 48, 1481–1489 (2016). [DOI] [PMC free article] [PubMed] [Google Scholar]
- 8.Zhang X et al. Identification of focally amplified lineage-specific super-enhancers in human epithelial cancers. Nat Genet 48, 176–82 (2016). [DOI] [PMC free article] [PubMed] [Google Scholar]
- 9.Mansour MR et al. Oncogene regulation. An oncogenic super-enhancer formed through somatic mutation of a noncoding intergenic element. Science 346, 1373–7 (2014). [DOI] [PMC free article] [PubMed] [Google Scholar]
- 10.Huang FW et al. Highly recurrent TERT promoter mutations in human melanoma. Science 339, 957–9 (2013). [DOI] [PMC free article] [PubMed] [Google Scholar]
- 11.Horn S et al. TERT promoter mutations in familial and sporadic melanoma. Science 339, 959–61 (2013). [DOI] [PubMed] [Google Scholar]
- 12.Rheinbay E et al. Analyses of non-coding somatic drivers in 2,658 cancer whole genomes. Nature 578, 102–111 (2020). [DOI] [PMC free article] [PubMed] [Google Scholar]
- 13.Nik-Zainal S et al. Landscape of somatic mutations in 560 breast cancer whole-genome sequences. Nature 534, 47–54 (2016). [DOI] [PMC free article] [PubMed] [Google Scholar]
- 14.Fredriksson NJ, Ny L, Nilsson JA & Larsson E Systematic analysis of noncoding somatic mutations and gene expression alterations across 14 tumor types. Nat Genet 46, 1258–63 (2014). [DOI] [PubMed] [Google Scholar]
- 15.Weinhold N, Jacobsen A, Schultz N, Sander C & Lee W Genome-wide analysis of noncoding regulatory mutations in cancer. Nat Genet 46, 1160–5 (2014). [DOI] [PMC free article] [PubMed] [Google Scholar]
- 16.Melton C, Reuter JA, Spacek DV & Snyder M Recurrent somatic mutations in regulatory regions of human cancer genomes. Nat Genet 47, 710–6 (2015). [DOI] [PMC free article] [PubMed] [Google Scholar]
- 17.Kim K et al. Chromatin structure-based prediction of recurrent noncoding mutations in cancer. Nat Genet 48, 1321–1326 (2016). [DOI] [PubMed] [Google Scholar]
- 18.Ma X et al. Pan-cancer genome and transcriptome analyses of 1,699 paediatric leukaemias and solid tumours. Nature 555, 371–376 (2018). [DOI] [PMC free article] [PubMed] [Google Scholar]
- 19.Dixon JR et al. Topological domains in mammalian genomes identified by analysis of chromatin interactions. Nature 485, 376–80 (2012). [DOI] [PMC free article] [PubMed] [Google Scholar]
- 20.Belver L & Ferrando A The genetics and mechanisms of T cell acute lymphoblastic leukaemia. Nat Rev Cancer 16, 494–507 (2016). [DOI] [PubMed] [Google Scholar]
- 21.Liu Y et al. The genomic landscape of pediatric and young adult T-lineage acute lymphoblastic leukemia. Nat Genet 49, 1211–1218 (2017). [DOI] [PMC free article] [PubMed] [Google Scholar]
- 22.Li Z et al. APOBEC signature mutation generates an oncogenic enhancer that drives LMO1 expression in T-ALL. Leukemia (2017). [DOI] [PMC free article] [PubMed] [Google Scholar]
- 23.Hu S et al. Whole-genome noncoding sequence analysis in T-cell acute lymphoblastic leukemia identifies oncogene enhancer mutations. Blood 129, 3264–3268 (2017). [DOI] [PMC free article] [PubMed] [Google Scholar]
- 24.Abraham BJ et al. Small genomic insertions form enhancers that misregulate oncogenes. Nat Commun 8, 14385 (2017). [DOI] [PMC free article] [PubMed] [Google Scholar]
- 25.Rahman S et al. Activation of the LMO2 oncogene through a somatically acquired neomorphic promoter in T-cell acute lymphoblastic leukemia. Blood (2017). [DOI] [PMC free article] [PubMed] [Google Scholar]
- 26.Mayba O et al. MBASED: allele-specific expression detection in cancer tissues and cell lines. Genome Biol 15, 405 (2014). [DOI] [PMC free article] [PubMed] [Google Scholar]
- 27.Pawlikowska I et al. The most informative spacing test effectively discovers biologically relevant outliers or multiple modes in expression. Bioinformatics 30, 1400–8 (2014). [DOI] [PMC free article] [PubMed] [Google Scholar]
- 28.Simonis M et al. High-resolution identification of balanced and complex chromosomal rearrangements by 4C technology. Nat Methods 6, 837–42 (2009). [DOI] [PubMed] [Google Scholar]
- 29.Weintraub AS et al. YY1 Is a Structural Regulator of Enhancer-Promoter Loops. Cell 171, 1573–1588 e28 (2017). [DOI] [PMC free article] [PubMed] [Google Scholar]
- 30.Ali S & Ali S Prolactin receptor regulates Stat5 tyrosine phosphorylation and nuclear translocation by two separate pathways. J Biol Chem 273, 7709–16 (1998). [DOI] [PubMed] [Google Scholar]
- 31.Goffin V Prolactin receptor targeting in breast and prostate cancers: New insights into an old challenge. Pharmacol Ther 179, 111–126 (2017). [DOI] [PubMed] [Google Scholar]
- 32.Pugh TJ et al. The genetic landscape of high-risk neuroblastoma. Nat Genet 45, 279–84 (2013). [DOI] [PMC free article] [PubMed] [Google Scholar]
- 33.Peifer M et al. Telomerase activation by genomic rearrangements in high-risk neuroblastoma. Nature 526, 700–4 (2015). [DOI] [PMC free article] [PubMed] [Google Scholar]
- 34.Valentijn LJ et al. TERT rearrangements are frequent in neuroblastoma and identify aggressive tumors. Nat Genet 47, 1411–4 (2015). [DOI] [PubMed] [Google Scholar]
- 35.Davis CF et al. The somatic genomic landscape of chromophobe renal cell carcinoma. Cancer Cell 26, 319–330 (2014). [DOI] [PMC free article] [PubMed] [Google Scholar]
- 36.Zhang Y et al. High-coverage whole-genome analysis of 1220 cancers reveals hundreds of genes deregulated by rearrangement-mediated cis-regulatory alterations. Nat Commun 11, 736 (2020). [DOI] [PMC free article] [PubMed] [Google Scholar]
- 37.Akbani R et al. Genomic Classification of Cutaneous Melanoma. Cell 161, 1681–1696 (2015). [DOI] [PMC free article] [PubMed] [Google Scholar]
- 38.Strub T et al. SIRT6 haploinsufficiency induces BRAF. Nat Commun 9, 3440 (2018). [DOI] [PMC free article] [PubMed] [Google Scholar]
- 39.Zhou B et al. INO80 governs superenhancer-mediated oncogenic transcription and tumor growth in melanoma. Genes Dev 30, 1440–53 (2016). [DOI] [PMC free article] [PubMed] [Google Scholar]
- 40.Fontanals-Cirera B et al. Harnessing BET Inhibitor Sensitivity Reveals AMIGO2 as a Melanoma Survival Gene. Mol Cell 68, 731–744.e9 (2017). [DOI] [PMC free article] [PubMed] [Google Scholar]
- 41.Kaufman CK et al. A zebrafish melanoma model reveals emergence of neural crest identity during melanoma initiation. Science 351, aad2197 (2016). [DOI] [PMC free article] [PubMed] [Google Scholar]
- 42.Lin AW & Lowe SW Oncogenic ras activates the ARF-p53 pathway to suppress epithelial cell transformation. Proc Natl Acad Sci U S A 98, 5025–30 (2001). [DOI] [PMC free article] [PubMed] [Google Scholar]
- 43.Kamijo T et al. Tumor suppression at the mouse INK4a locus mediated by the alternative reading frame product p19ARF. Cell 91, 649–59 (1997). [DOI] [PubMed] [Google Scholar]
- 44.Zhang Y et al. A cis-element within the ARF locus mediates repression of p16 (INK4A) expression via long-range chromatin interactions. Proc Natl Acad Sci U S A (2019). [DOI] [PMC free article] [PubMed] [Google Scholar]
- 45.Zhang B & Peng Z Defective folding of mutant p16(INK4) proteins encoded by tumor-derived alleles. J Biol Chem 271, 28734–7 (1996). [PubMed] [Google Scholar]
- 46.Walker GJ, Gabrielli BG, Castellano M & Hayward NK Functional reassessment of P16 variants using a transfection-based assay. Int J Cancer 82, 305–12 (1999). [DOI] [PubMed] [Google Scholar]
- 47.Yu M & Ren B The Three-Dimensional Organization of Mammalian Genomes. Annu Rev Cell Dev Biol 33, 265–289 (2017). [DOI] [PMC free article] [PubMed] [Google Scholar]
- 48.Monk M & Holding C Human embryonic genes re-expressed in cancer cells. Oncogene 20, 8085–91 (2001). [DOI] [PubMed] [Google Scholar]
- 49.Roadmap Epigenomics Consortium. et al. Integrative analysis of 111 reference human epigenomes. Nature 518, 317–30 (2015). [DOI] [PMC free article] [PubMed] [Google Scholar]
- 50.Hidalgo M et al. Patient-derived xenograft models: an emerging platform for translational cancer research. Cancer Discov 4, 998–1013 (2014). [DOI] [PMC free article] [PubMed] [Google Scholar]
- 51.Forbes SA et al. COSMIC: somatic cancer genetics at high-resolution. Nucleic Acids Res 45, D777–d783 (2017). [DOI] [PMC free article] [PubMed] [Google Scholar]
- 52.Grant CE, Bailey TL & Noble WS FIMO: scanning for occurrences of a given motif. Bioinformatics 27, 1017–8 (2011). [DOI] [PMC free article] [PubMed] [Google Scholar]
- 53.Kulakovskiy IV et al. HOCOMOCO: expansion and enhancement of the collection of transcription factor binding sites models. Nucleic Acids Res 44, D116–25 (2016). [DOI] [PMC free article] [PubMed] [Google Scholar]
- 54.Rao SS et al. A 3D map of the human genome at kilobase resolution reveals principles of chromatin looping. Cell 159, 1665–80 (2014). [DOI] [PMC free article] [PubMed] [Google Scholar]
- 55.Li H & Durbin R Fast and accurate short read alignment with Burrows-Wheeler transform. Bioinformatics 25, 1754–60 (2009). [DOI] [PMC free article] [PubMed] [Google Scholar]
- 56.Edmonson MN et al. Bambino: a variant detector and alignment viewer for next-generation sequencing data in the SAM/BAM format. Bioinformatics 27, 865–6 (2011). [DOI] [PMC free article] [PubMed] [Google Scholar]
- 57.Chen X et al. CONSERTING: integrating copy-number analysis with structural-variation detection. Nat Methods 12, 527–30 (2015). [DOI] [PMC free article] [PubMed] [Google Scholar]
- 58.Wang J et al. CREST maps somatic structural variation in cancer genomes with base-pair resolution. Nat Methods 8, 652–4 (2011). [DOI] [PMC free article] [PubMed] [Google Scholar]
- 59.MacDonald JR, Ziman R, Yuen RK, Feuk L & Scherer SW The Database of Genomic Variants: a curated collection of structural variation in the human genome. Nucleic Acids Res 42, D986–92 (2014). [DOI] [PMC free article] [PubMed] [Google Scholar]
- 60.Geoffroy V et al. AnnotSV: an integrated tool for structural variations annotation. Bioinformatics 34, 3572–3574 (2018). [DOI] [PubMed] [Google Scholar]
- 61.Parker M et al. C11orf95-RELA fusions drive oncogenic NF-kappaB signalling in ependymoma. Nature 506, 451–5 (2014). [DOI] [PMC free article] [PubMed] [Google Scholar]
- 62.Anders S, Pyl PT & Huber W HTSeq--a Python framework to work with high-throughput sequencing data. Bioinformatics 31, 166–9 (2015). [DOI] [PMC free article] [PubMed] [Google Scholar]
- 63.Zhang XL et al. Integrative epigenomic analysis reveals unique epigenetic signatures involved in unipotency of mouse female germline stem cells. Genome Biol 17, 162 (2016). [DOI] [PMC free article] [PubMed] [Google Scholar]
- 64.Kharchenko PV, Tolstorukov MY & Park PJ Design and analysis of ChIP-seq experiments for DNA-binding proteins. Nat Biotechnol 26, 1351–9 (2008). [DOI] [PMC free article] [PubMed] [Google Scholar]
- 65.Zhang Y et al. Model-based analysis of ChIP-Seq (MACS). Genome Biol 9, R137 (2008). [DOI] [PMC free article] [PubMed] [Google Scholar]
- 66.Cheng Y et al. Principles of regulatory information conservation between mouse and human. Nature 515, 371–375 (2014). [DOI] [PMC free article] [PubMed] [Google Scholar]
- 67.Cancer Genome Atlas N Genomic Classification of Cutaneous Melanoma. Cell 161, 1681–96 (2015). [DOI] [PMC free article] [PubMed] [Google Scholar]
- 68.Quinlan AR & Hall IM BEDTools: a flexible suite of utilities for comparing genomic features. Bioinformatics 26, 841–2 (2010). [DOI] [PMC free article] [PubMed] [Google Scholar]
- 69.Strub T et al. SIRT6 haploinsufficiency induces BRAF(V600E) melanoma cell resistance to MAPK inhibitors via IGF signalling. Nat Commun 9, 3440 (2018). [DOI] [PMC free article] [PubMed] [Google Scholar]
- 70.Fontanals-Cirera B et al. Harnessing BET Inhibitor Sensitivity Reveals AMIGO2 as a Melanoma Survival Gene. Mol Cell 68, 731–744 e9 (2017). [DOI] [PMC free article] [PubMed] [Google Scholar]
Associated Data
This section collects any data citations, data availability statements, or supplementary materials included in this article.