Abstract
Animal models are important tools in diabetes research because ethical and logistical constraints limit access to human tissue. β-Cell dysfunction is a common contributor to the pathogenesis of most types of diabetes. Spontaneous hyperglycemia was developed in a colony of C57BL/6J mice at King’s College London (KCL). Sequencing identified a mutation in the Ins2 gene, causing a glycine-to-serine substitution at position 32 on the B chain of the preproinsulin 2 molecule. Mice with the Ins2+/G32S mutation were named KCL Ins2 G32S (KINGS) mice. The same mutation in humans (rs80356664) causes dominantly inherited neonatal diabetes. Mice were characterized, and β-cell function was investigated. Male mice became overtly diabetic at ∼5 weeks of age, whereas female mice had only slightly elevated nonfasting glycemia. Islets showed decreased insulin content and impaired glucose-induced insulin secretion, which was more severe in males. Transmission electron microscopy and studies of gene and protein expression showed β-cell endoplasmic reticulum (ER) stress in both sexes. Despite this, β-cell numbers were only slightly reduced in older animals. In conclusion, the KINGS mouse is a novel model of a human form of diabetes that may be useful to study β-cell responses to ER stress.
Introduction
Diabetes is a collection of diseases characterized by hyperglycemia that is caused by an absolute or relative insulin deficiency. The cause varies from β-cell developmental defects, to lack of β-cell adaptation to insulin demand, to β-cell destruction and functional decline. In addition to the most common types of diabetes (type 1, type 2, gestational), monogenic forms cause maturity onset of diabetes in the young or neonatal diabetes. The common denominator in most forms of diabetes is the β-cell, and thus, understanding how β-cells can resist or adapt to damage or changing environments is important.
Animal models are a crucial tool in diabetes research because access to human cohorts and/or islets is limited, so animal models are therefore used extensively to understand pathogenic processes and test new therapies (1–3). It is important that a variety of well-defined models are available because the most robust therapeutic interventions will be successful in more than one model.
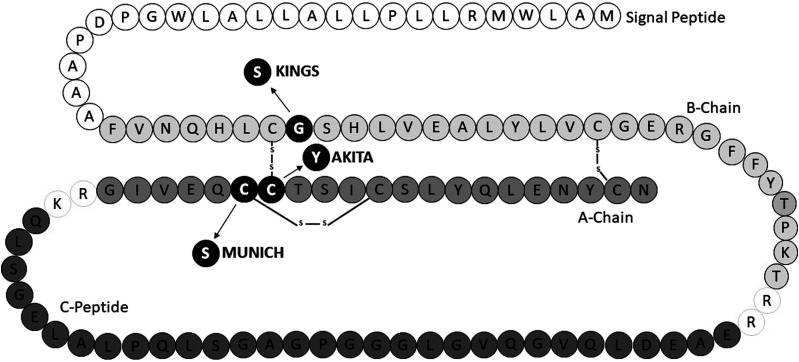
Spontaneous hyperglycemia was discovered within some males of a C57BL/6J mice colony at King’s College London (KCL). Sequencing of the Ins2 gene revealed this to be due to a dominantly inherited single nucleotide polymorphism, resulting in a glycine-to-serine substitution at position 32 on the B chain of preproinsulin 2 (Fig. 1). Mice with the Ins2+/G32S mutation were named the KCL Ins2 G32S (KINGS) mice, and a colony was expanded through conventional breeding. The same mutation in the human insulin gene (rs80356664) causes dominantly inherited neonatal diabetes (4–6), and therefore, the KINGS mouse provides an unique opportunity to undertake mechanistic studies. The aim of this study was to characterize the KINGS mouse, understand the mechanisms leading to hyperglycemia, and validate it as a new model of human diabetes.
Figure 1.
Schematic of rodent preproinsulin 2 molecule with KINGS (G32S), Akita (C96Y), and Munich (C95S) mouse amino acid substitutions shown.
Research Design and Methods
Animals
All in vivo procedures were approved by our institution’s ethics committee and performed under license in accordance with the U.K. Home Office Animals (Scientific Procedures) Act 1986 with 2012 amendments. The KINGS mice (C57BL/6J-Ins2<Kings>; Mouse Genome Informatics [MGI]: 6449740) were discovered in a colony with a C57BL/6J background and maintained on this background. Heterozygous males and females were studied from weaning until 20 weeks of age. In one study, KINGS mice were compared with Ins2+/Akita (Akita) mice, which were obtained from The Jackson Laboratory (stock #003548, MGI: 1857572; Bar Harbor, ME) and maintained on the C57BL/6J background by in-house breeding. All mice were kept in standard laboratory conditions with a 12-h light/dark cycle. They had access to water and standard chow ad libitum, unless otherwise stated. Nesting material, shelters, and tunnels were provided in the cages as enrichment. According to our ethical guidelines, any animal losing 20% body weight was killed.
Genotyping
Ear clips were digested using lysis buffer (10% 10× Gitschier buffer, 0.5% Triton X-100, 1% β-mercaptoethanol, 2% 50 μg/mL proteinase K). The Kompetitive allele-specific PCR (KASP; LGC, Hoddesdon, U.K.) was used to determine genotype. Forward primers with fluorescent tags corresponding to the wild-type Ins2 (GAAGGTGACCAAGTTCATGCTTTTGTCAAGCAGCACCTTTGTG, FAM fluorophore) and KINGS mutant (GAAGGTCGGAGTCAACGGATTGCTTTTGTCAAGCAGCACCTTTGTA, HEX fluorophore), with a common reverse primer for Ins2 (AGAGCCTCCACCAGGTGGGAA), were used. PCR was carried out using a LightCycler 480 (Roche, Basel, Switzerland) to give different fluorescent signals corresponding to wild-type, heterozygous, or homozygous genotypes.
Animal Monitoring
Random morning (9:00 a.m.) blood glucose concentrations and body weights were measured between weaning (3 weeks) and 20 weeks and, for a subset of mice, measured daily between 3 and 6 weeks. Hyperglycemia was defined as blood glucose concentrations >300 mg/dL and normoglycemia as <200 mg/dL. Blood samples were taken using a 30G needle prick to the end of the tail, and glycemia was measured using a glucometer (Performa glucometer and Inform II test strips; Roche, Welwyn Garden City, U.K.). Samples exceeding the meter maximum (600 mg/dL) were reassayed with a meter with a 900 mg/dL maximum capacity (Stat Xpress; Nova Biomedical, Waltham, MA).
Plasma Insulin
Mice were killed by overdose of anesthetic (2 g/kg Euthatal; Merial Animal Health, Essex, U.K.), and terminal blood samples were taken by cardiac puncture with heparinized needles. Blood was spun (1,500 rpm, 10 min, 4°C) and plasma removed and stored at −20°C until assayed (Ultrasensitive Insulin ELISA; Mercodia, Uppsala, Sweden).
Glucose Tolerance Test
Mice were fasted overnight for 16 h before glucose tolerance tests. Basal blood glucose concentrations were taken before administering glucose (2 g/kg) by intraperitoneal injection. Blood glucose concentrations were measured at 15, 30, 60, 90, and 120 min postinjection.
Islet Isolation
Islets were isolated by collagenase digestion as previously described in detail (7,8). Collagenase (1 mg/mL Type XI; Sigma-Aldrich) was injected into the pancreas through the bile duct. The pancreas was excised and incubated at 37°C for 10 min. The resulting digest was centrifuged and washed using minimum essential media (Sigma-Aldrich) before Histopaque-1077 (Sigma-Aldrich) was used to generate a density gradient from which the purified islets were collected. Islets were washed in minimum essential media before use or culturing in RPMI medium with 10% FBS.
Transmission Electron Microscopy
Islets were fixed with 2.5% (v/v) glutaraldehyde in 0.1 mol/L sodium cacodylate buffer. Samples were rinsed with 0.1 mol/L cacodylate buffer and postfixed in 1% (v/v) osmium tetroxide in 0.1 mol/L cacodylate buffer (pH 7.4). Samples were then embedded with epoxy resin (TAAB Laboratories Equipment, Berks, U.K.). Ultrathin sections (70–90 nm) were cut using a Leica UC7 ultramicrotome mounted on 150-mesh copper grids and contrasted using Uranyless (TAAB Laboratories Equipment) and 3% Reynolds Lead Citrate (TAAB Laboratories Equipment). Sections were examined at 120 kV on a JEOL JEM-1400Plus TEM with a Ruby digital camera (2k × 2k).
Quantification of Endoplasmic Reticulum Stress Markers by PCR
Islets from 4-, 10-, and 20-week-old mice were snap frozen and stored at −80°C until RNA extraction. Samples were lysed with lysis buffer (350 μL RLT buffer [QIAGEN, Manchester, U.K.], 1% β-mercaptoethanol) and further homogenized using QIAshredder spin columns (QIAGEN). RNA extraction (RNeasy Mini Kit; QIAGEN) and cDNA conversion (High-Capacity cDNA Reverse Transcription Kit; Applied Biosystems, Warrington, U.K.) were completed per manufacturer instructions. Real-time PCR was performed as previously described to investigate different branches of the unfolded protein response (UPR) using the following primers: CHOP (forward: CCAGCAGAGGTCACAAGCAC, reverse: CGCACTGACCACTCTGTTTC), BiP (forward: CCACCAGGATGCAGACATTG, reverse: AGGGCCTCCACTTCCATAGA), XPB1 (forward: AAGAACACGCTTGGGAATGG, reverse: ACTCCCCTTGGCCTCCAC), and XBP1s (forward: GAGTCCGCAGCAGGTG, reverse: GTGTCAGAGAGTCCATGGGA). Ins2 (forward: CTCTCTACCTGGTGTGTGGG, reverse: TGGGTAGTGGTGGGTCTAGT) was measured in a subset of preparations. All genes were normalized against the geometric mean of three reference genes: GAPDH (forward: AACTTTGGCATTGTGGAAGG, reverse: GGATGCAGGGATGATGTTCT), β-actin (forward: ACGGCCAGGTCATCACTATT, reverse: GTTGGCATAGAGGTCTTTACG), and OAZ1 (forward: CACCATGCCGCTTCTTAGTC, reverse: CCGGACCCAGGTTACTACAG) (9).
Quantification of Endoplasmic Reticulum Stress Markers by Western Blotting
Isolated islets were cultured for 1 day, and as a positive control, one group of wild-type islets were then treated for 16 h with 1 μm thapsigargin to induce endoplasmic reticulum (ER) stress (10). Islets pooled from two to three mice in each condition were lysed using radioimmunoprecipitation assay buffer supplemented with a protease and phosphatase inhibitor cocktail. Fifteen micrograms of protein per sample were subjected to SDS-PAGE and transferred to a polyvinylidene fluoride membrane. Membranes were treated with antibodies toward BiP, XBP1s, p-eIF-2-α (Cell Signaling Technology) and β-actin (Santa Cruz Biotechnology). Densitometry analysis was performed on Western blot images using ImageJ software.
Immunofluorescence
Whole pancreata from 4-, 10-, and 20-week-old animals were formalin fixed (4% formalin, 48 h), wax embedded, and cut into 5-μm sections. Sections from three different areas of the pancreas were dewaxed, underwent heat-mediated antigen retrieval (citrate buffer 10 mmol/L, pH 6), and stained using immunofluorescent techniques for insulin (Dako guinea pig anti-insulin 1:100; Agilent Technologies, Cheshire, U.K.; anti-guinea pig Alexa Fluor 647, 1:100; Jackson ImmunoResearch, Cambridgeshire, U.K.), glucagon (rabbit antiglucagon 1:25; Abcam, Cambridge, U.K.; anti-rabbit Alexa Fluor 488, 1:100; Jackson ImmunoResearch), somatostatin (rat antisomatostatin 1:25; Abcam; anti-rat Alexa Fluor 594, 1:100; Jackson ImmunoResearch), and DAPI (1:500; Invitrogen, Abingdon, U.K.). Pancreas sections were also costained for insulin, BiP (rabbit anti-BiP 1:100; Cell Signaling Technology; anti-rabbit Alexa Fluor 594 1:100; Jackson ImmunoResearch) and DAPI (1:500; Invitrogen). Images were taken at 30× magnification using a Nikon Eclipse TE2000-U.
Analysis of Islet Area and Composition
Because of the variable staining for insulin from KINGS mice, β-cell numbers were estimated by subtracting α- and δ-cell numbers from total islet cell count (DAPI staining). In a subset of sections, Nkx6.1 (rabbit anti-nkx6.1, 1:10 [Thermo Fisher Scientific, Abingdon, U.K.], and anti-rabbit Alexa Fluor 488, 1:100 [Jackson ImmunoResearch]) was stained to identify β-cells in combination with insulin and DAPI to validate the use of counting β-cells by proxy of deducting α- and δ-cell count from total cell number. Islet area was measured by tracing around the islet edge. All images were analyzed using ImageJ software.
Insulin Secretion and Content
Islets were cultured for 1 day. Insulin secretion and content were measured as previously described in detail (11). Briefly, islets were preincubated for 1 h in RPMI medium containing 2 mmol/L glucose. Groups of 5–10 islets (three to five replicates per animal) were picked and placed in Eppendorf tubes containing 500 μL physiological salt buffer solution (Gey’s Balanced Salt Solution), which was either supplemented with 2 mmol/L (basal) or 20 mmol/L (stimulatory) glucose. Islets were incubated for 1 h at 37°C after which supernatants were removed and stored at −18°C until analysis. Acidified alcohol was added to islet pellets before sonication and storage until analysis. Insulin secretion and content were measured by in-house radioimmunoassay (described in detail in Atanes et al. [11]).
Islet Transplantation
Five hundred islets from wild-type C57BL/6J mice were transplanted under the kidney capsule of 12-week KINGS males as previously described (7,8). Blood glucose and body weight were monitored daily for the 1st week and twice weekly thereafter. At 20 weeks of age, mice were killed and the endogenous islets isolated as described above.
Statistical Analysis
Unpaired t tests were used to compare two groups. ANOVAs with Holm-Sidak post hoc tests were used to compare multiple groups. For repeated measurements over time, a two-way repeated-measures ANOVA with Holm-Sidak post hoc test was used. All data are represented as mean ± SD. P < 0.05 was considered significant. Statistical analyses were performed with GraphPad Prism 8.0 software (GraphPad Software, San Diego, CA).
Data and Resource Availability
The data sets generated and/or analyzed during the current study and the KINGS mice (RRID:MGI:6449740) are available from the corresponding author upon reasonable request.
Results
Random Blood Glucose Concentrations Are Elevated in Male Mice but Near Normal in Female Mice
Both male and female homozygous mice were overtly diabetic at weaning (>540 mg/dL glucose; n = 3–5), emaciated, and had to be killed according to our ethical guidelines. Thereafter, only heterozygous mutant mice were bred for this study.
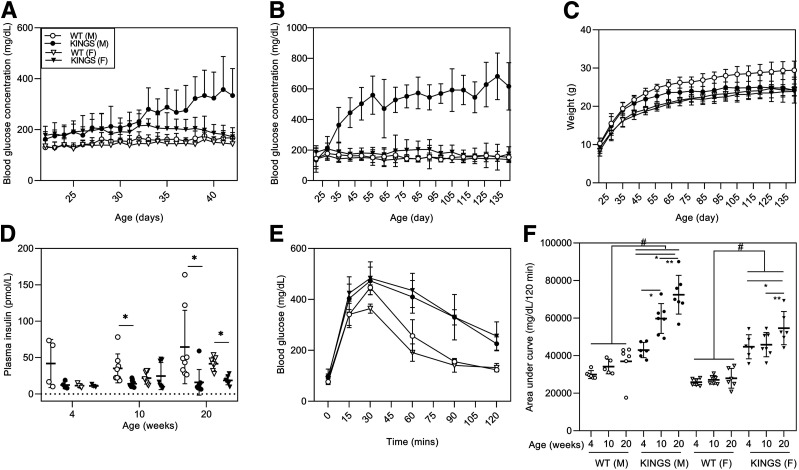
Wild-type mice showed normal blood glucose concentrations (<200 mg/dL) from weaning to 20 weeks (Fig. 2A and B). Male KINGS mice had higher blood glucose concentrations than at weaning by 28 days, which progressively increased to persistent and overt hyperglycemia (>300 mg/dL) from 38 days onward (Fig. 2A and B). Female KINGS mice had an overall mildly elevated blood glucose compared with wild-type females (P < 0.001, two-way repeated-measures ANOVA). They had occasional hyperglycemic spikes but maintained an average glycemia within or just above the upper limit of normoglycemia (<200 mg/dL), which did not worsen between weaning and 20 weeks. Body weight in the KINGS females was normal, but KINGS males had a reduced weight gain compared with wild-type males and were significantly lighter by 18 weeks (P = 0.027) (Fig. 2C).
Figure 2.
A and B: Random daily blood glucose concentrations from 22 to 42 days (A) and weekly blood glucose concentrations from 21 to 140 days (B) of wild-type (WT) male, KINGS male, WT female, and KINGS female mice. KINGS male and KINGS female mice show significantly elevated blood glucose compared with sex-matched WT littermates (P < 0.001, two-way repeated-measures ANOVA, Holm-Sidak post hoc, n = 11–15). In male KINGS mice, blood glucose concentrations are elevated by 5 weeks compared with their starting levels measured at 3 weeks (P < 0.001, two-way repeated-measures ANOVA, Holm-Sidak post hoc, n = 13). In all other groups, blood glucose remained constant across the 20 weeks. C: Weekly weight monitoring from 21 to 140 days. Male KINGS mice show lack of weight gain and are significantly different from WT mice by 126 days (P < 0.05, two-way RM ANOVA, Holm-Sidak post hoc, n = 11–15). D: Plasma insulin concentration in male and female WT and KINGS mice at 4, 10, and 20 weeks. Plasma insulin levels were significantly reduced in the KINGS males from 10 weeks and at 20 weeks in the KINGS females compared with WT littermates (P < 0.05, unpaired t test, n = 4–10). E: Glucose tolerance test at 4 weeks of age for WT and KINGS male and female mice. F: Area under the curve for glucose tolerance tests at 4, 10, and 20 weeks. Both male and female KINGS mice show significant glucose intolerance at all time points compared with sex-matched WT mice. Male glucose intolerance worsens with age, and females only show worsening at 20 weeks. #P < 0.05 KINGS vs. age and sex-matched WT mice; *P < 0.05 vs. 4 weeks of age and genotype-matched mice; **P < 0.05 vs. 10 weeks of age and genotype-matched mice; two-way ANOVA, Holm-Sidak post hoc test, n = 5–7.
Plasma Insulin Is Detected in Male and Female KINGS Mice
Plasma insulin is detectable in KINGS mice (Fig. 2D). In most male KINGS mice, the plasma insulin concentrations at each age-group is at the lower end of those seen in wild-type mice, but this only reaches significance from 10 weeks. In female KINGS mice, there seems to be little difference in mean plasma insulin concentrations at 4 and 10 weeks, but by 20 weeks, the plasma insulin concentrations are significantly lower than in wild-type mice.
Male and Female Mice Are Glucose Intolerant
At 4 weeks, random blood glucose concentrations were below hyperglycemic levels in both male and female KINGS mice (Fig. 2A). At this age, both sexes showed impaired glucose tolerance compared with wild-type mice (Fig. 2E). Impaired glucose tolerance persisted at 10 and 20 weeks compared with wild-type mice (P < 0.005 for all comparisons) (Fig. 2F). Glucose intolerance progressively worsened in KINGS males between 4, 10, and 20 weeks, whereas in KINGS female mice, the glucose intolerance only worsened at 20 weeks (Fig. 2F).
Islet Ultrastructure Indicates ER Stress
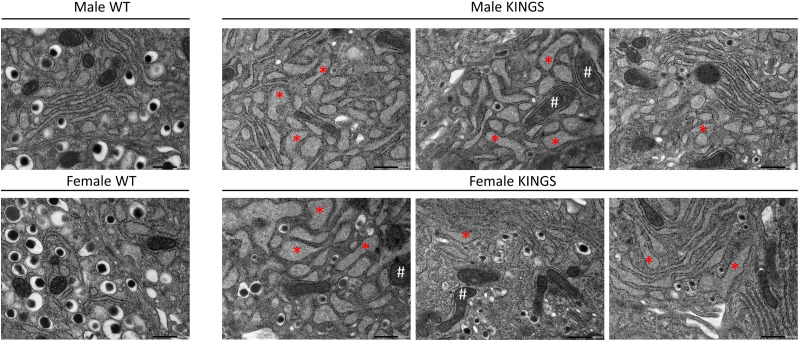
At 10 weeks, male and female KINGS β-cells showed distended ER, indicative of ER stress, and swollen mitochondria with distorted cristae (Fig. 3). Insulin granules were mostly depleted in KINGS males and to a lesser extent in females. However, there was heterogeneity between β-cells, and the severity of ultrastructural changes was variable.
Figure 3.
Transmission electron microscopy images of representative β-cells from 10-week-old wild-type (WT) and KINGS male and female mice. WT β-cells show normal ER and mitochondria as well as dense core insulin granules (one representative image shown for each sex). KINGS β-cells (three representative images shown for each sex) have dilated ER (*), swollen mitochondria with distorted cristae (#) and a reduced density and number of insulin granules. The severity of the latter is heterogeneous between β-cells. Magnification ×150,000, scale bar = 500 nm.
Increased Gene and Protein Expression of ER Stress Markers in the KINGS Mice
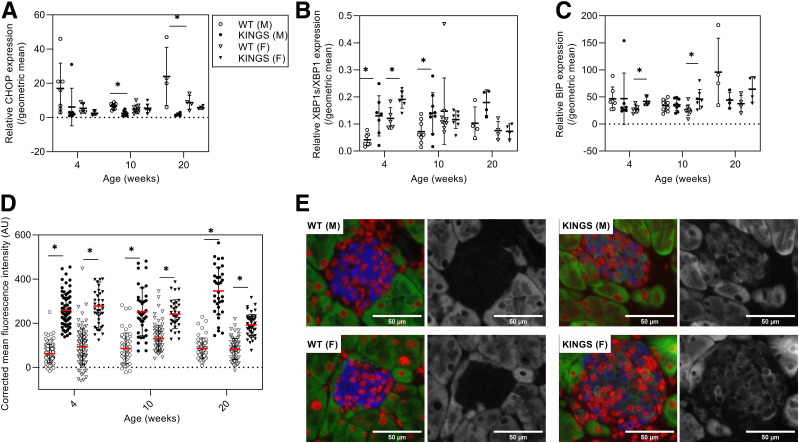
CHOP mRNA levels were unchanged in female KINGS islets and either unchanged of significantly decreased in male KINGS islets at all ages compared with wild type (Fig. 4A). Phosphorylation of eIF-2-α was slightly increased in KINGS male islets at 10 weeks (1.6-fold) (Supplementary Fig. 1). The XBP1s/XBP1 mRNA ratio was increased in the KINGS males at all ages; in female KINGS islets, the XBP1s/XBP1 ratio was only increased at 4 weeks (Fig. 4B). The XBP1s induction was confirmed at the protein level in 10-week KINGS males where XBP1s protein levels were 3.7-fold that of wild type (Supplementary Fig. 1). BiP mRNA was upregulated in KINGS females at 4 and 10 weeks, but this did not reach significance at 20 weeks (Fig. 4C). In males, BiP induction at the mRNA level was not detected. However, immunofluorescent staining found that BiP protein levels were increased at 4, 10, and 20 weeks in KINGS male islets (Fig. 4D), which was also true for KINGS females. Western blotting also found increased BiP in 10-week male KINGS islets (Supplementary Fig. 1). Overall, these data suggest that there is signaling in the IRE1 and ATF6 branches of the ER stress response (XBP1s and BiP) and mild or no activation of the PERK branch (eIF-2-α phosphorylation, CHOP). Ins2 mRNA expression was measured in 10-week-old mice and was found to be upregulated in KINGS male mice (twofold increase vs. wild-type: 2,170 ± 332 vs. 960 ± 204, P = 0.025, n = 3–4). There was more variability in female KINGS mice, with no difference compared with wild type (1,500 ± 530 vs. 860 ± 170, P = 0.19, n = 3–4).
Figure 4.
CHOP (A), XBP1s/XBP1 (B), and BiP (C) gene expression in islets from wild-type (WT) male, KINGS male, WT female, and KINGS female mice at 4, 10, and 20 weeks of age. CHOP had reduced or similar expression in KINGS male and female islets compared with age- and sex-matched controls, while BiP had increased expression only in KINGS females at 4 and 10 weeks of age, and the XBP1s/XBP1 expression ratio was increased in both male and female KINGS mice at 4 weeks and in male KINGS mice at 10 weeks. *P < 0.05, unpaired t test, n = 4–9. D: Immunofluorescence analysis of BiP in islets from pancreata of WT male, KINGS male, WT female, and KINGS female mice. BiP levels were significantly higher in both male and female KINGS mice from 4 weeks compared with age- and sex-matched WT littermates. *P < 0.0001, unpaired t test, n = 3, 8–49 islets per animal. E: Representative immunofluorescent images of islets from male and female WT and KINGS mice stained for insulin (blue), DAPI (red), and BiP (green/white). AU, arbitrary unit.
Islet Composition Changes: Islet Size Range Was Similar in Wild-Type and KINGS Mice
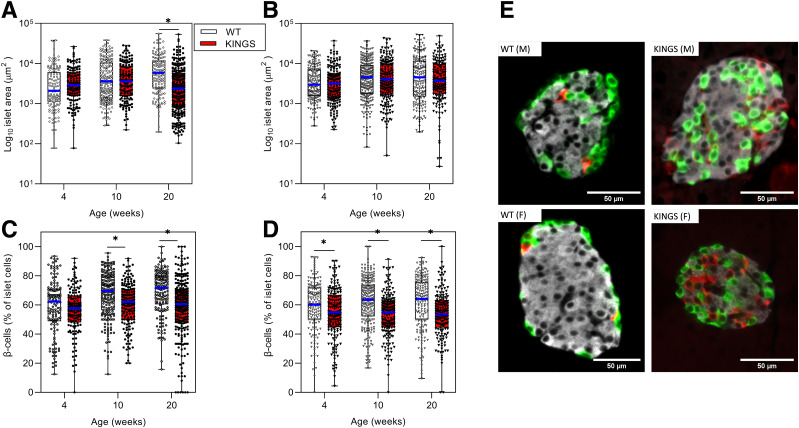
Male KINGS mean islet area only differed from wild type at 20 weeks (Fig. 5A and B). The scatter gram shows that this is likely the result of the KINGS mice having more small islets rather than a loss of larger islets. In female mice, mean islet area in KINGS mice was similar to wild type at 4, 10, and 20 weeks (Fig. 5B). The composition of the islets was studied by expressing the number of β-cells as a percentage of total islet cells. KINGS islets had a moderate reduction in the percentage of β-cells at 10 and 20 weeks in male and female mice (Fig. 5C and D). There was a corresponding increase of α- and δ-cell percentage (Supplementary Fig. 2). KINGS islets showed substantial cell disorganization with α- and δ-cells located throughout the islet rather than at the periphery (Fig. 5E).
Figure 5.
Individual islet areas measured in male (A) and female (B) wild-type (WT) and KINGS mice at 4, 10, and 20 weeks using immunofluorescence staining. Median area is indicated by the blue line, boxes represent the interquartile range, and whiskers indicate the range. Islet area was significantly reduced in 20-week male KINGS mice compared with age-matched WT littermates. *P < 0.0005, unpaired t test, n = 128–245. β-Cell percentage of total islet cells in WT male (○), KINGS male (●) mice (C) and WT female (▿) and KINGS female (▼) mice (D) at 4, 10, and 20 weeks of age. β-Cell percentage in KINGS males is slightly reduced compared with WT at 10 weeks and 20 weeks, and KINGS female β-cell percentage is reduced from 4 weeks. *P < 0.05, unpaired t test, n = 3, 128–258 islets per group. Representative immunofluorescent images of islets from 10-week WT and KINGS male and female mice stained for insulin (white), glucagon (green), somatostatin (red) (E).
Islet Glucose-Induced Insulin Secretion and Insulin Content Is Reduced
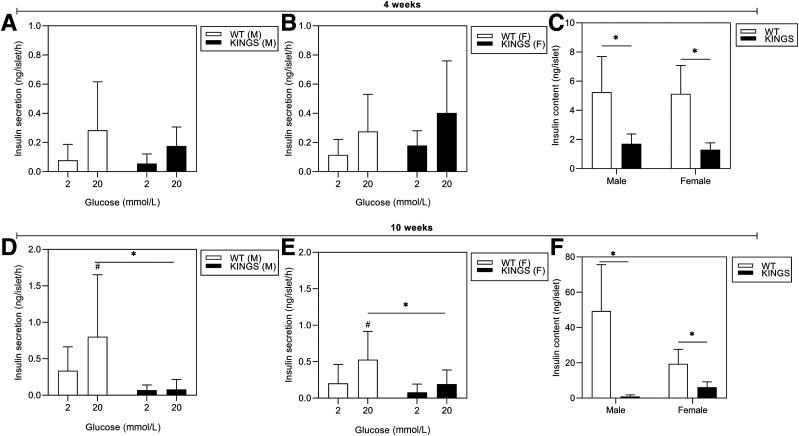
Insulin secretion and content were measured in islets from 4- and 10-week mice. At 4 weeks, both male and female (Fig. 6A and B) KINGS mice showed the ability to respond to 20 mmol/L glucose, despite a significant reduction in insulin content (Fig. 6C). By 10 weeks, when KINGS males were overtly hyperglycemic, glucose-induced insulin secretion was almost completely abolished (Fig. 6C and D), and islet insulin content was reduced 98% compared with wild type (Fig. 6F). In female mice, both glucose-induced insulin secretion and islet insulin content were markedly reduced (Fig. 6E and F) but not to the same extent as seen in male islets.
Figure 6.
Glucose-stimulated insulin secretion at 4 weeks (A and B) and 10 weeks (D and E) for male and female KINGS and wild-type (WT) islets. The ability of KINGS islets to respond to 20 mmol/L glucose is impaired at 10 weeks. #P < 0.05, 2 vs. 20 mmol/L; *P < 0.05, KINGS vs. age- and sex-matched WT mice; two-way ANOVA, Holm-Sidak post hoc, n = 2–6. Insulin content of islets from 4-week (C) to 10-week (F) male and female KINGS and WT mice. Insulin content is reduced in 4- and 10-week KINGS mice compared with WT. *P < 0.0001, unpaired t test, n = 9–37.
Islet Function Is Partially Restored in a Normoglycemic Environment
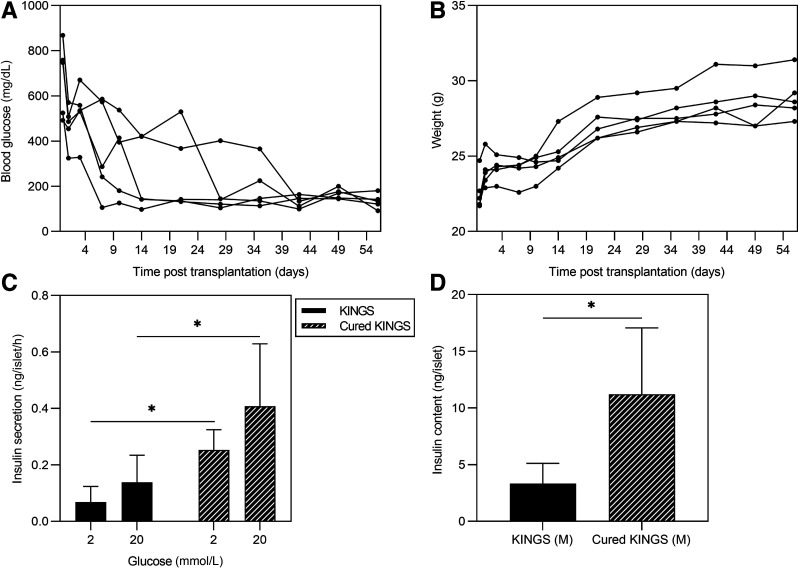
To test whether impaired islet function in KINGS males was reversible, 12-week-old KINGS males were transplanted with wild-type islets under the kidney capsule for 8 weeks. Normoglycemia after islet transplantation was achieved for between 2 and 7 weeks before endogenous islets were isolated (Fig. 7A), and all mice gained weight (Fig. 7B). Islets from “cured” KINGS males showed increased glucose-induced insulin secretion compared with age-matched nongrafted diabetic KINGS mice (Fig. 7C). Insulin content within the islets was also higher in the cured KINGS islets compared with islets from diabetic KINGS mice (Fig. 7D). However, it should be noted that the islet insulin content was still ∼80% reduced compared with age-matched wild-type islets.
Figure 7.
A: Random blood glucose concentrations after islet transplantation in KINGS male mice. All mice reach normoglycemia by 42 days posttransplantation and remain normoglycemic for at least 3 weeks. B: Weight monitoring after islet transplantation in KINGS male mice. C and D: Glucose-stimulated insulin secretion and islet insulin content for KINGS males and cured KINGS males after 8 weeks of subcapsular islet transplantation. Cured KINGS males have significant recovery of 20 mmol/L glucose-induced insulin secretion and insulin content compared with nontransplanted KINGS males. *P < 0.05, two-way ANOVA, n = 6–7 (C), *P < 0.05, unpaired t test, n = 5–14 (D).
KINGS Mice Have Lower Blood Glucose Than Akita Mice
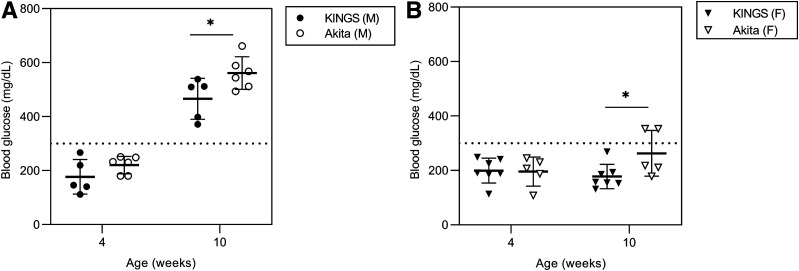
A subset of KINGS mice were directly compared with Akita mice with regard to blood glucose concentrations. There were no differences between the two models at 4 weeks; however, both male and female Akita mice had significantly higher blood glucose concentrations at 10 weeks than KINGS mice (Fig. 8).
Figure 8.
Nonfasted blood glucose concentrations in male (A) and female (B) KINGS and Akita mice. Akita mice had significantly higher blood glucose concentrations at 10 weeks compared with age- and sex-matched KINGS mice. *P < 0.05, unpaired t test, n = 5–7.
Discussion
This study introduces a novel model of diabetes, the KINGS mouse. The KINGS mutation causes a rare form of neonatal diabetes in humans (4–6), and therefore, this model provides a unique opportunity to uncover the pathogenic mechanisms underlying this type of diabetes (12) as well as representing a model of how β-cells respond to ER stress.
Homozygous KINGS mice were hyperglycemic at weaning and became emaciated, rapidly reaching our ethical end points for killing. Considering the ethical implications, together with the fact that only the heterozygous mutation has been described in humans (4–6), it was decided to breed the KINGS mice as heterozygotes, as typically done with mice carrying other insulin mutations (Akita and Munich mice) (13,14).
Heterozygous male and female KINGS mice maintain random nonfasted blood glucose concentrations of ∼200 mg/dL at 4 weeks. Glucose tolerance tests carried out at this age show that both KINGS sexes are glucose intolerant. KINGS males consistently progress to severe hyperglycemia, which is maintained from 5 weeks of age onward, and their glucose tolerance deteriorates between 4 and 20 weeks. In stark contrast, the female mice do not develop overt hyperglycemia. Their glucose intolerance initially remains stable but deteriorates between 10 and 20 weeks. There are clear signs of ER stress in both male and female KINGS islets. While there is no massive β-cell loss, islet function is impaired and severely so in the males.
Other animal models with Ins2 mutations (Akita and Munich mice) have proven interesting for preclinical diabetes research (14–16). These mutations cause cysteine residue substitutions on the A chain of preproinsulin 2 and consequently disrupt the proinsulin A7-B7 disulphide bridge. This results in retention and aggregation of misfolded insulin in the ER, causing severe proteotoxic ER stress and activation of the UPR. Furthermore, aggregations can form between mutated and unmutated proinsulin, further increasing ER stress and depleting native insulin availability (17–19). These effects ultimately lead to β-cell loss through apoptotic cascades (20–25).
In contrast, the KINGS mouse mutation involves an amino acid that is not directly involved in disulphide bridge formation. However, the substitution of glycine with serine at this position introduces a side chain, which results in conformational change likely to indirectly affect the disulphide bond, subsequent proinsulin folding, and structure (5,26). We have shown that the KINGS mutation drives β-cell ER stress. Electron micrographs revealed ultrastructural hallmarks of this, with swollen ER and distorted mitochondria evident in KINGS β-cells. Furthermore, we found upregulation of the general ER stress marker BiP at the gene level in female mice and at the protein level in both female and male mice. BiP is regulated posttranscriptionally, and this may explain BiP protein induction in the absence of detectable mRNA upregulation in the males (27). The UPR is activated in response to ER stress, and depending on the extent of the ER stress, this response can be adaptive or maladaptive and restore ER homeostasis or promote cellular dysfunction and death, respectively (28). Expression of UPR components were investigated in KINGS islets.
XBP1s/XBP1 gene expression levels are increased at 4 weeks and 10 weeks in the male KINGS mice, and increased XBP1s protein was also confirmed at 10 weeks. This suggests activation of the IRE1 UPR pathway, which is associated with gene expression of ER-associated degradation components to restore ER homeostasis. Interestingly, in the female KINGS mice, XBP1s/XBP1 gene expression is only increased at 4 weeks in the KINGS mice, possibly implying differential UPR pathway activation between the sexes at later ages.
The adaptive PERK UPR pathway restores ER homeostasis by attenuating global protein translation and selectively promoting the translation of ATF4. The maladaptive PERK pathway is associated with the expression of the proapoptotic protein CHOP. Phosphorylation of eIF-2-α was mildly increased at 10 weeks in KINGS male mice. This together with our finding that CHOP gene expression is not enhanced in KINGS mice at any age may suggest that ER stress is not robust enough to activate maladaptive PERK signaling. This contrasts findings in the Akita mouse that eIF-2-α phosphorylation is not enhanced (29) and CHOP expression is upregulated and believed to drive β-cell death (30).
Our study of islet composition indicates that the percentage of islet cells comprising β-cells only drops by 10–15% in the KINGS mice. This contrasts the >50% reduction of β-cell volume in the Akita mouse (14) and indicates that ER stress in the KINGS mouse is not causing such extensive β-cell loss. Indeed, when we compared the KINGS mice with Akita mice, we found that the KINGS mice had significantly lower blood glucose concentrations at 10 weeks. This is also consistent with our previous study using Akita mice where female mice developed overt hyperglycemia (16), which is in stark contradiction to the phenotype of KINGS females. Interestingly, while Ins2 mRNA is enhanced in the KINGS mice relative to the wild type, indicating a compensatory response of the β-cells, some studies have found that Ins2 mRNA expression is reduced in Akita mice; however, other studies have suggested that it is increased (29,30). Nevertheless, reduced plasma insulin levels and overt hyperglycemia indicate that the attempt to compensate is not sufficient to prevent overt diabetes in male mice.
In vitro studies have suggested that the KINGS mutation may result in milder ER stress than the Akita mutation. When the KINGS (G32S) Ins2 gene was transfected into MIN6 cells, there was a modest retention of misfolded insulin in the ER compared with the more severe retention seen in the Akita (C96Y) Ins2 transfections (31). The same study showed that G32S proinsulin, but not C96Y proinsulin, was partially recruited to granules. Another study showed limited insulin secretion from INS-1 cells transfected with either the Akita- or the KINGS-mutated insulin (32). However, since intracellular content of C-peptide was higher in cells with the KINGS mutation compared with the Akita mutation, it was concluded that the folding capacity of KINGS-mutated insulin was superior. Together these articles indicate that the misfolding, ER stress, and UPR activation may be more modest in our model.
Glucotoxicity can drive β-cell dysfunction through various mechanisms, including through increasing β-cell ER stress (33). To ascertain whether the hyperglycemia seen in the male KINGS mice exacerbated the β-cell dysfunction, we corrected glycemia by transplanting wild-type islets under the kidney capsule. Endogenous islets isolated from normoglycemia-corrected KINGS mice showed a partial restoration of β-cell function and insulin content, indicating that glucotoxicity contributes to β-cell dysfunction. The functional data suggest that there is a tipping point at which mice go from a reduced insulin content while maintaining the ability to secrete insulin (as is seen in 4-week male and female KINGS mice) to one where insulin content is reduced to such an extent that the islet can no longer meet the insulin demand (as seen in adult male KINGS mice). Male mice are significantly heavier than female mice, and therefore, a higher insulin demand may explain why male mice “tip” into hyperglycemia while females remain protected. In addition, circulating estrogen acting on islet estrogen receptors can promote β-cell survival and proliferation, which may contribute to the sex difference (34–36).
This study has validated the KINGS mouse as a novel model of monogenic diabetes caused by ER stress and glucotoxicity, pathogenic processes implicated in type 1 and type 2 diabetes. Previously published Ins2 mutant mice have shown severe islet ER stress and substantial β-cell loss. In contrast, the KINGS mouse does not show severe β-cell loss and may therefore provide key mechanistic insights into β-cell survival. Further work is required to understand the adaptive and protective mechanisms involved. In addition, the KINGS male mice have a reliable and predictable onset of overt hyperglycemia and, thus, could be used as a model of hyperglycemia in which toxic agents, such as streptozotocin, can be avoided. In conclusion, the KINGS mouse not only is a translational model of neonatal diabetes but also has great potential for investigations of hyperglycemia, islet adaptation to stress, and diabetic complications.
Article Information
Acknowledgments. The authors thank Michael Pangerl from the ULB Center for Diabetes Research for technical support and Prof. Decio Eizirik for very useful discussions. The authors are grateful to the Biological Services Unit at KCL for expert animal care and to the Centre for Ultrastructural Imaging for expertise in transmission electron microscopy.
Funding. Support was provided by the Medical Research Council Doctoral Training Programme (L.F.D.G.), U.K.; Fonds National de la Recherche Scientifique (FNRS); and the Brussels Capital Region-Innoviris.
Duality of Interest. No potential conflicts of interest relevant to this article were reported.
Author Contributions. A.L.F.A., L.F.D.G., M.C., and G.S. developed protocols for the experiments, conducted experiments, performed the statistical analysis, constructed figures and tables, and actively participated in writing and reviewing the manuscript. D.A., S.S., C.G., and S.B. initially discovered hyperglycemia in the mouse colony, sequenced Ins2, developed and carried out protocols for genotyping the mice, and participated in protocol design and writing and reviewing of the manuscript. P.M.J. and A.J.F.K. were lead supervisors, developed protocols for the experiments, and participated in data analysis and writing of the manuscript. A.J.F.K. is the guarantor of this work and, as such, had full access to all the data in the study and takes responsibility for the integrity of the data and the accuracy of the data analysis.
Prior Presentation. Parts of this study were presented in abstract form at the Diabetes UK Professional Conference 2017, Manchester, U.K., 8–10 March 2017; 3rd Joint EASD Islet Study Group & Beta Cell Workshop, Oxford, U.K., 1–3 April 2019; and European Association for the Study of Diabetes 56th Annual Meeting, Virtual, 21–25 September 2020.
Footnotes
This article contains supplementary material online at https://doi.org/10.2337/figshare.12990821.
References
- 1.King A, Bowe J. Animal models for diabetes: understanding the pathogenesis and finding new treatments. Biochem Pharmacol 2016;99:1–10 [DOI] [PubMed] [Google Scholar]
- 2.King AJF. The use of animal models in diabetes research. Br J Pharmacol 2012;166:877–894 [DOI] [PMC free article] [PubMed] [Google Scholar]
- 3.Bowe JE, Franklin ZJ, Hauge-Evans AC, King AJ, Persaud SJ, Jones PM. Metabolic phenotyping guidelines: assessing glucose homeostasis in rodent models. J Endocrinol 2014;222:G13–G25 [DOI] [PubMed] [Google Scholar]
- 4.Edghill EL, Flanagan SE, Patch AM, et al.; Neonatal Diabetes International Collaborative Group . Insulin mutation screening in 1,044 patients with diabetes: mutations in the INS gene are a common cause of neonatal diabetes but a rare cause of diabetes diagnosed in childhood or adulthood. Diabetes 2008;57:1034–1042 [DOI] [PMC free article] [PubMed] [Google Scholar]
- 5.Støy J, Edghill EL, Flanagan SE, et al.; Neonatal Diabetes International Collaborative Group . Insulin gene mutations as a cause of permanent neonatal diabetes. Proc Natl Acad Sci U S A 2007;104:15040–15044 [DOI] [PMC free article] [PubMed] [Google Scholar]
- 6.Fu J, Wang T, Li M, Xiao X. Identification of insulin gene variants in patients with neonatal diabetes in the Chinese population. J Diabetes Investig 2020;11:578–584 [DOI] [PMC free article] [PubMed] [Google Scholar]
- 7.King AJF, Rackham CL. Assessing islet transplantation outcome in mice. In Type 2 Diabetes: Methods in Molecular Biology. Vol. 2076 Stocker C, Ed. New York, Humana, 2020, pp. 265–280 [DOI] [PubMed] [Google Scholar]
- 8.King AJF, Griffiths LA, Persaud SJ, Jones PM, Howell SL, Welsh N. Imatinib prevents beta cell death in vitro but does not improve islet transplantation outcome. Ups J Med Sci 2016;121:140–145 [DOI] [PMC free article] [PubMed] [Google Scholar]
- 9.Cunha DA, Hekerman P, Ladrière L, et al. Initiation and execution of lipotoxic ER stress in pancreatic β-cells. J Cell Sci 2008;121:2308–2318 [DOI] [PMC free article] [PubMed] [Google Scholar]
- 10.Cunha DA, Cito M, Grieco FA, et al. Pancreatic β-cell protection from inflammatory stress by the endoplasmic reticulum proteins thrombospondin 1 and mesencephalic astrocyte-derived neutrotrophic factor (MANF). J Biol Chem 2017;292:14977–14988 [DOI] [PMC free article] [PubMed] [Google Scholar]
- 11.Atanes P, Ruz-Maldonado I, Olaniru OE, Persaud SJ. Assessing mouse islet function. In Animal Models of Diabetes Methods: in Molecular Biology. Vol. 2128 King A, Ed. New York, Humana, 2020, pp. 241–268 [DOI] [PubMed] [Google Scholar]
- 12.Støy J, Steiner DF, Park SY, Ye H, Philipson LH, Bell GI. Clinical and molecular genetics of neonatal diabetes due to mutations in the insulin gene. Rev Endocr Metab Disord 2010;11:205–215 [DOI] [PMC free article] [PubMed] [Google Scholar]
- 13.Kautz S, van Bürck L, Schuster M, Wolf E, Wanke R, Herbach N. Early insulin therapy prevents beta cell loss in a mouse model for permanent neonatal diabetes (Munich Ins2(C95S)). Diabetologia 2012;55:382–391 [DOI] [PubMed] [Google Scholar]
- 14.Yoshioka M, Kayo T, Ikeda T, Koizumi A. A novel locus, Mody4, distal to D7Mit189 on chromosome 7 determines early-onset NIDDM in nonobese C57BL/6 (Akita) mutant mice. Diabetes 1997;46:887–894 [DOI] [PubMed] [Google Scholar]
- 15.Herbach N, Rathkolb B, Kemter E, et al. Dominant-negative effects of a novel mutated Ins2 allele causes early-onset diabetes and severe beta-cell loss in Munich Ins2C95S mutant mice. Diabetes 2007;56:1268–1276 [DOI] [PubMed] [Google Scholar]
- 16.Vastani N, Guenther F, Gentry C, et al. Impaired nociception in the diabetic Ins2+/Akita mouse. Diabetes 2018;67:1650–1662 [DOI] [PubMed] [Google Scholar]
- 17.Hodish I, Liu M, Rajpal G, et al. Misfolded proinsulin affects bystander proinsulin in neonatal diabetes. J Biol Chem 2010;285:685–694 [DOI] [PMC free article] [PubMed] [Google Scholar]
- 18.Liu M, Hodish I, Rhodes CJ, Arvan P. Proinsulin maturation, misfolding, and proteotoxicity. Proc Natl Acad Sci U S A 2007;104:15841–15846 [DOI] [PMC free article] [PubMed] [Google Scholar]
- 19.Sun J, Xiong Y, Li X, et al. Role of proinsulin self-association in mutant INS gene–induced diabetes of youth. Diabetes 2020;69:954–964 [DOI] [PMC free article] [PubMed] [Google Scholar]
- 20.Liu M, Hodish I, Haataja L, et al. Proinsulin misfolding and diabetes: mutant INS gene-induced diabetes of youth. Trends Endocrinol Metab 2010;21:652–659 [DOI] [PMC free article] [PubMed] [Google Scholar]
- 21.Zuber C, Fan JY, Guhl B, Roth J. Misfolded proinsulin accumulates in expanded pre-Golgi intermediates and endoplasmic reticulum subdomains in pancreatic beta cells of Akita mice. FASEB J 2004;18:917–919 [DOI] [PubMed] [Google Scholar]
- 22.Weiss MA. Diabetes mellitus due to the toxic misfolding of proinsulin variants. FEBS Lett 2013;587:1942–1950 [DOI] [PMC free article] [PubMed] [Google Scholar]
- 23.Ron D. Proteotoxicity in the endoplasmic reticulum: lessons from the Akita diabetic mouse. J Clin Invest 2002;109:443–445 [DOI] [PMC free article] [PubMed] [Google Scholar]
- 24.Eizirik DL, Miani M, Cardozo AK. Signalling danger: endoplasmic reticulum stress and the unfolded protein response in pancreatic islet inflammation. Diabetologia 2013;56:234–241 [DOI] [PubMed] [Google Scholar]
- 25.Araki E, Oyadomari S, Mori M. Impact of endoplasmic reticulum stress pathway on pancreatic β-cells and diabetes mellitus. Exp Biol Med (Maywood) 2003;228:1213–1217 [DOI] [PubMed] [Google Scholar]
- 26.Nakagawa SH, Zhao M, Hua QX, et al. Chiral mutagenesis of insulin. Foldability and function are inversely regulated by a stereospecific switch in the B chain. Biochemistry 2005;44:4984–4999 [DOI] [PMC free article] [PubMed] [Google Scholar]
- 27.Gülow K, Bienert D, Haas IG. BiP is feed-back regulated by control of protein translation efficiency. J Cell Sci 2002;115:2443–2452 [DOI] [PubMed] [Google Scholar]
- 28.Eizirik DL, Cnop M. ER stress in pancreatic beta cells: the thin red line between adaptation and failure. Sci Signal 2010;3:pe7. [DOI] [PubMed] [Google Scholar]
- 29.Nozaki Ji, Kubota H, Yoshida H, et al. The endoplasmic reticulum stress response is stimulated through the continuous activation of transcription factors ATF6 and XBP1 in Ins2+/Akita pancreatic β cells. Genes Cells 2004;9:261–270 [DOI] [PubMed] [Google Scholar]
- 30.Oyadomari S, Koizumi A, Takeda K, et al. Targeted disruption of the Chop gene delays endoplasmic reticulum stress-mediated diabetes. J Clin Invest 2002;109:525–532 [DOI] [PMC free article] [PubMed] [Google Scholar]
- 31.Rajan S, Eames SC, Park SY, et al. In vitro processing and secretion of mutant insulin proteins that cause permanent neonatal diabetes. Am J Physiol Endocrinol Metab 2010;298:E403–E410 [DOI] [PMC free article] [PubMed] [Google Scholar]
- 32.Park SY, Ye H, Steiner DF, Bell GI. Mutant proinsulin proteins associated with neonatal diabetes are retained in the endoplasmic reticulum and not efficiently secreted. Biochem Biophys Res Commun 2010;391:1449–1454 [DOI] [PMC free article] [PubMed] [Google Scholar]
- 33.Eizirik DL, Cardozo AK, Cnop M. The role for endoplasmic reticulum stress in diabetes mellitus. Endocr Rev 2008;29:42–61 [DOI] [PubMed] [Google Scholar]
- 34.Xu B, Allard C, Alvarez-Mercado AI, et al. Estrogens promote misfolded proinsulin degradation to protect insulin production and delay diabetes. Cell Rep 2018;24:181–196 [DOI] [PMC free article] [PubMed] [Google Scholar]
- 35.Le May C, Chu K, Hu M, et al. Estrogens protect pancreatic β-cells from apoptosis and prevent insulin-deficient diabetes mellitus in mice. Proc Natl Acad Sci U S A 2006;103:9232–9237 [DOI] [PMC free article] [PubMed] [Google Scholar]
- 36.Tiano JP, Mauvais-Jarvis F. Importance of oestrogen receptors to preserve functional β-cell mass in diabetes. Nat Rev Endocrinol 2012;8:342–351 [DOI] [PubMed] [Google Scholar]


