Abstract
Background & Aims:
Development of pancreatic ductal adenocarcinoma (PDA) involves acinar to ductal metaplasia and genesis of tuft cells. It has been a challenge to study these rare cells due to lack of animal models. We investigated the role of tuft cells in pancreatic tumorigenesis.
Methods:
We performed studies with LSL-KrasG12D/+; Ptf1aCre/+ mice (KC, develop pancreatic tumors), KC mice crossed with mice with pancreatic disruption of Pou2f3 (KPouC mice, do not develop Tuft cells), or mice with pancreatic disruption of the hematopoietic prostaglandin D synthase gene (Hpgds, KHC mice), and wild-type mice. Mice were allowed to age or were given caerulein to induce pancreatitis; pancreata were collected and analyzed by histology, immunohistochemistry, RNA sequencing, ultrastructural microscopy, and metabolic profiling. We performed laser-capture dissection and RNA sequencing analysis of pancreatic tissues from 26 patients with pancreatic intraepithelial neoplasias (PanINs), 19 patients with intraductal papillary mucinous neoplasms (IPMN), and 197 patients with PDA.
Results:
Pancreata from KC mice had increased formation of tuft cells and higher levels of prostaglandin D2 than wild-type mice. Pancreas-specific deletion of POU2F3 in KC mice (KPouC mice) resulted in a loss of tuft cells and accelerated tumorigenesis. KPouC mice had increased fibrosis and activation of immune cells following administration of caerulein. Pancreata from KPouC and KHC mice had significantly lower levels of PGD2, compared with KC mice, and significantly increased numbers of PanINs and PDAs. KPouC and KHC mice had increased pancreatic injury, following administration of caerulein, significantly less normal tissue, more extracellular matrix deposition, and higher PanIN grade than KC mice. Human PanIN and IPMN had gene expression signatures associated with tuft cells and increased expression of Hpgds mRNA compared with PDA.
Conclusions:
In mice with KRAS-induced pancreatic tumorigenesis, loss of tuft cells accelerates tumorigenesis and increases the severity of caerulein-induced pancreatic injury, via decreased production of PGD2. These data are consistent with the hypothesis that tuft cells are a metaplasia-induced tumor attenuating cell type.
Keywords: COX1, COX2, eicosanoids, inflammation
Graphical Abstract
Introduction:
Chemical or mechanical injury of the pancreas results in a cell state-switching event termed acinar to ductal metaplasia (ADM), where digestive enzyme-producing acinar cells dedifferentiate into ductal-like cells to restore homeostasis. This process is perturbed during neoplastic progression where tumor-initiating Kras mutations prevent tissue healing and, instead, ADM can progress to pancreatic intraepithelial neoplasia (PanIN) and then to pancreatic ductal adenocarcinoma (PDA). This is an example of Dvorak’s thesis, which states that cancer represents the ever-healing wound 1. The profound difference between the normal healing process and the perturbed response engendered by oncogene activation raises the important question of whether key cell types that result from ADM impact cancer progression. Here, we investigate the role of tuft cells as they appear in response to oncogene-induced metaplasia in a number of cancers of human significance, including PDA2, 3.
Tuft cells are solitary chemosensory cells found throughout the hollow organs of the respiratory and digestive tracts. They are readily identified by their striking morphological features, including long, blunt microvilli, deep actin rootlets, and an extensive tubulovesicular system in the supranuclear cytoplasm 4. Their expression of taste, neuronal, and inflammatory cell signaling factors is thought to enable monitoring of intraluminal homeostasis, to achieve local responses via effectors4. Despite the discovery of this ‘peculiar cell’ by Jarvi and Keyriainen in 1956, little functional data existed until recently 5. Since 2016, several groups have demonstrated that intestinal tuft cells detect and combat parasite infection through the expression of succinate receptor 1 (Sucnr1) and cytokine IL-25 6–11. Thymic tuft cells have been shown to function in the development of thymic invariant natural killer T cells 12, 13. These studies suggest that tuft cells play multifaceted roles in sensing and responding to diverse inflammatory conditions.
While tuft cells have been reported in normal human pancreas, they are generally not present in the murine pancreas 3, 14. Rather, we, and others, have shown that tuft cells transdifferentiate from the acinar cell epithelium as part of ADM in response to injury or oncogenic Kras expression 2, 3, 15. Interestingly, while they increase during the genesis of PanIN, they are not detected in PDA. Tuft cell formation is also characteristic of human pancreatitis and PanIN, suggesting a conserved, but currently undefined role in early tumorigenesis 2, 3.
To determine the role of tuft cells in pancreatic tumorigenesis we specifically eliminated tuft cells through genetic ablation of the tuft cell master regulator Pou2f3 6. We show here that pancreas-specific ablation of Pou2f3 prevents pancreatic tuft cell formation. Surprisingly, and in contrast to expectations from prior work, tuft cell ablation accelerates tumorigenesis. This suggests a protective role for tuft cells during tumor progression. We investigated the mechanisms underlying tuft cell function using small cell number RNA-sequencing, ultrastructural analyses, and metabolic profiling. These orthogonal strategies combined to produce a consistent picture in which tuft cell secretion of suppressive eicosanoids, such as prostaglandin D2 (PGD2), contribute to pancreas homeostasis and attenuation of disease progression.
Materials and Methods.
Mice.
Mice were housed in accordance with NIH guidelines in AAALAC-accredited facilities at the Salk Institute for Biological Studies. The Salk Institute IACUC approved all animal studies. LSL-KrasG12D/+; Ptf1aCre/+ (KC) and Hpgdsfl/fl mice have been previously described16, 17. FLARE25 (Il25F25/F25) mice were generously provided by the Locksley (UCSF, CA) and von Moltke laboratories (UW, WA)8. Pou2f3fl/fl (Pou) mice were generated using a classical gene targeting method with BA1 embryonic stem cells by homologous recombination, resulting in the deletion of 1303 base pairs from the Pou2f3 gene. Chimeric mice were generated by inGenious Targeting Laboratories, were mated to flippase mice and then the obtained neo-deleted heterozygous mice were crossed with C57BL6J mice to remove the flippase allele.
H&E scoring.
To assess disease progression in 6-month-old KC vs. KPouC, caerulein-treated KC vs. KPouC, or caerulein-treated KC vs. KHC, 10, 10x images were scored from 2 x H&E slides, separated by a minimum of 200 μm for each mouse.
Human pancreatitis samples.
Distribution and use of all human samples was approved by the Institutional Review Boards of the Translational Genomics Research Institute and the Salk Institute for Biological Studies.
Pancreatitis induction.
Pancreatitis was induced with caerulein (Bachem) administered intraperitoneally (IP). Wild-type, KC, KPouC, KCFLARE25, or KHC mice were given 250 μg/kg caerulein, once a day, for three consecutive days and were allowed to recover for two weeks.
Statistical analysis.
Statistical analyses, data processing and heatmap plotting were performed in R (https://www.r-project.org/) and/or Prism (GraphPad). Statistical significance was calculated by either two-tailed unpaired t-tests assuming equal variance or one-way ANOVA. Data are expressed as mean ± standard deviation.
Additional methods can be found in Supplemental.
Results:
Pou2f3 ablation accelerates tumorigenesis.
Transcription factor Pou2f3 is the master regulator of tuft cell formation in several organs, and its expression has recently been identified in PanIN6, 18, 19. We, therefore, used pancreas-specific Pou2f3 deletion as a genetic strategy to investigate tuft cell contribution tumor progression. The specificity of this strategy is supported by the fact that 99% of tuft cells in the LSL-KrasG12D;Ptf1aCre/+ (KC) mouse model of pancreatic tumorigenesis, identified by co-expression of tuft cell markers Cox1 and acetylated α-tubulin, express Pou2f3 (790/800 cells, 8 mice) (Figure 1A). Conversely, 93% of Pou2f3+ cells are definitively tuft cells by co-expression with Cox1 and acetylated α-tubulin (744/800 cells, 8 mice).
Figure 1. Pou2f3 and tuft cell ablation accelerates tumorigenesis.
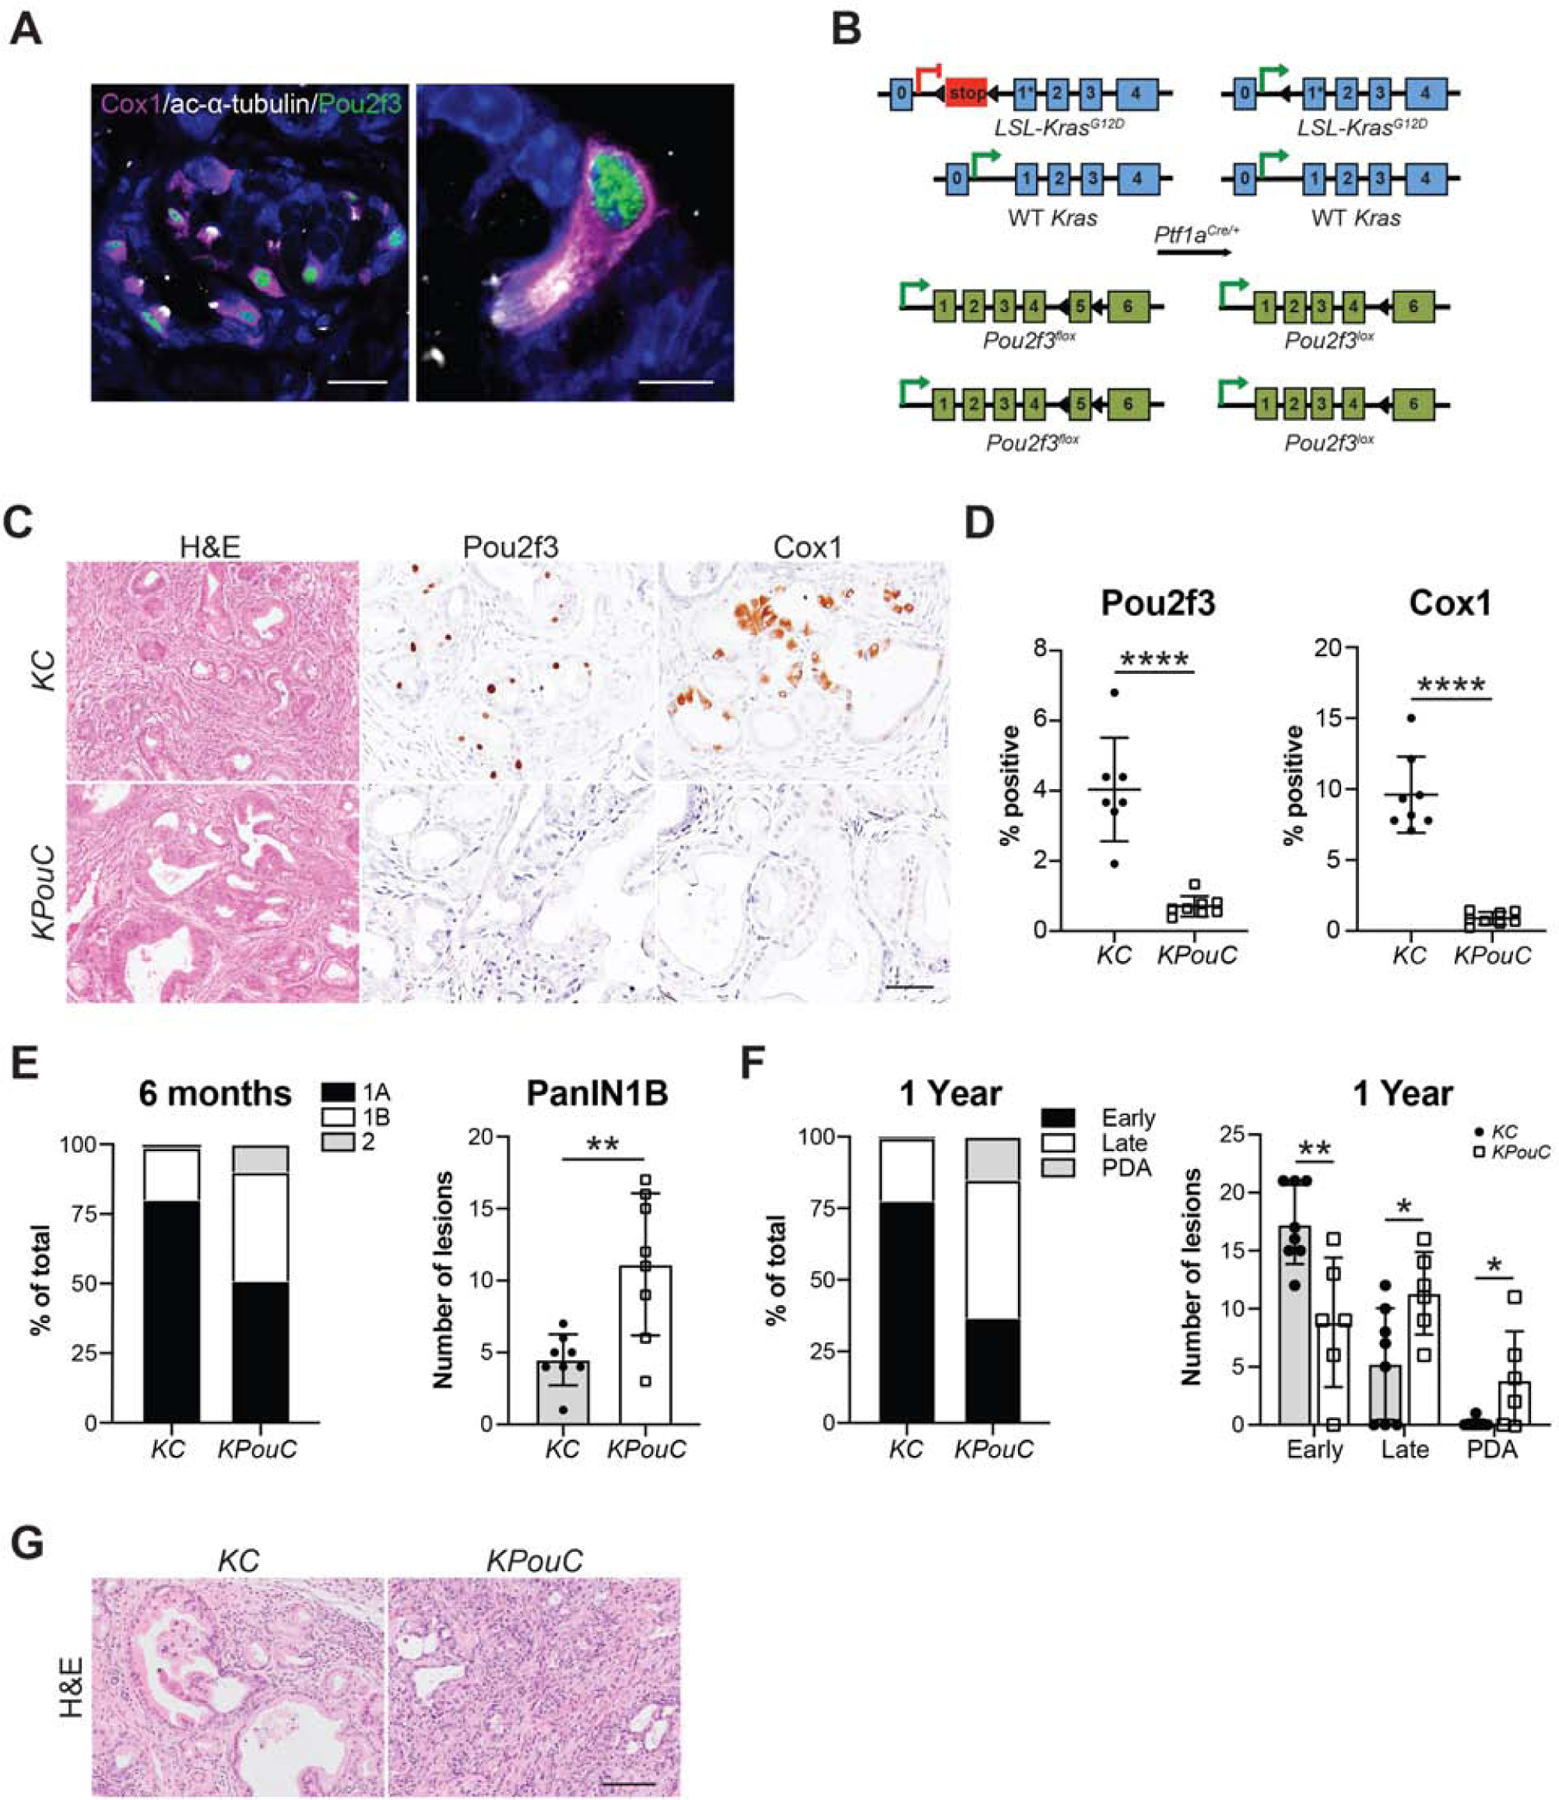
(A) Co-immunofluorescence for Pou2f3, green, and tuft cell markers Cox1, pink, and acetylated α-tubulin, white. Scale bars, 20 μm (left) and 5 μm (right). (B) Schematic of genetic modifications used to generate KPouC mice. Pancreas-specific Cre recombinase expression using Ptf1aCre/+ results in removal of a stop cassette preceding a G12D mutation on exon 1 of the Kras allele as well as removal of exon 5 of Pou2f3. Arrowheads, loxP sites. (C) H&E and histology of 6-month-old KC and KPouC mice for Pou2f3 and tuft cell marker Cox1. Scale bar, 50μm. (D) Quantification of Pou2f3 and Cox1 staining in (C). (E) PanIN distribution in 6-month-old KC and KPouC mice. (F) PanIN distribution in 12-month-old KC and KPouC mice. (G) H&E analysis of pancreata from 12-month-old KC or KPouC mice. Scale bar, 100μm. Early PanIN, PanIN1A and 1B; Late PanIN, PanIN2 and 3. *, p < 0.05; **, p < 0.01; ****, p < 0.001.
Previous studies of tuft cell function used full-body Pou2f3 knockout mouse models, which could generate phenotypes due to tuft cell-specific and/or collateral effects 6. To eliminate influences from Pou2f3 ablation outside the pancreas, we generated a floxed Pou2f3 mouse model enabling selective deletion in the pancreas (Figure 1B). Importantly, Pou2f3 is not expressed in the normal murine pancreas (Figure S1A). Consequently, pancreata from Pou2f3fl/fl;Ptf1aCre/+ (PouC) were normal in size and contained intact exocrine and endocrine compartments with no overt pathology (Figure S1B–C). Pou2f3fl/fl mice were bred into the KC model to generate KPouC mice. Age-matched KC and KPouC mice were sacrificed at 6 or 12 months of age and examined histologically. Pancreas-specific Pou2f3 deletion was confirmed by immunohistochemistry (IHC) (Figure 1C–D). We then confirmed tuft cell deletion using IHC for multiple accepted tuft cell markers (Cox1, Siglec f, Trpm5, Vav1, and Hpgds; Figure 1C–D, Figure S2A). Notably, Dclk1 was still expressed in KPouC pancreata, demonstrating that expression is not tuft cell-specific (Figure S2A)20, 21. Similarly, Cox2, which is expressed in intestinal and pancreatic tuft cells, was retained in the epithelium of KPouC mice, demonstrating that it too is not tuft cell-specific in the diseased pancreas (Figure S2A)3, 22. Consistent with the pancreas specificity of this knockout model, we readily detected tuft cells and associated expression of Pou2f3, Dclk1, Cox1, Trpm5, and Vav1 in the intestines of KPouC mice (Figure S2B). Importantly, the lack of tuft cells in the pancreata of KPouC mice demonstrates that these cells do not migrate into the tissue during disease progression, but rather arise locally.
Although tuft cells are rare in the pancreata of 6-month-old KC mice, their absence in KPouC mice resulted in accelerated tumorigenesis (Figure 1E–G). PDA can originate from metaplasia that has progressed through several steps of neoplasia (PanIN1A, PanIN1B, PanIN2, PanIN3) characterized by increasing nuclear atypia and loss of cellular polarity. Pathologist assessment of pancreata from 6-month-old mice by H&E from each cohort (n = 8 for each group) revealed significantly more PanIN1B (p < 0.01; 39% of graded lesions vs. 19%) and more PanIN2 (10% of graded lesions vs. 1.2%) in KPouC mice as compared to control KC mice (Figure 1E). By 12 months, KPouC mice (n = 6) had significantly more PanIN2 (p < 0.05; 35% of graded lesions vs. 18%) and incidence of PDA (p < 0.05; 16% of graded lesions vs. 0.6%; 67% of mice as compared to 12.5%) than age-matched KC mice (n = 8) consistent with the hypothesis that Pou2f3 and tuft cell ablation accelerates pancreatic tumorigenesis (Figure 1F–G).
Pou2f3 ablation enhances pancreatic injury.
Given the known expression of inflammatory regulators in tuft cells, we next investigated the impact of tuft cell loss on pancreas disease progression in the context of injury. We addressed this issue by treating 6-week-old KC (n = 6) and KPouC (n = 13) mice with a short course of caerulein, to induce acinar cell injury, and allowed them to recover for only two weeks (Figure 2A). Blinded, pathologist-scored H&E analysis of pancreata from treated mice shows accelerated disease progression in KPouC mice, consistent with analyses conducted on aged mice (Figure 1). As compared to KC mice, KPouC mice had significantly less PanIN1A (p < 0.05; 49% of graded lesions vs. 63%), with a corresponding increase in PanIN1B (p < 0.01; 32% of graded lesions vs. 11%) demonstrating accelerated disease progression even at this early time point (Figure 2B–C). Immunohistochemical evaluation revealed significantly less normal tissue (amylase+, p < 0.001) and more extracellular matrix deposition (hyaluronan+, p < 0.05; collagen, p = 0.12) in KPouC mice as compared to KC mice, reflecting greater injury (Figure 2B,2D; S3A–B). Analysis of a subset of these mice (KC, n=3; KPouC, n=6) demonstrated significantly more apoptotic cells (cleaved caspase 3+, p < 0.05) and fewer proliferating cells (Ki67+, p < 0.01) in KPouC pancreata as compared to KC (Figure S3A–B).
Figure 2. Tuft cell ablation exacerbates pancreatic injury.
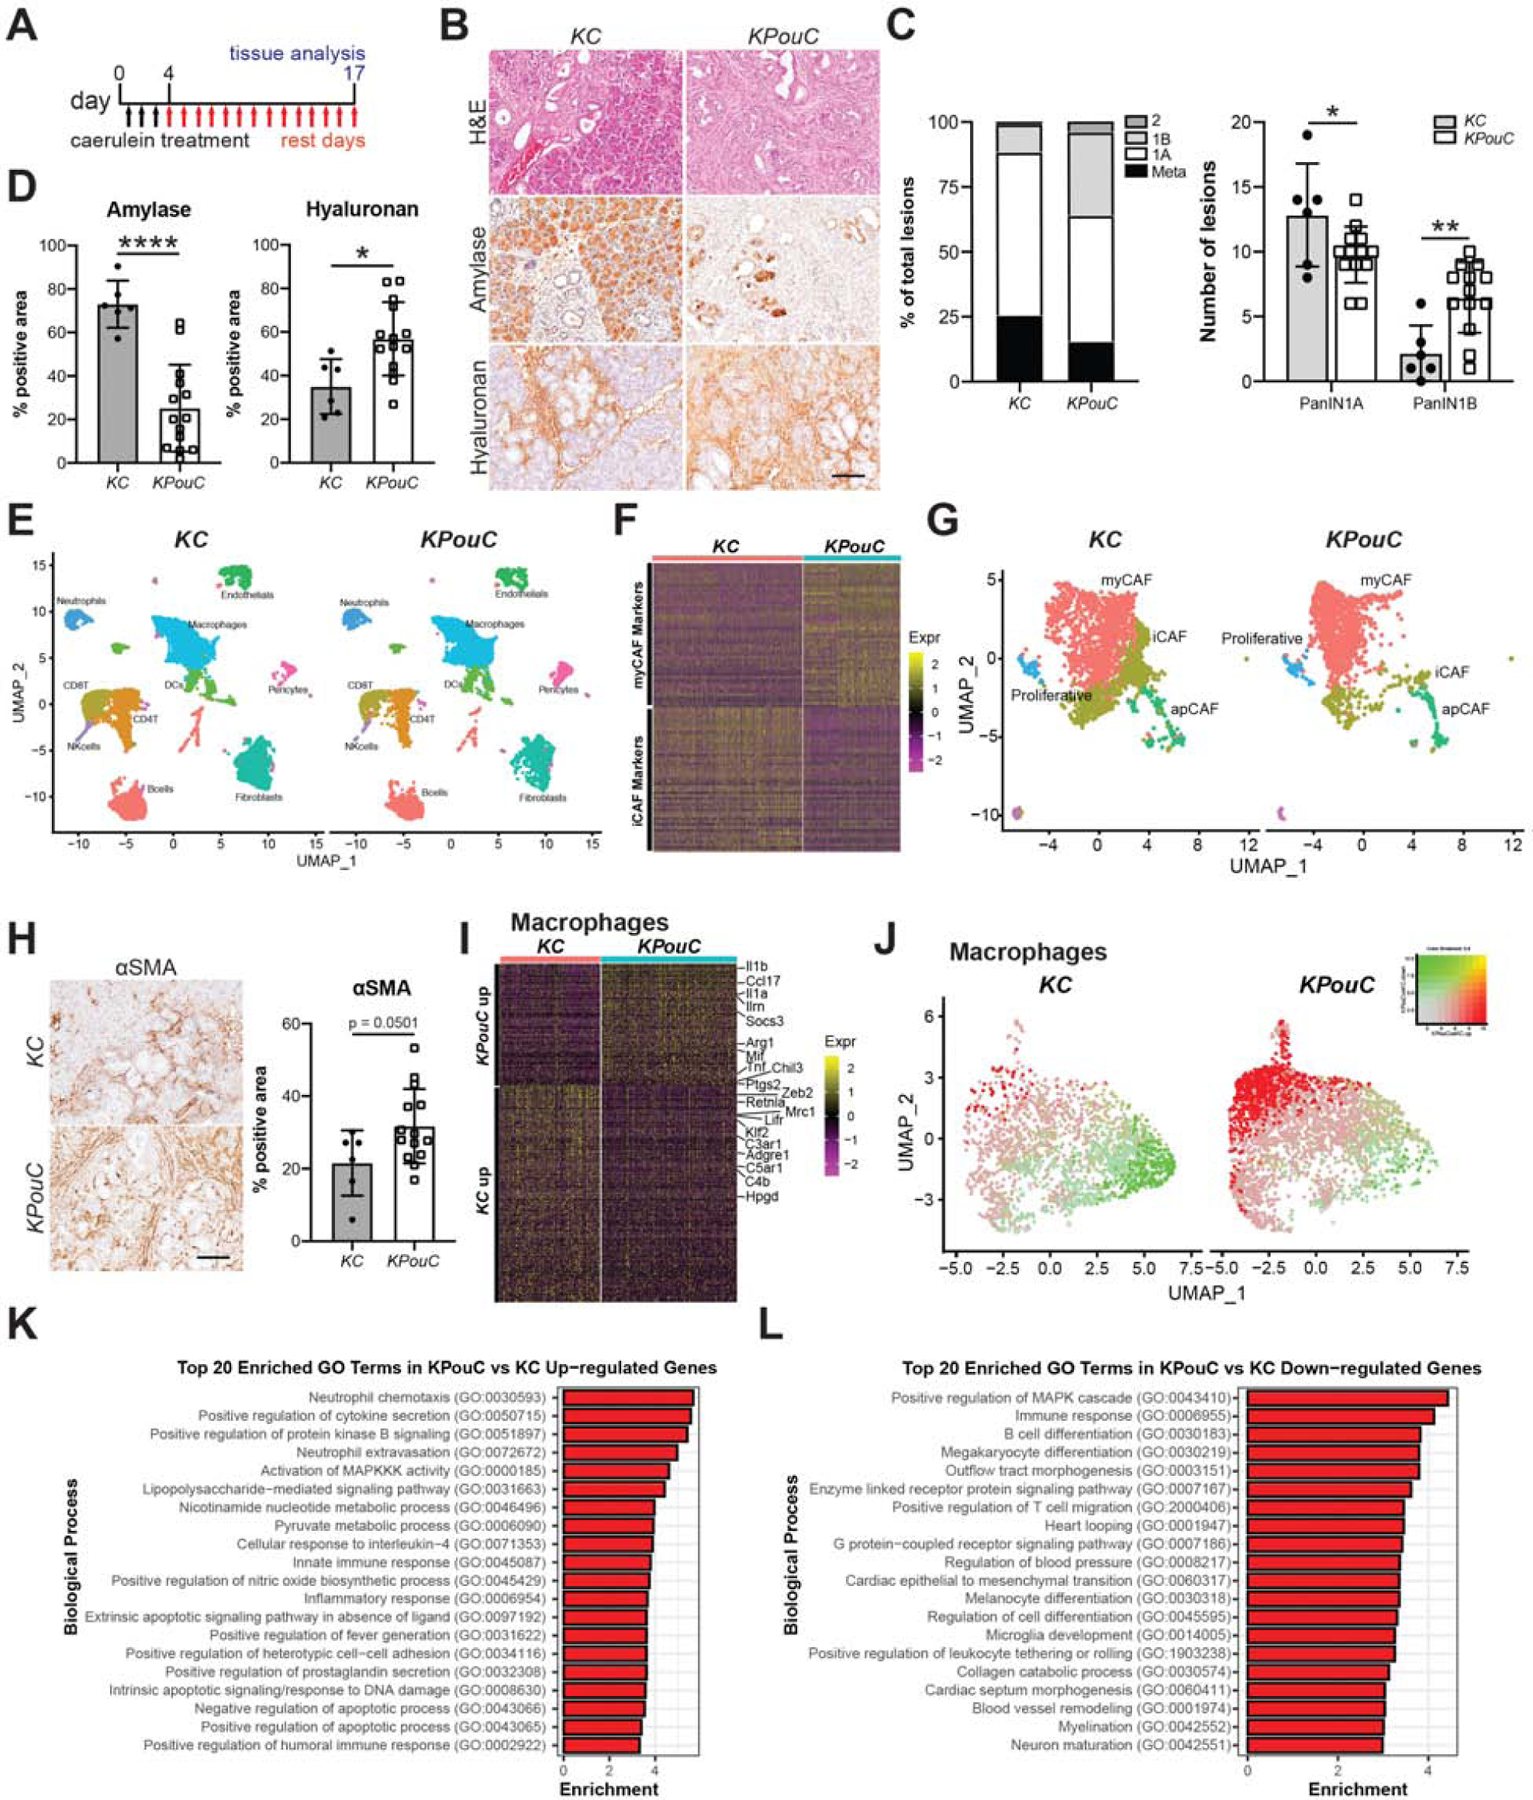
(A) Schematic for caerulein treatment of KC and KPouC mice. (B) H&E analysis and immunohistochemistry for acinar cell marker amylase and extracellular matrix component hyaluronan, both brown. (C) PanIN distribution in caerulein-treated KC and KPouC mice. (D) Quantification of histology shown in (B). (E) UMAP showing annotated clusters of stromal populations in injured KC and KPouC pancreata. (F) Heat map showing the top 50 most highly expressed genes described for the myCAF and iCAF subtypes in KC and KPouC fibroblasts. (G) UMAP of fibroblasts from KC and KPouC mice with myCAF, iCAF, apCAF, and proliferative fibroblast RNA signatures overlaid. (H) IHC and quantification for myCAF marker αSMA in KC and KPouC mice. (I) Heat map of the top 100 differentially expressed genes between KPouC and KC macrophages. (J) UMAP of KC and KPouC macrophages overlaid with the module score of KPouC vs. KC up-regulated and down-regulated genes (shown in (I),red and green, respectively). (K) Top 20 enriched gene ontology terms in KPouC up-regulated and (L) down-regulated genes. *, p < 0.05; **, p < 0.01; ****, p < 0.001.
To determine how tuft cell ablation affects stromal cell infiltration and polarization, we again treated 6-week-old KC (n = 3) and KPouC (n = 2) mice with caerulein (Figure 2A). We then conducted FACS (fluorescence-activated cell sorting) for EpCAM-neg;Cd45+ immune cells and EpCAM-neg;Cd45-neg stromal cells and performed Drop-seq single cell RNA sequencing (scRNA-seq). Approximately 4500 cells/mouse were recovered; data from all 5 mice were combined and characterized by clustering. Clusters were annotated by examining gene signatures derived from previously published mouse pancreas scRNA-seq data (Figure 2E, S4, see methods)23. Pancreatic stellate cells/fibroblasts were identified by enrichment of established markers, such as Col1a1, Col3a1, Dcn, and Lox. A total of 368 differentially expressed genes (DEGs) were identified between the two genotypes. To examine polarization of this population, we overlaid the myCAF (myofibroblastic cancer-associated fibroblast), iCAF (inflammatory CAF), and apCAF (antigen presenting CAF) signatures previously described in pancreatic cancer onto our data 23. As shown in Figure 2F–G, we found significant enrichment of the iCAF signature in KC pancreata, whereas KPouC fibroblasts were largely identified as Acta2+ myCAFs. To confirm these findings, we conducted IHC for αSMA (Acta2) and found that myCAFs are indeed enriched in injured KPouC pancreata (p = 0.0501; Figure 2H).
We evaluated immune cell polarization by examining gene expression in macrophages (Csf1r, Fcgr1, Mrc1, Lyz2, Cd68+ clusters) between the two genotypes. We identified 445 DEGs within the macrophage population between KC and KPouC pancreata (Figure 2I–J; File S1). DEG analysis shows significantly higher expression of anti-inflammatory markers Adgre1 (F4/80) and Mrc1 (CD206) in KC macrophages, whereas those associated with KPouC expressed higher levels of cytokines such as Il1b, Il1a, Ccl17, and Tnf (Figure 2I; File S1). Consistent with these data, we also saw increases in the production of cytokines CCL17, TNFα and IL-1β in KPouC monocytes in vitro by an ELISA-based approach (data not shown). To agnostically interrogate the differences between KC and KPouC macrophages, we conducted Gene Ontology (GO) analysis on DEGs. KPouC macrophages are significantly enriched for pro-inflammatory terms such as ‘neutrophil chemotaxis’, ‘positive regulation of cytokine secretion’, ‘lipopolysaccharide-mediated signaling pathways’, and ‘innate immune response’ (Figure 2K). The KC macrophage gene expression profile, in contrast, is significantly enriched for GO terms associated with adaptive immunity and healing such as ‘B cell differentiation’, ‘positive regulation of T cell migration’, and ‘negative regulation of neuroinflammatory response’ (Figure 2L).
Collectively, these data are consistent with our histochemical studies identifying enhanced injury and accelerated disease progression in caerulein-treated KPouC mice. Further work is required to determine if these mice suffer greater injury or an inability to heal and to uncover the functional consequences of these shifts in immune cell infiltration.
Transcriptomic analysis of tuft cells identifies lipid synthesis and metabolism pathways.
Our results indicate that while tuft cells are rare, they play an important role in pancreatic disease progression by moderating early stromal responses to tissue injury. We next used RNA-sequencing to gain insight into potential mechanisms by which pancreatic tuft cells restrain tumorigenesis. As KC tuft cells are rare, we used FACS for Siglec f to isolate enough cells to perform low cell number RNA-seq. While Siglec f labels Cd45+ eosinophils, it is also expressed in intestinal tuft cells (100%+, 158/158 cells, 3 mice) 6, 22 and in pancreatic tuft cells in KC mice (99%+, 300/301 cells, 3 mice), but is not expressed in the epithelium of KPouC mice (Figure 3A, S2A). Using FACS, we identified significantly more Siglec f+;EpCAM+ cells in 8–10 month old KC mice (~1.8% of the epithelium, range 1.0%−4.6%, n = 5) than in normal pancreas (0.001%, n = 5), consistent with histological studies (Figure S5A) 3.
Figure 3. Transcriptomic analysis of KC tuft cells identifies lipid synthesis and metabolism pathways.
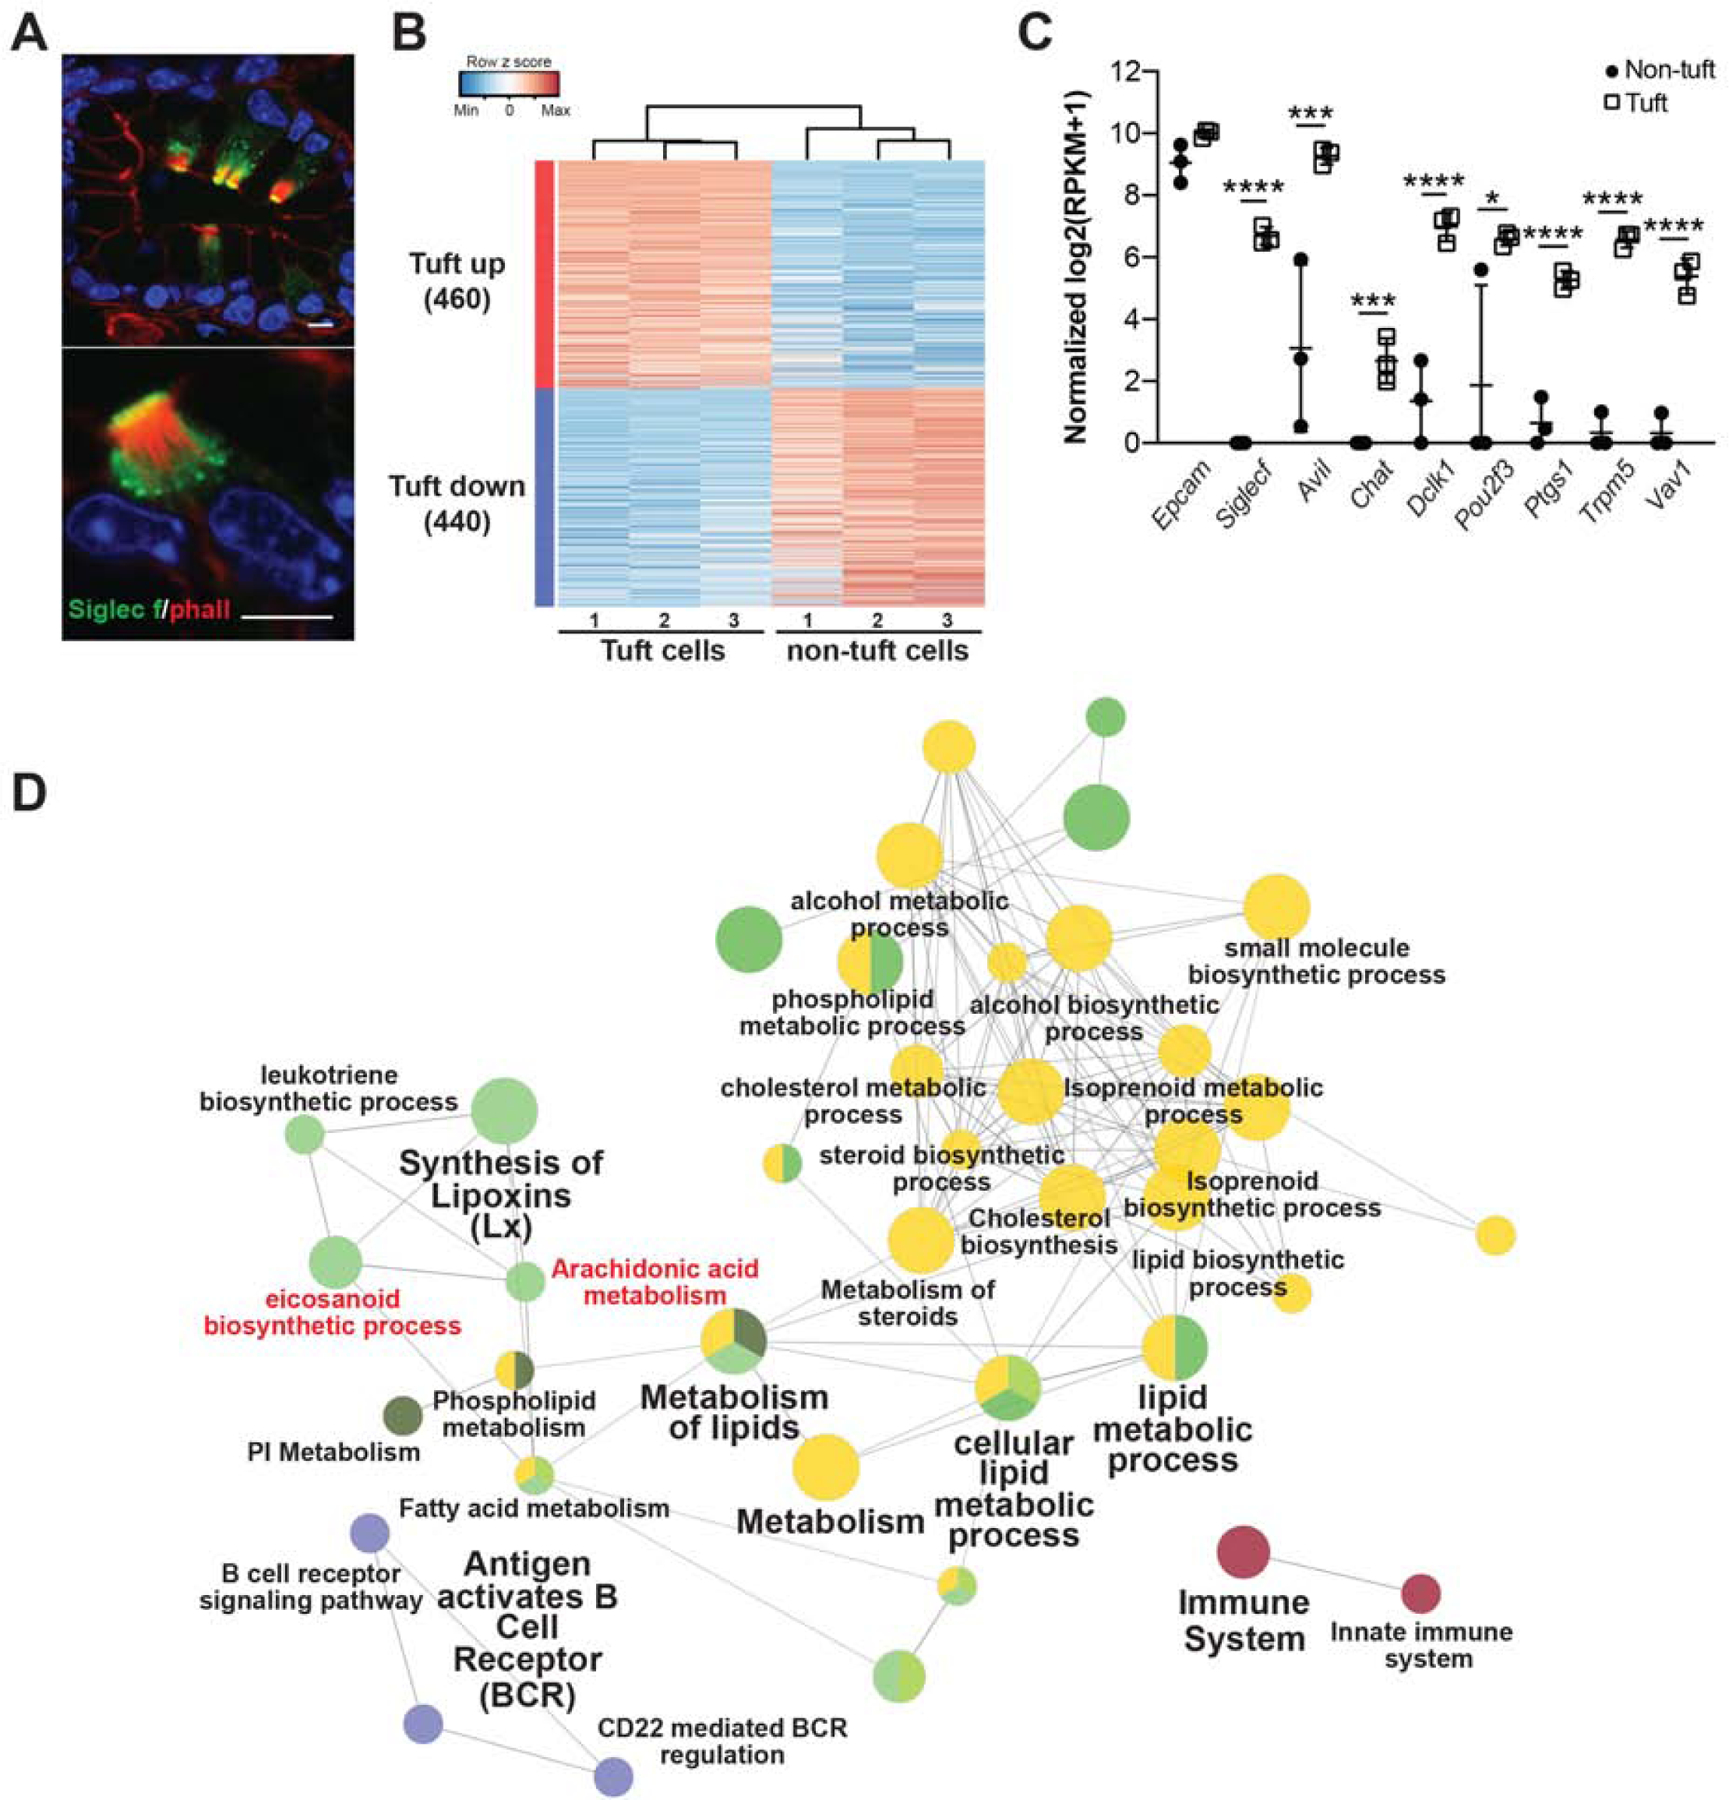
(A) Co-immunofluorescence for phalloidin (red, labels the microvilli and actin rootlets of tuft cells) and Siglec f, green, in the KC pancreas. Scale bars, 5 μm. (B) Heat map with hierarchical clustering showing differentially expressed genes in Siglec f+;EpCAM+ tuft cells as compared to Siglec f-neg;EpCAM+ non-tuft epithelial cells. (C) Confirmation of Siglec f expression and tuft cell markers in sorted Siglec f+;EpCAM+ cells. n = 3 mice. (D) Biological role of tuft-up regulated genes visualized with ClueGO. Nodes represent enriched GO terms, and the size of the nodes reflects the statistical significance of the terms. The edges reflect the connectivity between GO terms (kappa statistics). GO terms are grouped into functions groups (in different colors) based on shared genes and the cohen’s kappa coefficient statistics. *, p < 0.05; ***, p < 0.005; ****, p < 0.001.
We isolated 100 Siglec f+;EpCAM+;Cd45-neg tuft cells and an equivalent number of Siglec f-neg;EpCAM+;Cd45-neg non-tuft epithelial cells by FACS from KC mice (n = 3). We then generated the cDNA library using the SmartSeq2 protocol to enable deep sequencing and comprehensive characterization of these small cell populations 24. RNA-seq identified 900 genes differentially expressed between Siglec f+;EpCAM+;Cd45-neg and Siglec f-neg;EpCAM+;Cd45-neg populations (p<0.05 and average fold change>4) (Figure 3B). Tuft cell enrichment was confirmed in the Siglec f+ population by expression of markers such as Pou2f3, Ptgs1 (Cox1), Trpm5, and Vav1, and low to no expression of acinar cell markers, such as Ptf1a, or islet cell markers, such as Chga (Figure 3C, S5B–C, File S2) 3, 6, 25. Furthermore, highly expressed genes in the Siglec f-neg population were enriched for gene sets associated with digestion, consistent with acinar and islet cell function (Figure S5D).
We then applied this small cell number sequencing approach to normal intestinal tuft cells to assess their similarity to pancreatic tuft cells. We found that both intestinal and pancreatic tuft cell signatures significantly overlap with single cell intestinal tuft cell sequencing data, validating our approach (Figure S6, File S2) 26. To further validate the use of Siglec f to isolate tuft cells from PanIN, we sorted 116 Siglec f+;EpCAM+;Cd45-neg cells from the pancreata of KC mice and conducted single cell sequencing by Smartseq2. We found significant enrichment of tuft cell markers identified by our bulk RNA-seq analysis in 88% (102/116) of these cells (FDR<0.05), confirming that Siglec f labels tuft cells in the pancreas (Figure S7).
Consistent with gene expression patterns identified in tuft cells from other systems, we identified expression of taste-signaling components (Trpm5, Gnat3) and synaptic signaling markers (Snap29, Nrgn, Gabra1, Chat) in KC tuft cells (File S2) 22, 27, 28. Importantly, and in contrast with data obtained from intestinal tuft cells, Il25 and Sucnr1 were not measurably expressed (Figure S8, File S2). These data imply organ and/or context-specific tuft cell gene expression.
Network analysis of genes differentially expressed in KC tuft cells as compared to non-tuft epithelial cells highlighted a role in inflammation and identified pathways associated with lipid synthesis and metabolism, including eicosanoid biosynthesis and metabolism (Figure 3D). Eicosanoids are secreted inflammatory lipid mediators with known roles in tumor progression. These data suggest that eicosanoid synthases expressed in tuft cells (Cox1, Cox2) are not merely markers, but may also play a functional role.
Lipid droplets may serve as sites of eicosanoid synthesis in KC tuft cells.
To ascertain any structure-function relationships in pancreatic tuft cells, we conducted detailed ultrastructural analyses using scanning electron microscopy (SEM) and serial block-face electron microscopy (SBFEM). SEM analysis of pancreata from year-old KC mice captured the topography of PanIN including the long, blunt microvilli characteristic of tuft cells (Figure 4A). Tuft cells (apical surface area = 27.84 ± 7.55 μm2, 10 cells) were identified by microvilli (390 ± 143 per cell, 10 cells) width (215.9 ± 46.36 nm, 10 cells, 120 microvilli) and length (567.48 ± 144.18 nm, 10 cells, 100 microvilli) (n = 2 mice). We also noted the possible budding of vesicles from tuft cell microvilli, suggesting an active secretory role for PanIN tuft cells (Figure 4A, S9A–B) 29.
Figure 4. Lipid droplets may serve as sites of eicosanoid synthesis in KC tuft cells.
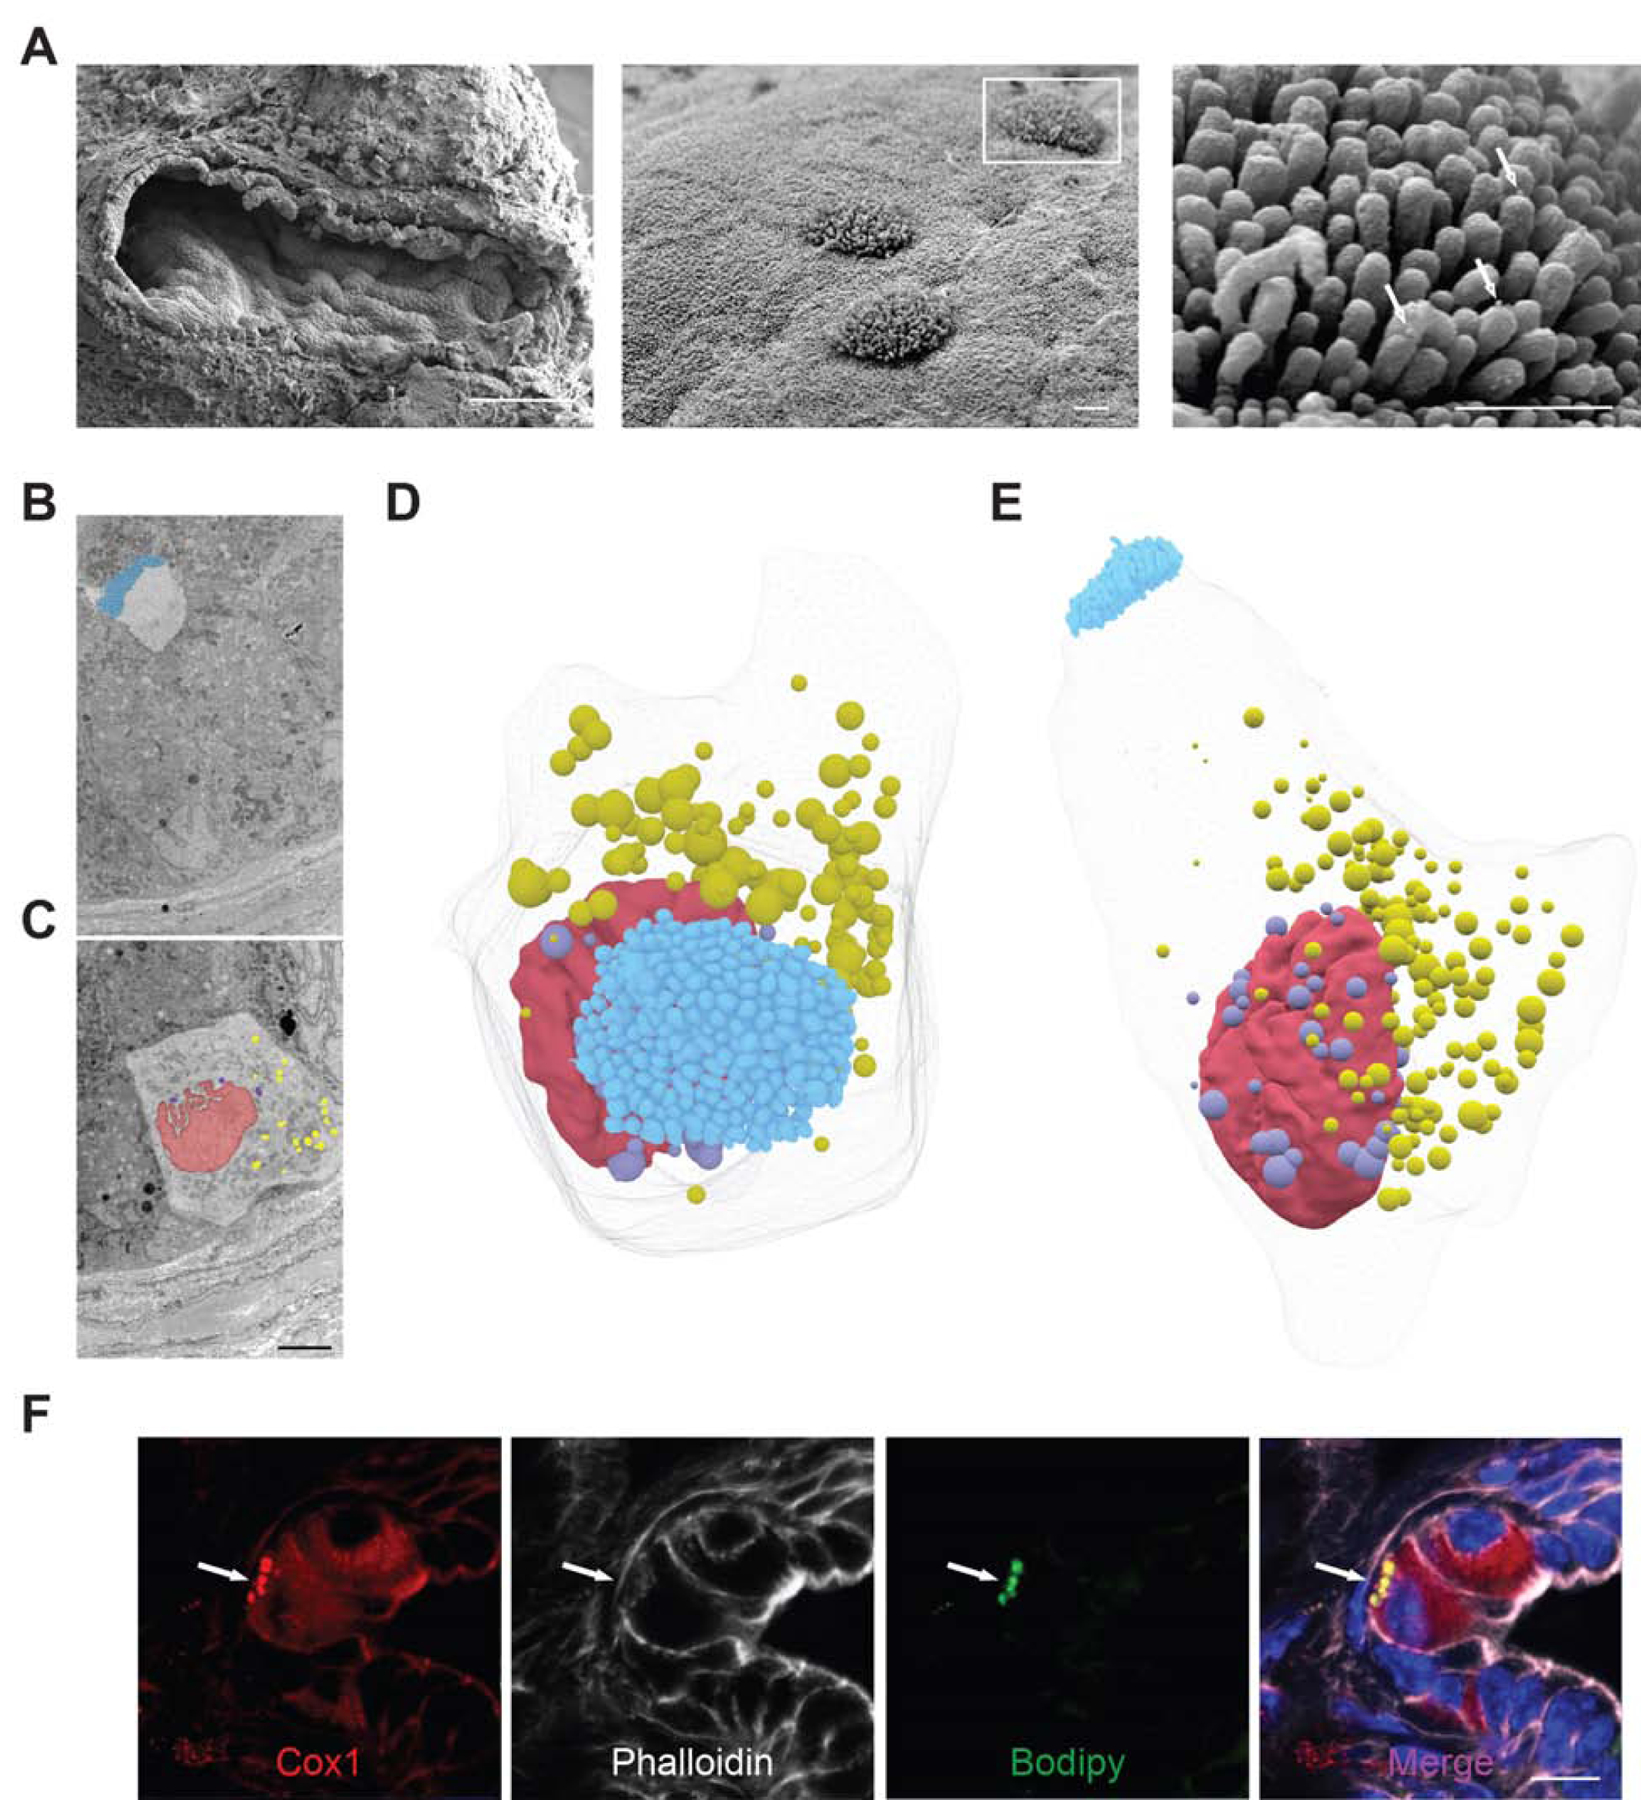
(A) SEM of PanIN from a year-old KC mouse (left panel, scale bar 100 μm) highlighting the tall, blunt microvilli of tuft cells (center panel), from which secretory vesicles appear to be budding (white arrows, right panel; center and right panel scale bars, 1μm). (B) Sections 45 and (C) 287 of 489, 100 nm sections through a single tuft cell captured by SBFEM highlighting the tuft cell microvilli, blue, and nuclear, violet, and cytoplasm, yellow, associated lipid droplets. Nucleus, red. Scale bar, 5μm. (D-E) 3D reconstruction of all 489 of these sections (F) Co-immunofluorescence for tuft cell marker and eicosanoid synthase Cox1, red, phalloidin, white, and lipid droplet marker bodipy, green. Scale bar, 10 μm.
Identification of tuft cells by apical microvilli captured in a single plane obscures any information that may be gathered about peri-nuclear and basal structures. To more completely evaluate pancreatic tuft cell ultrastructure, we performed SBFEM on PanIN from 6- and 12-month old KC mice. SBFEM uses an ultramicrotome mounted inside of a SEM to iteratively remove ultra-thin sections (<100 nm) of a resin embedded sample (or block) and images the newly revealed blockface with each slice. We captured 8 PanIN stacks to reveal the 3D ultrastructural qualities of tuft cells, capturing both the apical microvilli (Figure 4B) and the basal cytoplasmic constituents (Figure 4C) of the same cell. Segmentation and 3D reconstruction of the processed image stack revealed the novel observation of over 180 peri-nuclear and cytoplasmic lipid droplets (Figure 4C–E, S9C–D, Movie S1). Lipid droplets are compact organelles, which appear as dark, roughly spherical structures when imaged by SBFEM. Of the 8 PanIN stacks acquired (500–1000, 80–100 nm slices per stack), 4 had tuft cells. In total, 9 tuft cells were identified and analyzed and all had peri-nuclear and cytoplasmic lipid droplets (n = 3 mice) (movie S2). We confirmed these EM observations by conducting co-IF for tuft cell markers (Cox1, acetylated α-tubulin, and Dclk1) and the lipid marker Bodipy (Figure 4F, S10) and detected lipid droplets in 63% of KC tuft cells (188/300 cells, 3 mice). As lipid droplets may be obscured by the 2D nature of this analysis or may be below the visual detection limit, it is possible that they were also present in the other 37% of tuft cells.
Lipid droplets have traditionally been thought of as innocuous lipid storage organelles, but recent data emphasize their role as dynamic players in lipid metabolism and immune regulation 30. In fact, they have been reported to serve as inducible sites of eicosanoid synthesis in inflammatory cell populations 31, 32. Co-localization of Cox1 and Bodipy suggests that pancreatic tuft cell lipid droplets may serve as sites of eicosanoid synthesis (Figure 4F). Interestingly, Cox1 localizes to the nuclear membrane in tuft cells, and a number of lipid droplets were observed to associate closely with the nucleus (Movie S2). Although mechanisms of tuft cell eicosanoid secretion have yet to be elucidated, the basal localization of lipid droplets and their contact with the dense tubulin network within tuft cells suggest that secretion may occur basally and/or apically (Figure S10).
Eicosanoid expression in pancreatic neoplasia.
Our RNA-seq analysis of KC tuft cells demonstrates significant enrichment of eicosanoid synthases, including lipoxin, leukotriene, and prostaglandin synthases (Figure S11A–C). We determined which eicosanoids are present in pancreatic neoplasia by analyzing a comprehensive panel of 157 eicosanoids in whole tissue from age-matched wild type and 8–10-month-old KC mice by mass spectrometry. Shown in Figure 5A are the top 10 eicosanoids differentially expressed between wild type (n = 3) and KC (n = 5) pancreata. Interestingly, prostaglandin D2 (PGD2) was present at extraordinarily high levels (369 +/− 102 pmol/mg) in KC pancreata (Figure 5A, File S3). We and others have demonstrated the expression of hematopoietic prostaglandin D2 synthase (Hpgds) in tuft cells, which was confirmed here by RNA-seq (Figure S11B) 3, 22, 33. Hpgds generates PGD2 downstream from the Cox1 and Cox2 (Ptgs1 and Ptgs2) product PGH2 (Figure 5B). Hpgds expression is absent from the epithelium of KPouC mice by IHC, indicating that epithelial Hpgds is tuft cell-specific (Figure S2A). Importantly, mass spectrometry on pancreata from 6-month-old KPouC mice and age-matched KC mice revealed a 72% decrease in PGD2 levels (p < 0.01; 695 +/− 296 vs. 195 +/− 164 pmol/mg) between the two genotypes (Figure 5C), suggesting that a significant amount of PGD2 derives from tuft cell-specific synthesis and secretion. Moreover, there was also a significant decrease in PGD2 derivatives 13,14-dihydro-15-keto PGD2 and PGJ2 (both p < 0.05; Figure S12). There was no significant change in 5- or 12-HETE levels, though there was a trend towards higher levels of pro-tumorigenic prostaglandin E2 (PGE2) levels in KPouC mice (Figure S12).
Figure 5. Tuft cell-derived PGD2 suppresses pancreatic tumorigenesis.
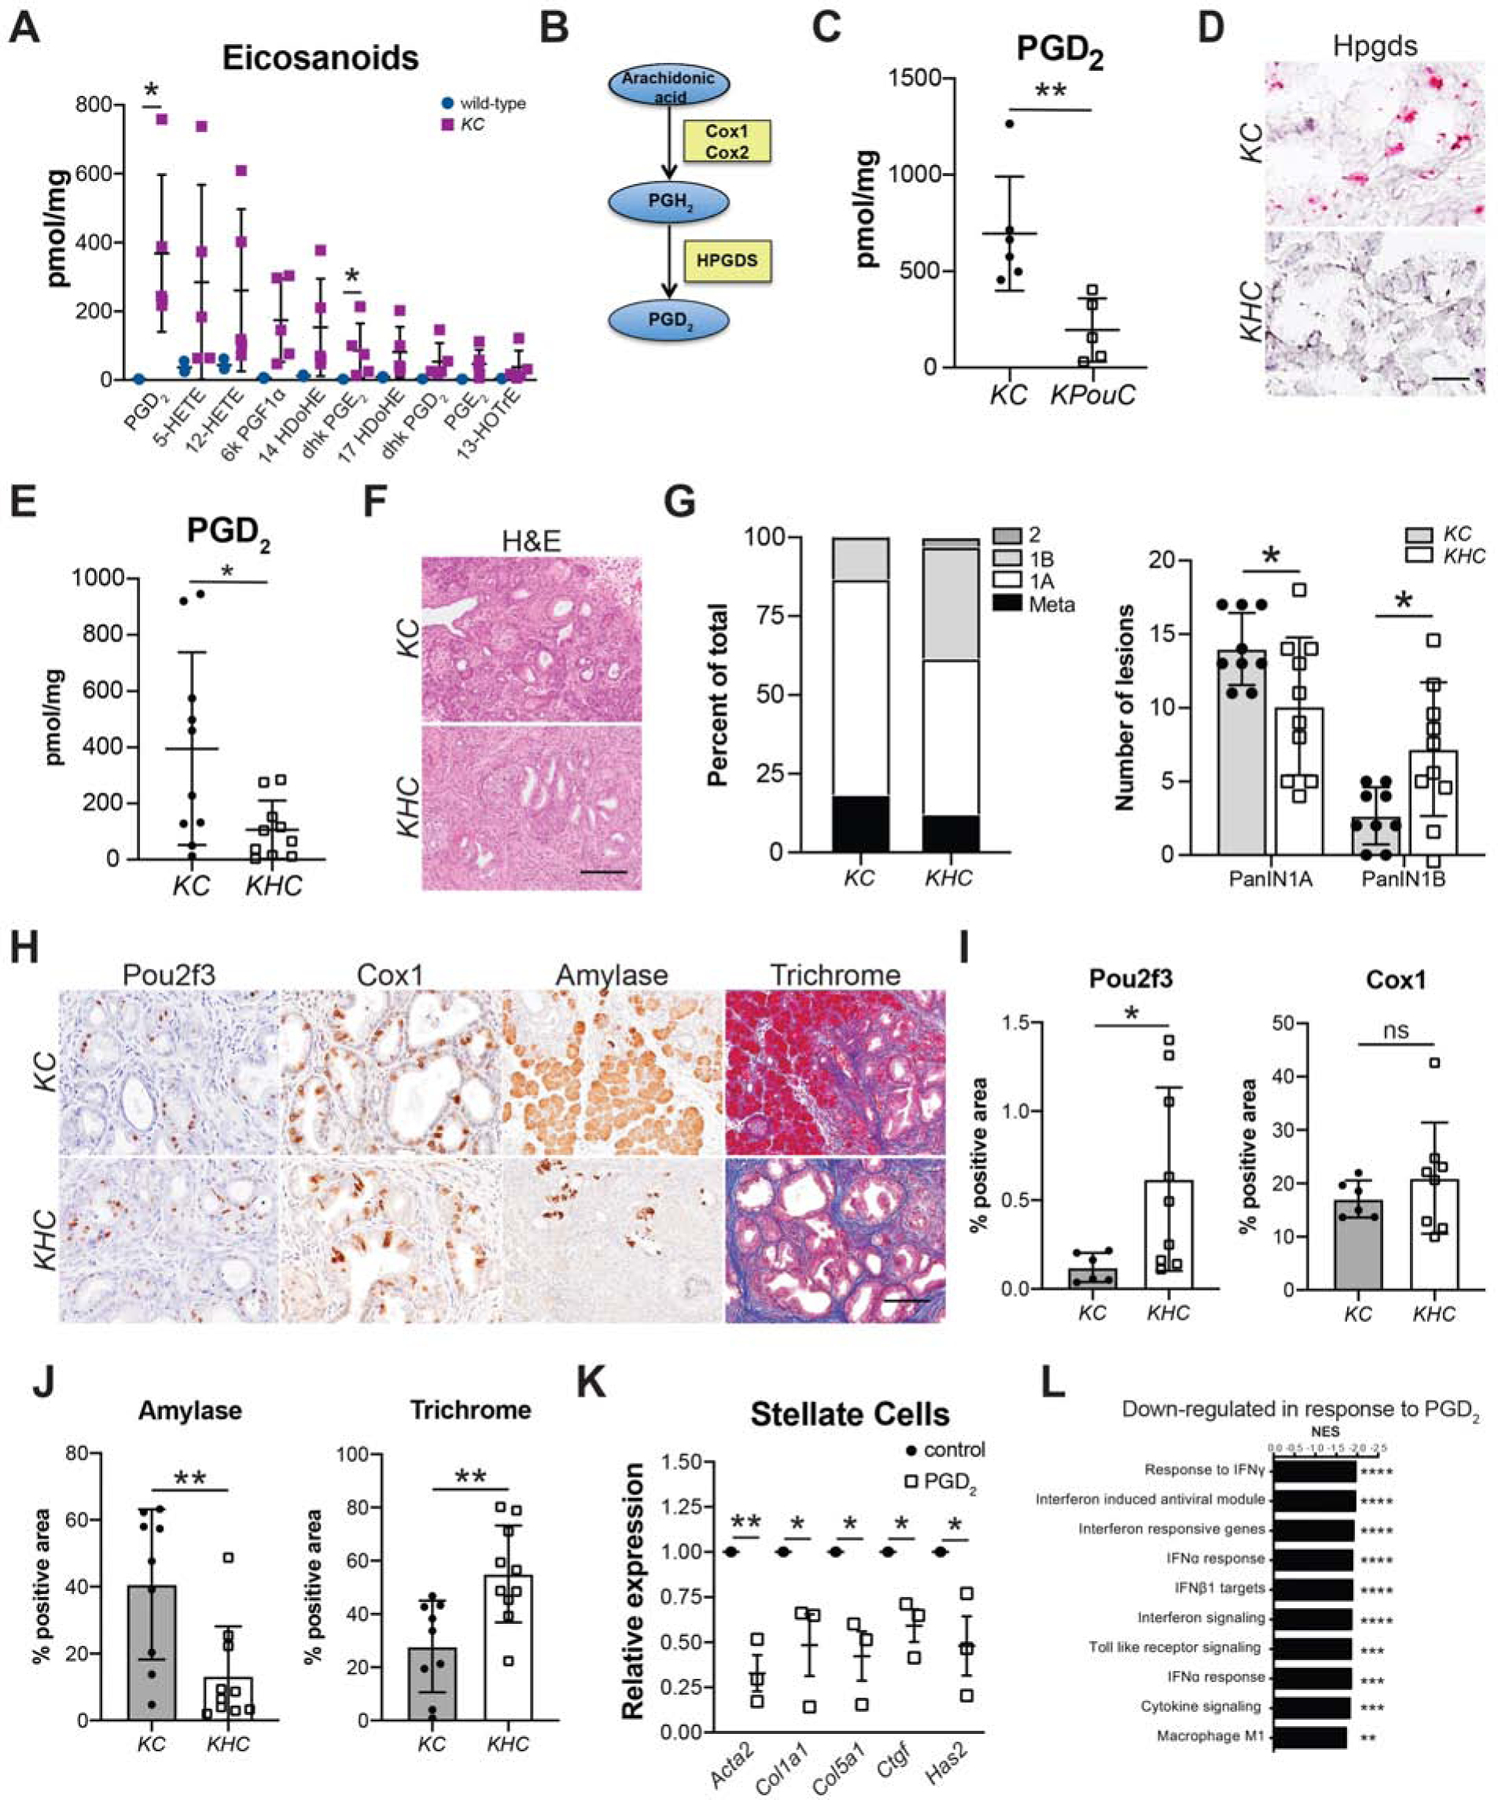
(A) Eicosanoid expression profiling of whole pancreas tissue from 8–10-month-old wild type or KC mice. (B) Pathway of PGD2 synthesis from arachidonic acid. Blue ovals, prostaglandins; yellow boxes, synthases. (C) PGD2 levels in 6-month-old KC or KPouC mice. (D) RNA in situ hybridization for exons 2–3 of Hpgds, pink, in KC and KHC mice. Scale bar, 25μm. (E) PGD2 levels in caerulein-treated KC or KHC mice. (F) H&E and (G) PanIN distribution in KC and KHC mice. (H) IHC for tuft cell markers Pou2f3 and Cox1 and acinar cell marker amylase (all brown) and trichrome staining (collagen, blue). Scale bar, 50μm for Pou2f3 and Cox1 and 100μm for amylase and trichrome. (I) Quantification of Pou2f3 and Cox1 IHC and (J) amylase and trichrome staining shown in (H). (K) RT-qPCR of pancreatic stellate cells treated with control MeAOc or PGD2. (L) GSEA analysis of genes down regulated in LPS+PGD2 treated bone marrow macrophages as compared to LPS+MeAOc treatment. *, p < 0.05; **, p < 0.01; ***, p < 0.005; ****, p < 0.001; ns, not significant.
PGD2 has an extremely short half-life and has been shown to act locally 34. This begs the question of the relevance of epithelial, tuft cell-derived PGD2 to disease progression. We addressed this question by breeding a floxed Hpgdsfl/fl allele into the KC model of pancreatic tumorigenesis to generate KHC mice (Figure S13A). This model selectively loses pancreatic epithelial Hpgds while maintaining stromal expression. Pancreata from Hpgdsfl/fl;Ptf1aCre/+ (HC) mice contain intact exocrine and endocrine compartments with no overt pathology (Figure S13B). Six-week-old KHC (n = 10) and control KC mice (n = 9) from the same colony were given a short course of caerulein and were sacrificed two weeks later as done for the studies presented above (Figure 2A). Hpgds deletion was confirmed in KHC mice by in situ hybridization (Figure 5D, S13C) and RT-qPCR of isolated epithelial cells collected by FACS (Figure S13D). To determine if the deletion of epithelial-specific Hpgds is sufficient to decrease total PGD2 levels, we conducted mass spectrometry on pancreata from KHC mice and treatment-matched KC mice. We found a 73% decrease in PGD2 levels (p < 0.05; 395 +/− 343 vs. 107 +/− 104 pmol/mg) between the two genotypes (Figure 5E). Again, there was no significant difference in either 5- or 12-HETE levels, but pro-tumorigenic PGE2 levels were higher in KHC mice (p = 0.06; Figure S14). Consistent with the phenotype determined in KPouC mice, pathologist-scored H&E analysis revealed significantly less PanIN1A (p < 0.05; 49% of scored lesions vs. 69%) and significantly more PanIN1B (p < 0.05; 35% of scored lesions vs. 13%) in KHC mice as compared to control KC mice (Figure 5F–G). Hpgds is not required for tuft cell formation as KHC mice still form tuft cells, as identified by IHC for markers Pou2f3 and Cox1 (Figure 5H–I). Epithelial Hpgds ablation resulted in greater pancreatic injury, including significantly less normal tissue (amylase+, p < 0.01) and more extracellular matrix deposition (collagen, p < 0.01) (Figure 5H and 5J; S13E–F), similar to the phenotype identified in KPouC mice (Figure 2). Collectively, these data are consistent with tuft cell suppression of pancreatic tumorigenesis occuring, in part, through secretion of Hpgds-derived PGD2.
PGD2 restrains disease progression by promoting environmental homeostasis.
Elevated expression of stromal αSMA and myCAF polarization in KPouC mice, as compared to KC mice (Figure 2F–H), suggests that loss of tuft cell PGD2 secretion may contribute to pancreatic stellate cell (PSC) activation. We addressed this possibility by treating primary, activated murine PSCs with prostaglandins in vitro. Treatment with PGE2, as a pro-inflammatory control, increased expression of activation markers such as Acta2 (αSMA) and growth factors such as Ctgf as determined by RNA-seq and confirmed by RT-qPCR (Figure S15A–C). By contrast, PGD2 treatment significantly decreased Acta2 expression, as determined by RNA-seq and confirmed by RT-qPCR (Figure 5K, S15D–F, File S4). Correspondingly, we also saw a significant decrease in the expression of ECM proteins Col1a1 and Col5a1, Ctgf, and the hyaluronan synthase Has2 (Figure 5K, S15E–F, File S4). These data are consistent with the increase in fibroblast activation and hyaluronan deposition (KPouC mice by IHC and scRNA-seq) and collagen deposition (KHC, by histochemistry) seen in our GEMMs of epithelial PGD2 depletion (Figures 2 and 5). Receptor PPARγ was detected in mPSCs by RT-qPCR and, consistent with the literature, treatment of activated PSCs with the PPARγ agonist Rosiglitazone phenocopied PGD2 treatment (Figure S15G–H) 35.
Prostaglandins are known inflammatory mediators. As a model for assessing whether PGD2 itself is able to suppress inflammatory cell activation, we treated naïve or polarized bone marrow-derived macrophages (BMMs) in vitro with PGD2. RNA-seq analysis of naïve BMMs treated with PGD2 reveals the induction of anti-oxidant genes and, as previously reported, a shift towards an anti-inflammatory macrophage phenotype (Figure S16A–B)36. Lipopolysaccharide (LPS) induces a strong pro-inflammatory response in macrophages (Figure S16C), and subsequent treatment with PGD2 resulted in 322 genes being differentially expressed between control and LPS/PGD2-treated BMM (Figure S16D, File S5). PGD2 treatment resulted in suppression of pro-inflammatory interferon signaling pathways and a significant decrease in cytokine expression (Figure 5L, S16E–F). These data are consistent with the shift in gene expression we see between KC and KPouC macrophages by scRNA-seq (Figure 2).
Pancreatic tuft cells in human disease.
To infer the function of tuft cells in human pancreas disease, we evaluated tuft cell marker expression in RNA-seq data collected from human samples. To do this, we laser-capture dissected and sequenced the epithelium from 45 patients with precursor lesions (26 PanIN and 19 IPMN) and 197 patients with PDA (as described in 37). We then generated and overlaid a humanized version of our KC tuft cell signature on these data and found significantly higher expression in precursor lesions than cancer, consistent with tuft cell formation early in disease progression (p < 0.01, Figure 6A)3. Tuft cell markers, such as AVIL, TRPM5, GNG13, and RGS13 were enriched in precursor lesions (Figure 6A) 22. Interestingly, and consistent with results in the KC mouse model, IL25 was not detected. HPGDS expression, though, is significantly higher in precursor lesions than PDA, consistent with tuft cell expression (Figure 6B). To evaluate HPGDS protein expression, we conducted multiplex immunofluorescence for HPGDS and tuft cell marker phospho-EGFR on metaplasia and PanIN- samples from patients diagnosed with pancreatitis 3. Though rare, we found that 100% of pancreatitis tuft cells (30/30; n=3 patients) express HPGDS at the protein level (Figure 6C), consistent with studies in normal human pancreas 14. Collectively, these data are consistent with the hypothesis that KrasG12D-induced tuft cells in both mouse and human disease utilize local, paracrine PGD2 signaling to curb activation of the tumor microenvironment and suppress disease progression (Figure 7).
Figure 6. Tuft cell and Hpgds expression in human pancreatic tumorigenesis.
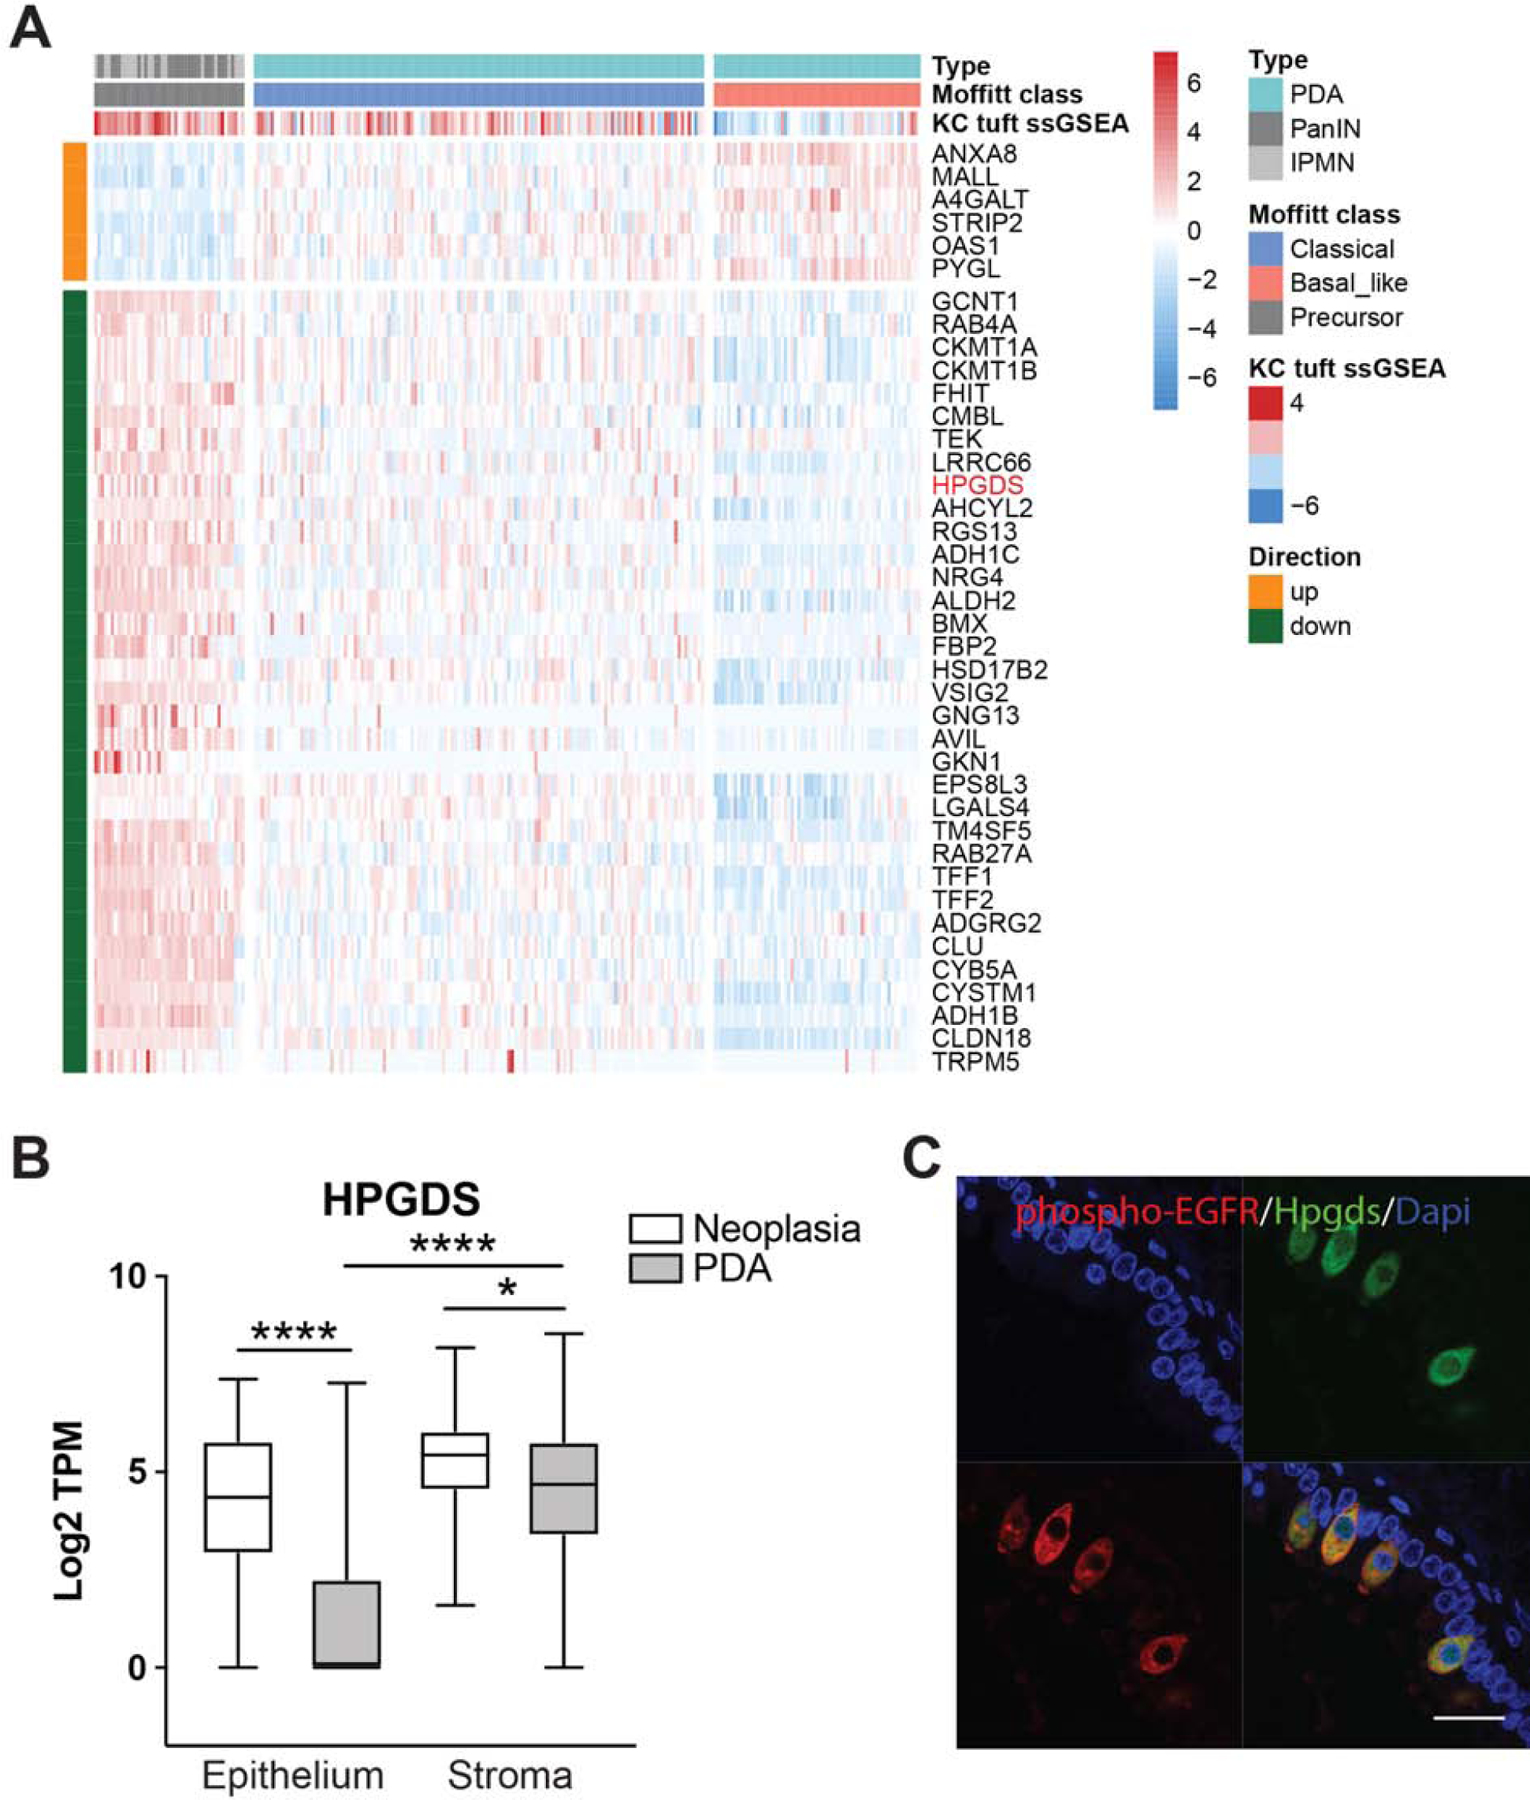
(A) Heat map with hierarchical clustering showing a significant decrease in tuft cell-associated genes between pre-invasive PanIN and IPMN (n = 45) and PDA (n = 197), as well as between classical and basal-like PDA (p<0.01). ssGSEA, single sample gene set enrichment analysis. (B) RNA-seq of Hpgds in matched epithelial and stromal compartments from the same patients. Whiskers, minimum to maximum values (C) Co-immunofluorescence for tuft cell marker phospho-EGFR, red, and Hpgds, green, in human pancreatitis. Scale bar, 20μm.
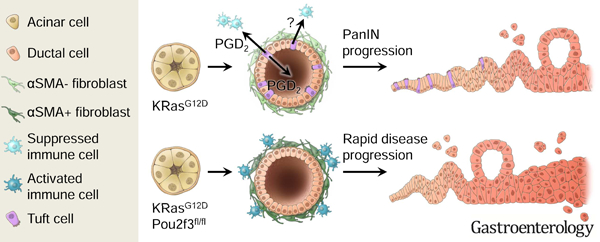
Figure 7. Model for tuft cell suppression of pancreatic tumorigenesis.
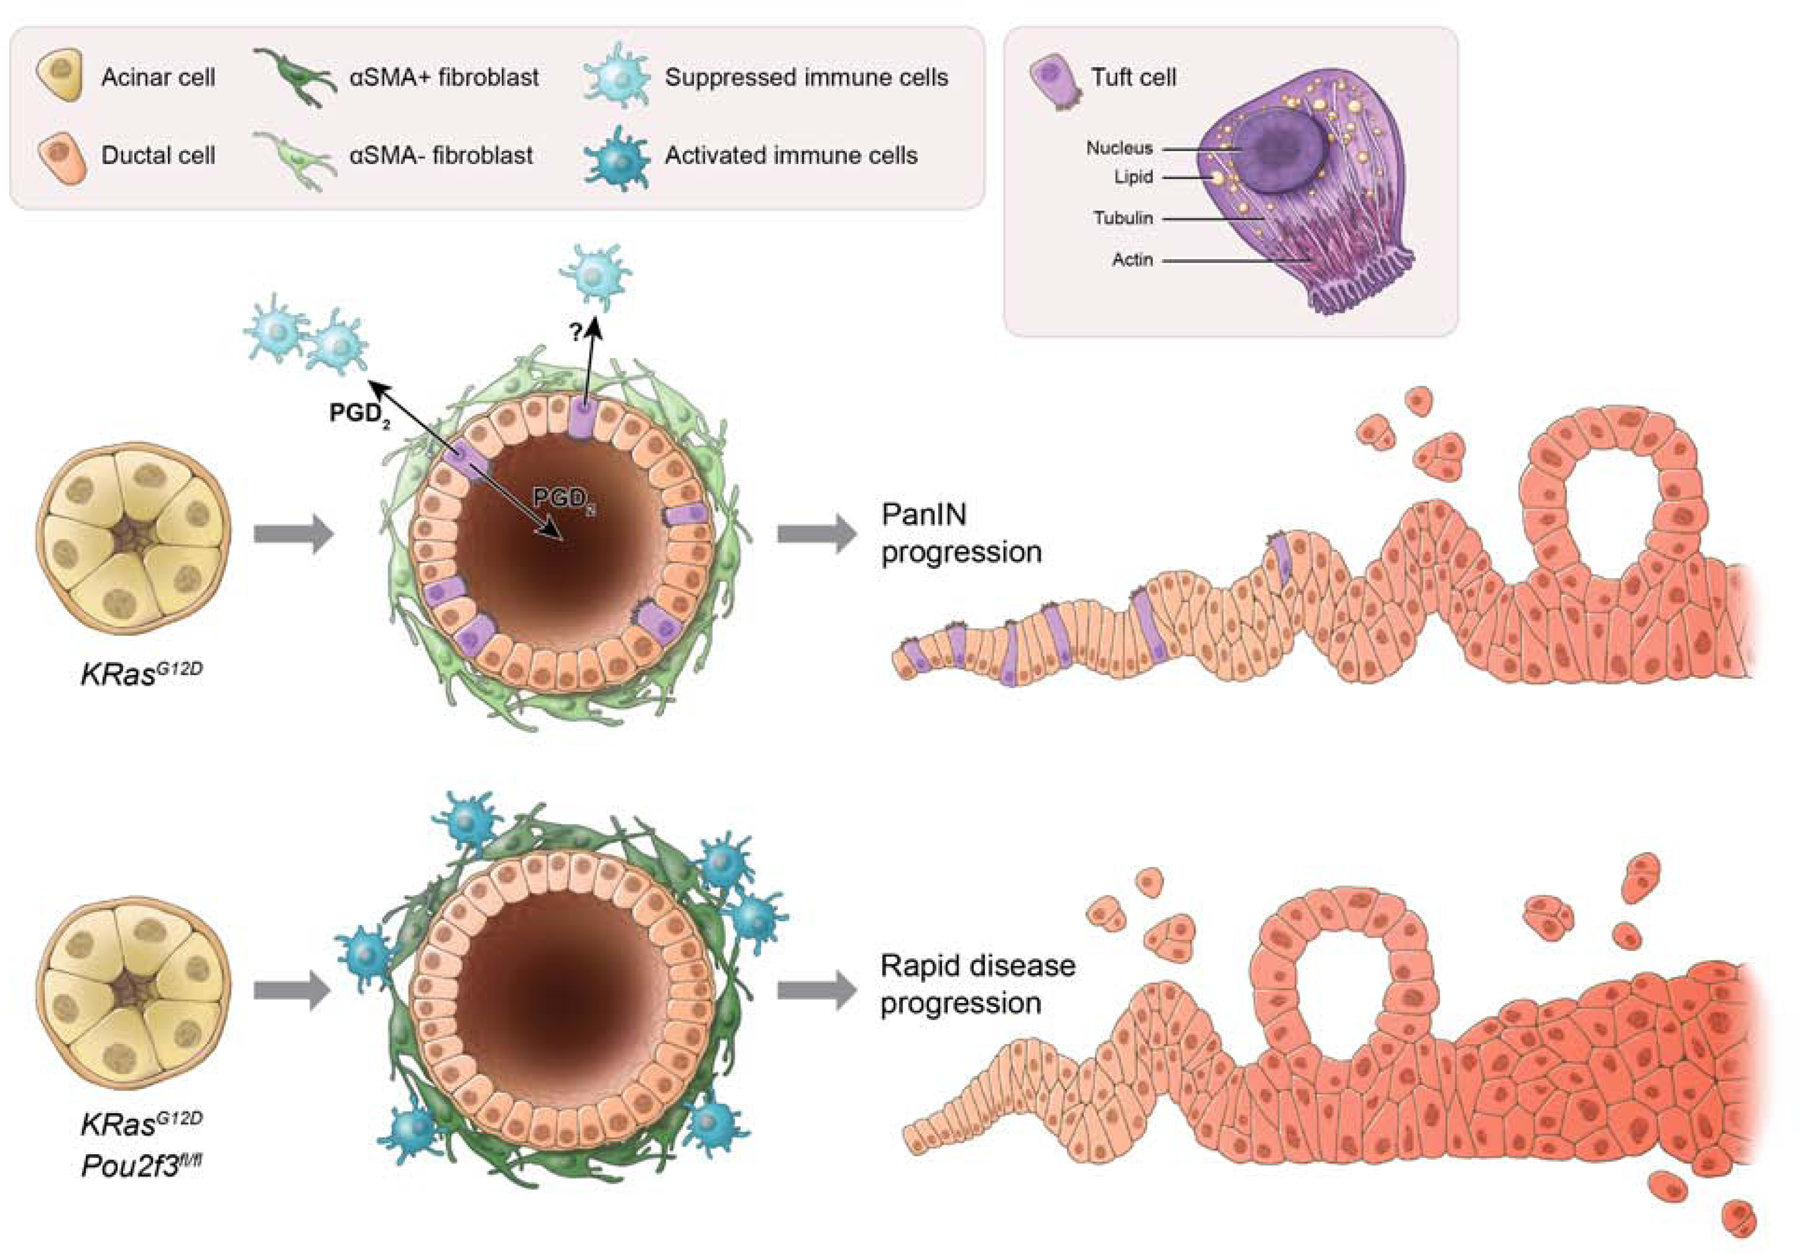
The scheme at the top represents KrasG12D-induced pancreatic tumorigenesis. Here, acinar cells expressing KrasG12D undergo metaplasia to form heterogeneous, ductal structures containing tuft cells. Among the potential secretory products of tuft cells, PGD2 is released basally and/or apically and suppresses activation of associated stroma, including pancreatic stellate cells/fibroblasts and immune cells. Metaplasia advances to pancreatic intraepithelial neoplasia (PanIN), but the process is slow. In the scheme at the bottom, acinar cells expressing KrasG12D, but lacking Pou2f3, undergo metaplasia to form aberrant ductal structures lacking tuft cells. The lack of local, epithelial PGD2 secretion impairs homeostasis, leading to prolonged activation of stromal populations and accelerated pancreatic tumorigenesis.
Discussion:
Despite much conjecture over a pro-tumorigenic role for tuft cells in pancreatic tumorigenesis, we have found that eliminating tuft cells through Pou2f3 ablation accelerates tumor formation, indicating a protective role for this cell type. We propose that tuft cells, rather than seeding cancer, instill homeostasis in part by generating and secreting lipid eicosanoid mediators. Consistent with this, our ultrastructural analyses identified the previously undescribed presence of lipid droplets in PanIN tuft cells, which we propose function in eicosanoid synthesis. Eicosanoid synthase expression (Cox1, Cox2, Hpgds) has been shown in tuft cells from a number of gastrointestinal organs and is often used to detect these cells 22, 33. However, a functional role for tuft cell-derived prostaglandins has not previously been demonstrated. We show here that the ablation of tuft cell PGD2 synthase Hpgds enhances pancreatic injury and disease progression. The global suppressive effects of PGD2 include inhibition of fibroblast and inflammatory cell activation (Figure 7). An anti-inflammatory role for PGD2 has previously been demonstrated in the context of injury and tumorigenesis in several organs 38. Correspondingly, the reduction of PGD2 through Hpgds ablation has been shown to be pro-tumorigenic in lung and colon cancer models 38, 39. In terms of T cell polarization, we found no significant differences between KC and KPouC in the relative proportion of Cd4+ and Cd8+ T cells or in gene expression between the two genotypes. Interestingly, we saw significant changes in gene expression between KC and KPouC pancreata in terms of endothelial cell and pericyte RNA expression, which warrants further investigation.
While PGD2 synthesis and secretion is one attractive mechanism for tuft cell mediated tumor suppression, these cells express additional immune modulators, including other eicosanoid synthases, which deserve further investigation 22. For example, tuft cells also express 15-Hydroxyprostaglandin dehydrogenase (Hpgd), which functions in eicosanoid metabolism (File S2). Hpgd metabolizes PGD2 into 13,14-dihydro-15-keto PGD2, which is thought to have greater suppressive effects than PGD2 itself. Hpgd also metabolizes pro-inflammatory, pro-tumorigenic PGE2 into the anti-inflammatory 13,14-dihydro-15-keto PGE2, which signals through PPARγ 40. Interestingly, KC mice have higher levels of 13,14-dihydro-15-keto PGE2 than PGE2, suggesting that one mechanism of disease suppression may be PGE2 metabolism (Figure 5A). Also, KPouC mice have far lower levels of both 13,14-dihydro-15-keto PGD2 and 13,14-dihydro-15-keto PGE2, suggesting that tuft cells contribute to prostaglandin metabolism (Figure S12). These data underscore the importance of elucidating the role of eicosanoids in PDA development.
These data support the view that pancreatic metaplasia can function in tissue healing and injury resolution, but provide a new mechanistic perspective. Based on these data, we propose that metaplastic lesions facilitate healing, in part, by generating differentiated, functional secretory cells, which signal to the microenvironment to contain disease progression, promote healing, and preserve organ function. In the setting of neoplasia, where the tissue cannot heal, we see an accumulation of tuft cells whose net effect is to abate transformation. To our knowledge, and if our interpretation is correct, this would make tuft cells the first example of an epithelial-derived tumor suppressive cell type. Tuft cell disease suppression may be one reason that humans can live with PanIN lesions for decades without progression to carcinoma. We often hear of mechanisms by which cancer cells evade the immune system and promote their own survival, but here we propose a mechanism by which the epithelium protects itself from these life-threatening events. Elucidating these protective mechanisms will allow us to understand when they fail or how to co-opt them for therapeutic benefit.
Supplementary Material
Movie S1. 3-D reconstruction of a PanIN tuft cell including nucleus-associated, lavender, and cytoplasmic, yellow, lipid droplets, highlighting their organization within the cell. Microvilli, blue; nucleus, red; basement membrane, orange.
A close-up view of tuft cell lipid droplets making contact with the nucleus, lavender. Cytoplasmic lipid droplets, yellow; Microvilli, blue; nucleus, red.
What you need to know:
Background and Context:
Development of pancreatic ductal adenocarcinoma involves acinar to ductal metaplasia and genesis of tuft cells.
New Findings:
In mice with KRAS-induced pancreatic tumorigenesis, loss of tuft cells increases the severity of caerulein-induced pancreatic injury and promotes tumorigenesis, via decreased production of PGD2.
Limitations:
This study was performed in mice; further studies are needed in humans.
Impact:
These data support a model in which tuft cells are metaplasia-induced inhibitors of tumor development.
Lay Summary:
This study identified a mechanism by which the pancreas responds to injury to prevent tumorigenesis.
Acknowledgments:
We thank Eugene Ke, Alexis Roth, Annie Odelson, Yesol Go, and Gidsela Luna for technical expertise, Haiyong Han and Daniel Von Hoff for human samples, and Jakob von Moltke, Howard Crawford, Meggie Hoffman, and members of the Wahl laboratory for helpful discussions.
Funding: Salk Core facilities are supported, in part, by NIH-NCI CCSG: P30 014195. The Salk Next Generation Sequencing Core is additionally supported by the Chapman Foundation and the Helmsley Charitable Trust. The Salk Waitt Advanced Biophotonics Core Facility is additionally supported by the Waitt Foundation. The Flow Cytometry Core Facility of the Salk Institute is additionally funded by Shared Instrumentation Grant S10-OD023 (Aria Fusion cell sorter). The Salk IGC is also supported by The Helmsley Charitable Trust, and M.N.S. is supported by R01 GM102491–07, and 1RF1AG064049–01. Y.U. is supported by JSPS KAKENHI grant (16H01881). I.M. and M.O. are supported by NIH-R01 DC015491 and the Monell Chemical Senses Center. K.P.O. and H.C.M. are supported by NIH-NCI CCSG P30CA013696, NIH/NCI 1U54CA209997, and the Columbia/NYP Pancreas Center. P.K.S. lab is supported by the NIH-NCI Awards: R01CA163649, R01CA210439, R01CA216853, P50CA127297, P01CA217798, and P30 CA036727. The Wahl laboratory is supported by NIH-NCI CCSG: P30 014195, NIH R35 CA197687, The Leona M. and Harry B. Helmsley Charitable Trust (2012-PG-MED002), the Freeberg Foundation, the Copley Foundation, and The William H. Isacoff MD Research Foundation for Gastrointestinal Cancer. K.E.D. was supported by a T32 training grant (5T32CA9370–34), the Salk Pioneer Award, the Salk Women & Science Special Award, and a Hirshberg Foundation Seed Grant.
Footnotes
Publisher's Disclaimer: This is a PDF file of an unedited manuscript that has been accepted for publication. As a service to our customers we are providing this early version of the manuscript. The manuscript will undergo copyediting, typesetting, and review of the resulting proof before it is published in its final form. Please note that during the production process errors may be discovered which could affect the content, and all legal disclaimers that apply to the journal pertain.
The authors declare no potential conflicts of interest.
Data and materials availability: Sequencing data that support the findings of this study may be found in GEO archive GSE154260. Human RNA sequencing data may be found in GEO archive GSE110764. Pou2f3fl/fl mice are available from Dr. Matsumoto with a material transfer agreement.
References
Author names in bold designate shared co-first authorship.
- 1.Dvorak HF. Tumors: wounds that do not heal. Similarities between tumor stroma generation and wound healing. N Engl J Med 1986;315:1650–9. [DOI] [PubMed] [Google Scholar]
- 2.Bailey JM, Alsina J, Rasheed ZA, et al. DCLK1 marks a morphologically distinct subpopulation of cells with stem cell properties in preinvasive pancreatic cancer. Gastroenterology 2014;146:245–56. [DOI] [PMC free article] [PubMed] [Google Scholar]
- 3.Delgiorno KE, Hall JC, Takeuchi KK, et al. Identification and manipulation of biliary metaplasia in pancreatic tumors. Gastroenterology 2014;146:233–44 e5. [DOI] [PMC free article] [PubMed] [Google Scholar]
- 4.Sato A Tuft cells. Anat Sci Int 2007;82:187–99. [DOI] [PubMed] [Google Scholar]
- 5.Jarvi O, Keyrilainen O. On the cellular structures of the epithelial invasions in the glandular stomach of mice caused by intramural application of 20-methylcholantren. Acta Pathol Microbiol Scand Suppl 1956;39:72–3. [PubMed] [Google Scholar]
- 6.Gerbe F, Sidot E, Smyth DJ, et al. Intestinal epithelial tuft cells initiate type 2 mucosal immunity to helminth parasites. Nature 2016;529:226–30. [DOI] [PMC free article] [PubMed] [Google Scholar]
- 7.Howitt MR, Lavoie S, Michaud M, et al. Tuft cells, taste-chemosensory cells, orchestrate parasite type 2 immunity in the gut. Science 2016;351:1329–33. [DOI] [PMC free article] [PubMed] [Google Scholar]
- 8.von Moltke J, Ji M, Liang HE, et al. Tuft-cell-derived IL-25 regulates an intestinal ILC2-epithelial response circuit. Nature 2016;529:221–5. [DOI] [PMC free article] [PubMed] [Google Scholar]
- 9.Lei W, Ren W, Ohmoto M, et al. Activation of intestinal tuft cell-expressed Sucnr1 triggers type 2 immunity in the mouse small intestine. Proc Natl Acad Sci U S A 2018;115:5552–5557. [DOI] [PMC free article] [PubMed] [Google Scholar]
- 10.Nadjsombati MS, McGinty JW, Lyons-Cohen MR, et al. Detection of Succinate by Intestinal Tuft Cells Triggers a Type 2 Innate Immune Circuit. Immunity 2018;49:33–41 e7. [DOI] [PMC free article] [PubMed] [Google Scholar]
- 11.Schneider C, O’Leary CE, von Moltke J, et al. A Metabolite-Triggered Tuft Cell-ILC2 Circuit Drives Small Intestinal Remodeling. Cell 2018;174:271–284 e14. [DOI] [PMC free article] [PubMed] [Google Scholar]
- 12.Miller CN, Proekt I, von Moltke J, et al. Thymic tuft cells promote an IL-4-enriched medulla and shape thymocyte development. Nature 2018;559:627–631. [DOI] [PMC free article] [PubMed] [Google Scholar]
- 13.Bornstein C, Nevo S, Giladi A, et al. Single-cell mapping of the thymic stroma identifies IL-25-producing tuft epithelial cells. Nature 2018;559:622–626. [DOI] [PubMed] [Google Scholar]
- 14.Schutz B, Ruppert AL, Strobel O, et al. Distribution pattern and molecular signature of cholinergic tuft cells in human gastro-intestinal and pancreatic-biliary tract. Sci Rep 2019;9:17466. [DOI] [PMC free article] [PubMed] [Google Scholar]
- 15.DelGiorno KE, Naeem RF, Fang L, et al. Tuft Cell Formation Reflects Epithelial Plasticity in Pancreatic Injury: Implications for Modeling Human Pancreatitis. Front Physiol 2020;11:88. [DOI] [PMC free article] [PubMed] [Google Scholar]
- 16.Hingorani SR, Petricoin EF, Maitra A, et al. Preinvasive and invasive ductal pancreatic cancer and its early detection in the mouse. Cancer Cell 2003;4:437–50. [DOI] [PubMed] [Google Scholar]
- 17.Nakamura T, Fujiwara Y, Yamada R, et al. Mast cell-derived prostaglandin D2 attenuates anaphylactic reactions in mice. J Allergy Clin Immunol 2017;140:630–632 e9. [DOI] [PubMed] [Google Scholar]
- 18.Yamashita J, Ohmoto M, Yamaguchi T, et al. Skn-1a/Pou2f3 functions as a master regulator to generate Trpm5-expressing chemosensory cells in mice. PLoS One 2017;12:e0189340. [DOI] [PMC free article] [PubMed] [Google Scholar]
- 19.Zhang Y, Zoltan M, Riquelme E, et al. Immune Cell Production of Interleukin 17 Induces Stem Cell Features of Pancreatic Intraepithelial Neoplasia Cells. Gastroenterology 2018;155:210–223 e3. [DOI] [PMC free article] [PubMed] [Google Scholar]
- 20.Westphalen CB, Takemoto Y, Tanaka T, et al. Dclk1 Defines Quiescent Pancreatic Progenitors that Promote Injury-Induced Regeneration and Tumorigenesis. Cell Stem Cell 2016;18:441–55. [DOI] [PMC free article] [PubMed] [Google Scholar]
- 21.Qu D, Weygant N, May R, et al. Ablation of Doublecortin-Like Kinase 1 in the Colonic Epithelium Exacerbates Dextran Sulfate Sodium-Induced Colitis. PLoS One 2015;10:e0134212. [DOI] [PMC free article] [PubMed] [Google Scholar]
- 22.Bezencon C, Furholz A, Raymond F, et al. Murine intestinal cells expressing Trpm5 are mostly brush cells and express markers of neuronal and inflammatory cells. J Comp Neurol 2008;509:514–25. [DOI] [PubMed] [Google Scholar]
- 23.Elyada E, Bolisetty M, Laise P, et al. Cross-Species Single-Cell Analysis of Pancreatic Ductal Adenocarcinoma Reveals Antigen-Presenting Cancer-Associated Fibroblasts. Cancer Discov 2019;9:1102–1123. [DOI] [PMC free article] [PubMed] [Google Scholar]
- 24.Picelli S, Faridani OR, Bjorklund AK, et al. Full-length RNA-seq from single cells using Smart-seq2. Nat Protoc 2014;9:171–81. [DOI] [PubMed] [Google Scholar]
- 25.Wu CY, Carpenter ES, Takeuchi KK, et al. PI3K regulation of RAC1 is required for KRAS-induced pancreatic tumorigenesis in mice. Gastroenterology 2014;147:1405–16 e7. [DOI] [PMC free article] [PubMed] [Google Scholar]
- 26.Haber AL, Biton M, Rogel N, et al. A single-cell survey of the small intestinal epithelium. Nature 2017;551:333–339. [DOI] [PMC free article] [PubMed] [Google Scholar]
- 27.Schutz B, Jurastow I, Bader S, et al. Chemical coding and chemosensory properties of cholinergic brush cells in the mouse gastrointestinal and biliary tract. Front Physiol 2015;6:87. [DOI] [PMC free article] [PubMed] [Google Scholar]
- 28.Hayakawa Y, Sakitani K, Konishi M, et al. Nerve Growth Factor Promotes Gastric Tumorigenesis through Aberrant Cholinergic Signaling. Cancer Cell 2017;31:21–34. [DOI] [PMC free article] [PubMed] [Google Scholar]
- 29.McConnell RE, Higginbotham JN, Shifrin DA Jr., et al. The enterocyte microvillus is a vesicle-generating organelle. J Cell Biol 2009;185:1285–98. [DOI] [PMC free article] [PubMed] [Google Scholar]
- 30.den Brok MH, Raaijmakers TK, Collado-Camps E, et al. Lipid Droplets as Immune Modulators in Myeloid Cells. Trends Immunol 2018;39:380–392. [DOI] [PubMed] [Google Scholar]
- 31.Bozza PT, Yu W, Penrose JF, et al. Eosinophil lipid bodies: specific, inducible intracellular sites for enhanced eicosanoid formation. J Exp Med 1997;186:909–20. [DOI] [PMC free article] [PubMed] [Google Scholar]
- 32.Dvorak AM, Dvorak HF, Peters SP, et al. Lipid bodies: cytoplasmic organelles important to arachidonate metabolism in macrophages and mast cells. J Immunol 1983;131:2965–76. [PubMed] [Google Scholar]
- 33.Gerbe F, van Es JH, Makrini L, et al. Distinct ATOH1 and Neurog3 requirements define tuft cells as a new secretory cell type in the intestinal epithelium. J Cell Biol 2011;192:767–80. [DOI] [PMC free article] [PubMed] [Google Scholar]
- 34.Suzuki F, Hayashi H, Hayaishi O. Transport of prostaglandin D2 into brain. Brain Res 1986;385:321–8. [DOI] [PubMed] [Google Scholar]
- 35.Masamune A, Kikuta K, Satoh M, et al. Ligands of peroxisome proliferator-activated receptor-gamma block activation of pancreatic stellate cells. J Biol Chem 2002;277:141–7. [DOI] [PubMed] [Google Scholar]
- 36.Virtue S, Masoodi M, de Weijer BA, et al. Prostaglandin profiling reveals a role for haematopoietic prostaglandin D synthase in adipose tissue macrophage polarisation in mice and humans. Int J Obes (Lond) 2015;39:1151–60. [DOI] [PMC free article] [PubMed] [Google Scholar]
- 37.Maurer C, Holmstrom SR, He J, et al. Experimental microdissection enables functional harmonisation of pancreatic cancer subtypes. Gut 2019. [DOI] [PMC free article] [PubMed]
- 38.Murata T, Maehara T. Discovery of anti-inflammatory role of prostaglandin D2. J Vet Med Sci 2016;78:1643–1647. [DOI] [PMC free article] [PubMed] [Google Scholar]
- 39.Park JM, Kanaoka Y, Eguchi N, et al. Hematopoietic prostaglandin D synthase suppresses intestinal adenomas in ApcMin/+ mice. Cancer Res 2007;67:881–9. [DOI] [PubMed] [Google Scholar]
- 40.Seo MJ, Oh DK. Prostaglandin synthases: Molecular characterization and involvement in prostaglandin biosynthesis. Prog Lipid Res 2017;66:50–68. [DOI] [PubMed] [Google Scholar]
Associated Data
This section collects any data citations, data availability statements, or supplementary materials included in this article.
Supplementary Materials
Movie S1. 3-D reconstruction of a PanIN tuft cell including nucleus-associated, lavender, and cytoplasmic, yellow, lipid droplets, highlighting their organization within the cell. Microvilli, blue; nucleus, red; basement membrane, orange.
A close-up view of tuft cell lipid droplets making contact with the nucleus, lavender. Cytoplasmic lipid droplets, yellow; Microvilli, blue; nucleus, red.


