

Abstract
Transcription is an essential biological process in bacteria requiring a core enzyme, RNA polymerase (RNAP). Bacterial RNAP is catalytically active but requires sigma (σ) factors for transcription of natural DNA templates. σ factor binds to RNAP to form a holoenzyme which specifically recognizes a promoter, melts the DNA duplex, and commences RNA synthesis. Inhibiting the binding of σ to RNAP is expected to inhibit bacterial transcription and growth. We previously identified a triaryl hit compound that mimics σ at its major binding site of RNAP, thereby inhibiting the RNAP holoenzyme formation. In this study, we modified this scaffold to provide a series of benzyl and benzoyl benzoic acid derivatives possessing improved antimicrobial activity. A representative compound demonstrated excellent activity against Staphylococcus epidermidis with minimum inhibitory concentrations reduced to 0.5 μg/mL, matching that of vancomycin. The molecular mechanism of inhibition was confirmed using biochemical and cellular assays. Low cytotoxicity and metabolic stability of compounds demonstrated the potential for further studies.
Keywords: Bacterial transcription, RNA polymerase, Sigma factor, Inhibitor, Antimicrobial
Graphical Abstract

1. Introduction
Bacterial infectious diseases pose serious problems to human health and the economy. The World Health Organization published a priority pathogen list for guiding the R&D of antibiotics in 2017 [1]. Bacterial transcription is a valid but underutilized target for antimicrobial agent discovery; rifamycins and fidaxomicin are the only two types of antibiotics used in clinics that target bacterial RNA polymerase (RNAP) [2].
Bacterial RNAP core enzyme composed of five subunits (α dimer, β, β’ and ω) is capable of RNA synthesis on synthetic single-stranded DNA templates but requires accessory σ factors to initiate transcription at promoters (Figure 1A) [3]. Bacterial σ factor binds to RNAP to form a holoenzyme, specifically recognizes promoter DNA elements, and triggers DNA strand separation to expose the transcription start site to initiate RNA synthesis [4, 5]. Housekeeping σ factors (named σA in most bacteria, σ70 in Escherichia coli) required for transcription of most genes are highly conserved and essential for cell functions and viability [6–8]. Determination of high-resolution structures of RNAP holoenzyme complexes [9, 10] paved a road toward the structure-guided discovery of antimicrobial agents targeting the RNAP-σ interaction.
Fig. 1.
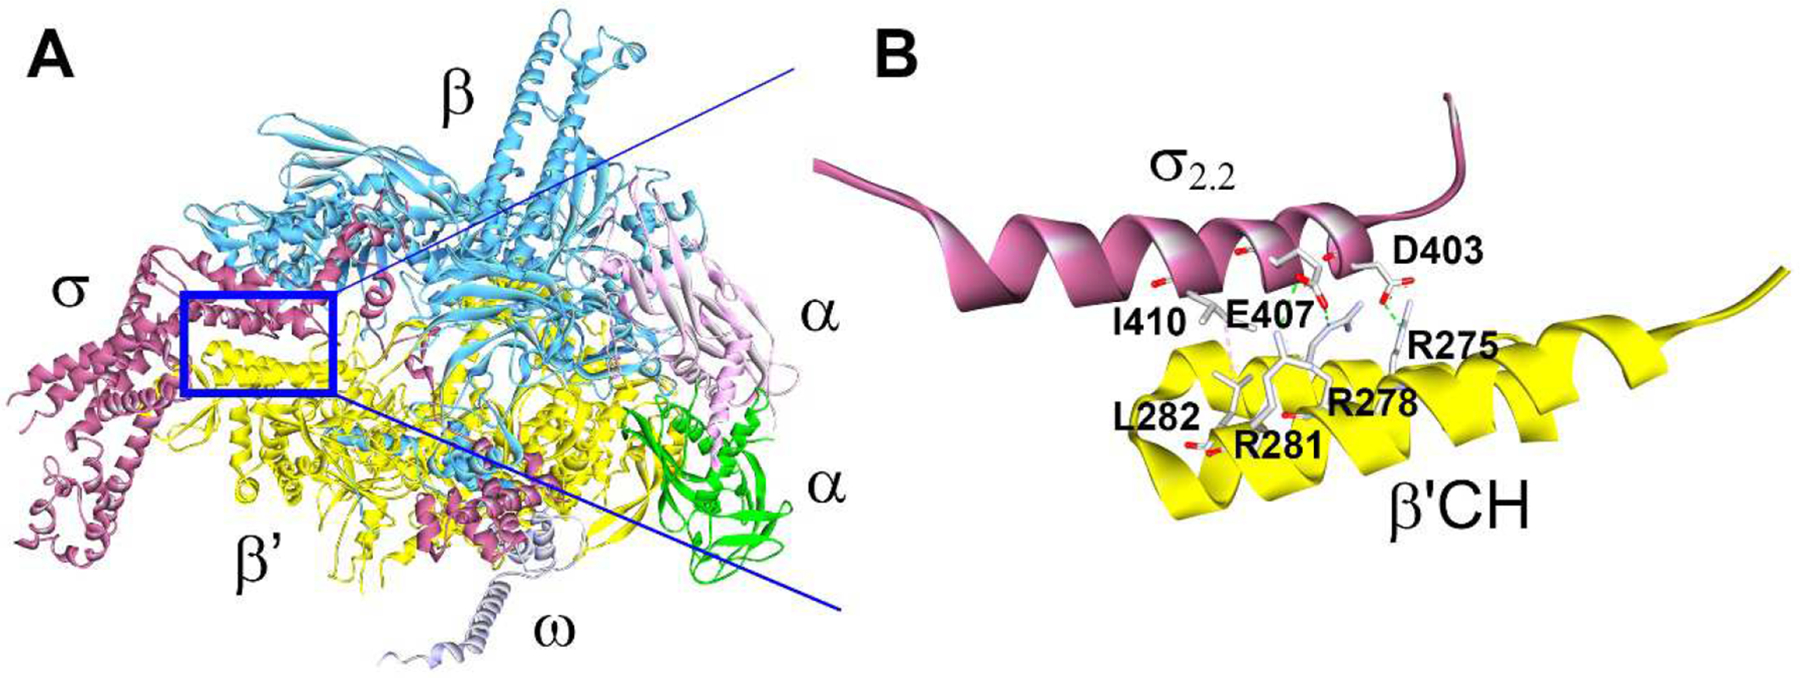
Structure of A) the E. coli RNAP holoenzyme crystal complex (PDB: 4LJZ) and B) interactions at the interface of σ2.2 and β’CH, with key amino acid side chains shown [18].
The interactions between the clamp helices (CH) domain of the RNAP β’ subunit and σ70 region 2.2 are thought to play a dominant role in the holoenzyme formation [11, 12]. Focusing on key amino acid residues at the β’CH-σ2.2 interface (Figure 1B), we designed a pharmacophore model and carried out in silico screening for protein-protein (PPI) inhibitors [13, 14]. The first generation of bis-indole inhibitor compounds exhibited mild broad-spectrum antimicrobial activity with confirmed mechanism and specificity (i.e., targeting β’CH) [13], as did the second generation of inhibitors with more drug-like properties [15]. Small-molecule inhibitors of RNAP-σ interaction have also been identified by screening compounds for inhibition of E. coli RNAP-σ70 binding in vitro and by virtual screening of a pharmacophore model based on structures of bioactive compounds with unknown or diverse binding sites on RNAP [16, 17]. However, the exact binding sites of these compounds remain to be elucidated.
We were particularly interested in a triaryl C3 compound (Fig. 2A) due to its drug-like properties and the presumed efficiency of structure modification. Using the ELISA-based inhibitory assay and the protein complement assay, we have confirmed that C3 specifically inhibited the β’CH-σ interaction in vitro [15][19]. C3 displayed mild antimicrobial activity against Streptococcus pneumoniae ATCC 49619 with a minimum inhibitory concentration (MIC) of 256 μg/mL. Preliminary structural optimizations of C3 were carried out in previous studies [20]. We first investigated the contribution of the left benzene ring while keeping the right benzoic acid moiety intact, because the latter was predicted to form strong ionic bonds to two β’ arginine residues R278 and R281 (E. coli numbering) (Fig. 2B) [20]. A simple modification from 2-aminobenzene to 3,4-dichlorobenzene resulted in C3–005 (Fig. 2A), which significantly improved the antimicrobial activity against S. pneumoniae to an MIC of 8 μg/mL (Fig. 2A); in addition, the C3–005 inhibitory effects on S. pneumoniae toxin production were comparable to those of antibiotics currently on the market [20].
Fig. 2.
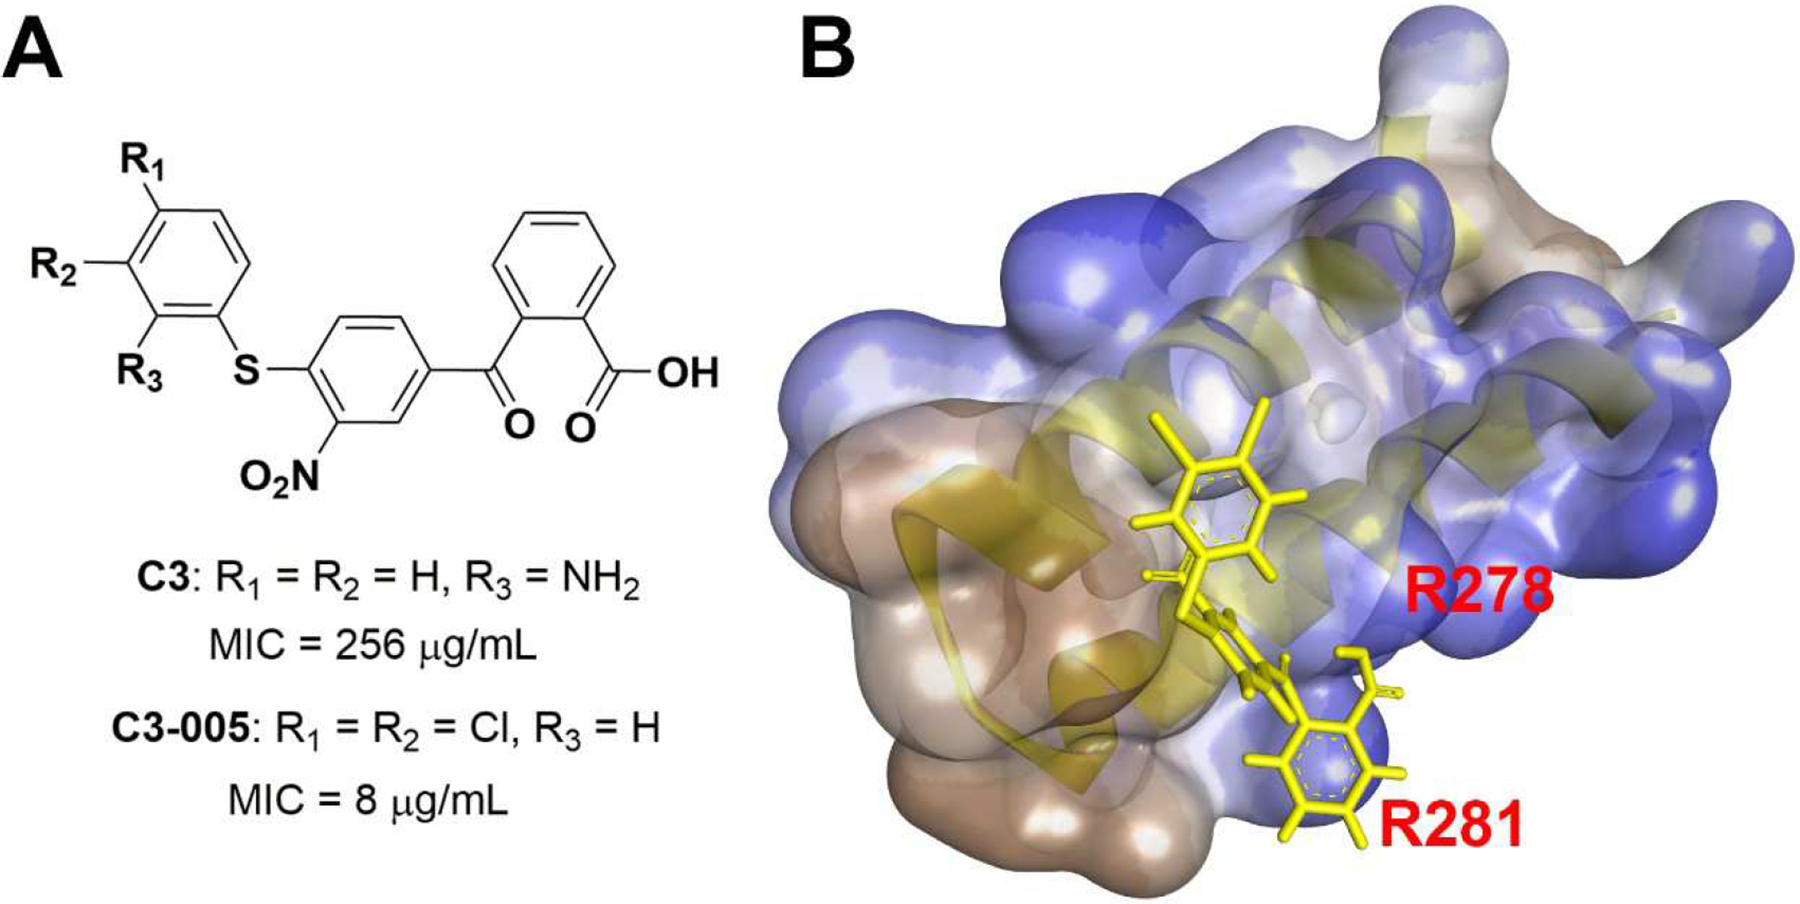
A) Structures of C3 and C3–005 and MICs against S. pneumoniae; B) Docking model of C3–005 (yellow) onto β’CH (semi-transparent surface showing hydrophobicity in blue).
2. Results and discussion
2.1. Design of benzyl and benzoyl derivatives
In this study, we intended to modify the right benzoyl benzoic acid motif to explore the appropriate chemical space required for binding to the β’CH and the resulting changes in the antimicrobial activity. According to the pharmacophore docking model, the right benzoic acid in C3–005 is pincered by the β’CH residues R278 and R281 (Figure 1B & 2B). Therefore, starting with C3–005 as the lead compound, we intended to explore the substituents on the right benzene ring and test their effects on the antimicrobial activity. Additionally, we wished to verify the importance of benzoic acid for activity by using modifications to other functional groups.
In C3–005, the benzoyl group is bound to benzoic acid to maintain a quasi-planar conformation of the right part of the molecule (Fig. 2B). We were also interested in determining whether a flexible conformation would make a difference, by modifying benzoyl to benzyl with a methylene group replacing carbonyl despite possible existence of hyperconjugation in a diphenylmethane type of structure.
2.2. Chemistry
As shown in Scheme 1, compounds 5a – j were synthesized. Suzuki coupling of 4-(bromomethyl)-1-fluoro-2-nitrobenzene 1 with arylboronic acids 2a – j provided 3a – j [21]. Substitution of the fluoride group with 3,4-dichlorobenzenethiol gave thiol ethers 4a – i, and 5j. The methyl benzoates were then hydrolyzed with aqueous solution of sodium hydroxide to yield benzoic acids 5a – i.
Scheme 1.
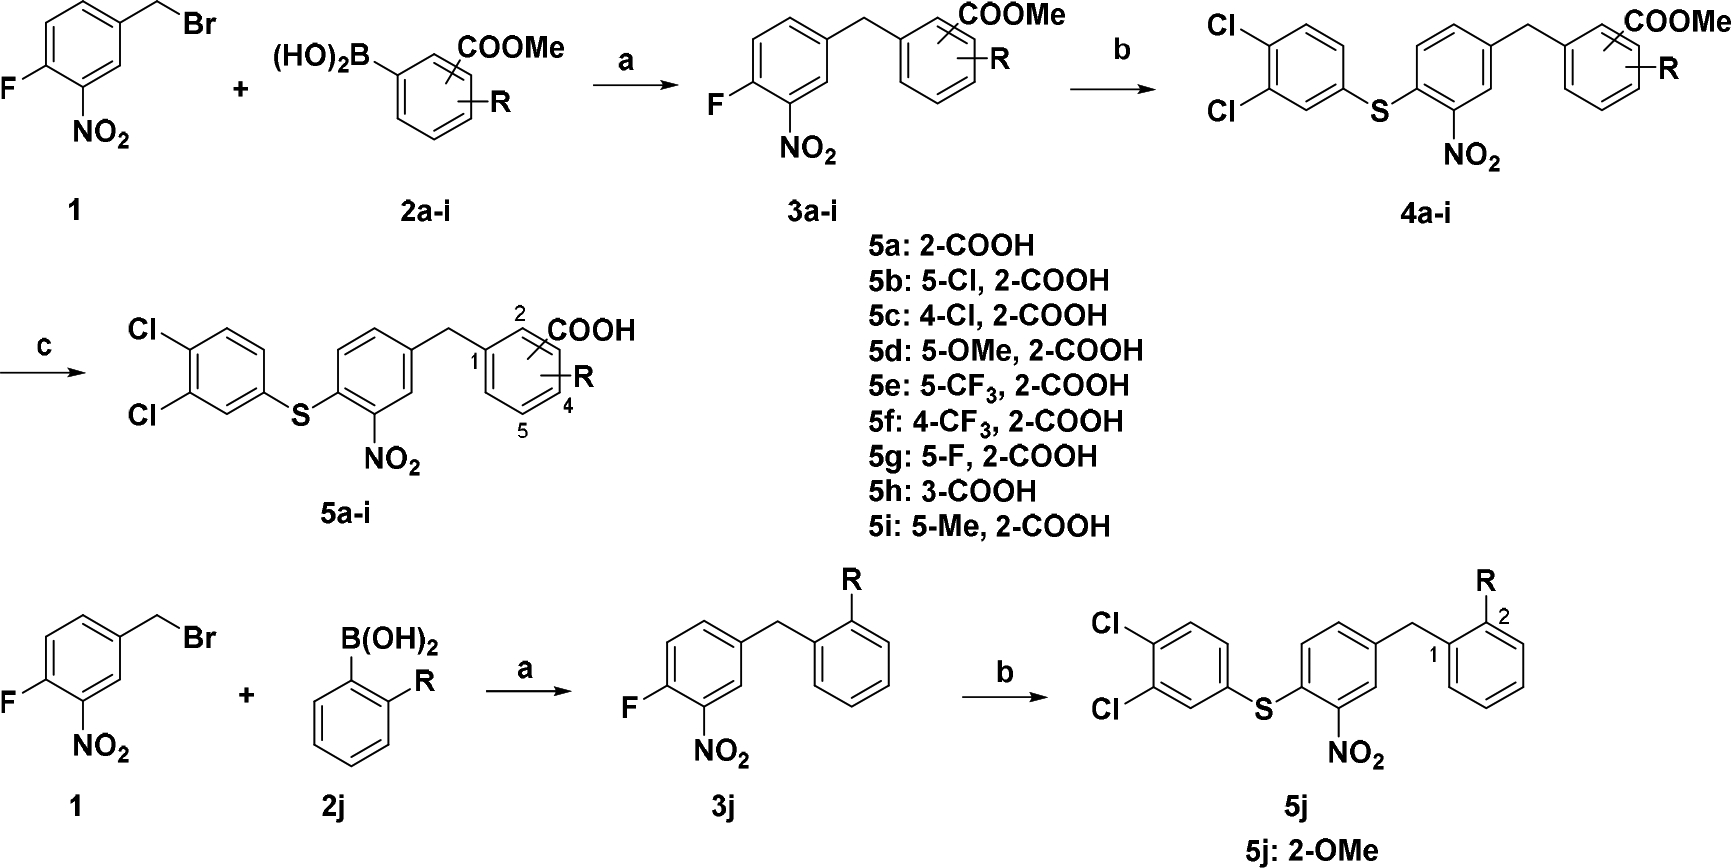
Synthetic route for compounds 5a – ja
a Reagents and conditions: a) Arylboronic acid, Pd(OAc)2, PPh3, K3PO4, Tol, 80 °C; b) 3,4-Dichlorobenzenethiol, NaOAc, EtOH, reflux; (c) NaOH, H2O, dioxane, 50 °C, overnight.
The intermediates 3a – h and 3j were subjected to synthesis of 8a – i (Scheme 2). Oxidation of 3a – h and 3j provided diarylketones 6a – i employing NBS [22]. Thioethers 7a – h and 8i were prepared by substitution of fluoride with 3,4-dichlorobenzenethiol as described above. After hydrolysis of esters, benzoic acids 8a – h were obtained.
Scheme 2.
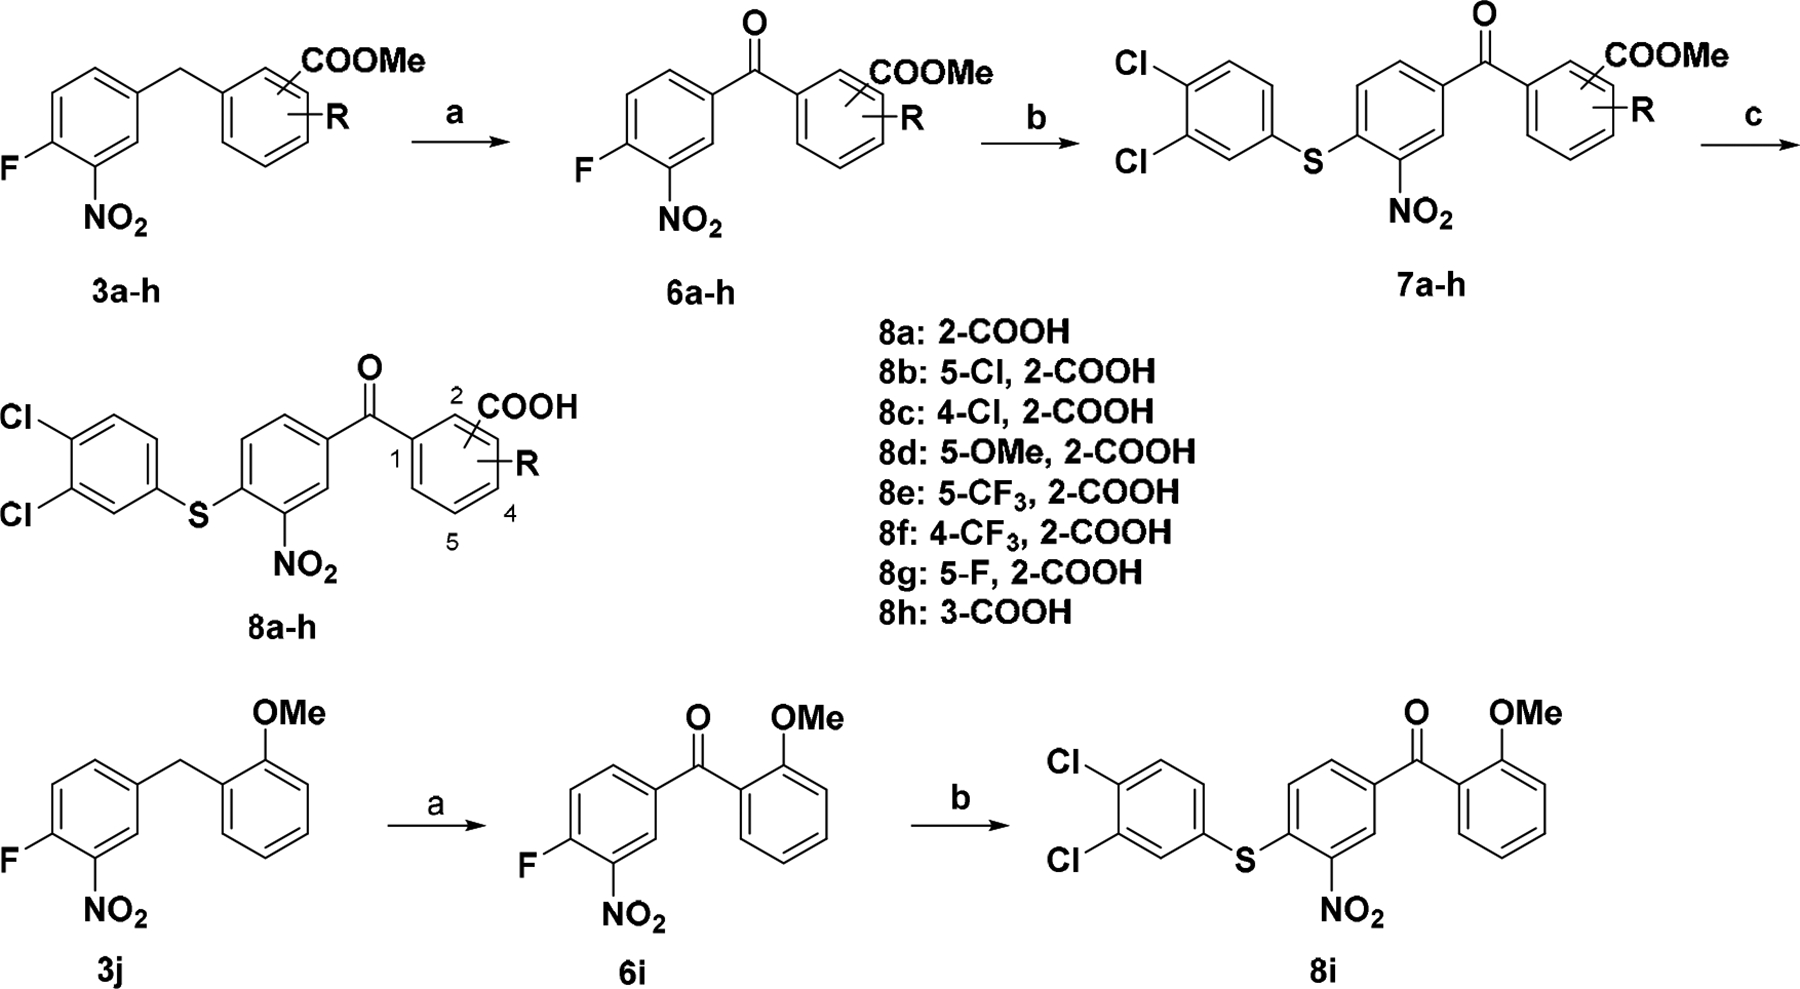
Synthetic route for compounds 8a – ia
a Reagents and conditions: (a) NBS, H2O, CHCl3, 60 ~ 85 °C; (b) 3,4-Dichlorobenzenethiol, NaOAc, EtOH, reflux; (c) NaOH, H2O, dioxane, 50 °C, overnight.
2.3. Microbiological assessment
2.3.1. Antimicrobial activities
The in-house synthesized compounds 5a – j and 8a – i were tested for their antimicrobial activities against S. pneumoniae and Staphylococcus aureus, both of which are on the WHO priority pathogen list for R&D of new antibiotics [23]. As shown in Table 1, the antimicrobial activities of all the 4- or 5-substituted 2-benzoic acids were significantly improved against all the bacteria tested when electron-withdrawing substituents (8b – c, 8e – f) were present, as compared to 8a. The greatest activity was observed when the structure contains 5-trifluoromethyl-2-benzoic acid (8e). Electron-donating group (8d) and fluoride (8g) maintained the antimicrobial activity against S. pneumoniae and S. aureus ATCC 25923, and slightly improved activity against S. aureus ATCC 29213. Note that compounds 8b – c, 8e – f were predicted to possess slightly higher clogP values than 8a, 8d, and 8g. These results suggest that additional substituents may increase the binding to the protein surface, which is favorable for activity. Membrane permeability may also play a role in increasing cellular compound concentration.
Table 1.
Antimicrobial activity and clogP values of synthesized compounds
| MIC (μg/mL) | |||||
|---|---|---|---|---|---|
| No. | R | clogP | |||
| SPNE | SAURa | SAURb | |||
| 5a |  |
16 | 16 | 16 | 6.59 |
| 8a (C3–005) | 8 | 16 | 16 | 5.94 | |
| 5b |  |
2 | 8 | 8 | 7.40 |
| 8b | 8 | 8 | 8 | 6.69 | |
| 5c |  |
4 | 8 | 8 | 7.40 |
| 8c | 8 | 8 | 4 | 6.69 | |
| 5d |  |
8 | 16 | 8 | 6.72 |
| 8d | 8 | 16 | 8 | 6.04 | |
| 5e |  |
1 | 8 | 8 | 7.64 |
| 8e | 2 | 4 | 4 | 6.87 | |
| 5f |  |
2 | 16 | 8 | 7.64 |
| 8f | 4 | 16 | 8 | 6.87 | |
| 5g |  |
4 | 8 | 8 | 6.83 |
| 8g | 8 | 16 | 8 | 6.12 | |
| 5h |  |
>256 | >256 | >256 | 7.49 |
| 8h | >256 | >256 | 32 | 6.74 | |
| 5i |  |
4 | 4 | 4 | 7.08 |
| 5j |  |
>256 | >256 | >256 | 7.66 |
| 8i | >256 | >256 | >256 | 6.98 | |
SPNE: S. pneumoniae ATCC 49619,
SAUR: S. aureus ATCC 25923,
SAUR: S. aureus ATCC 29213
Compounds 5a – g and 5i with benzyl benzoic acid moiety demonstrated a similar trend but slightly superior antimicrobial activity as compared to benzoyl benzoic acid analogues 8a – g, probably due to a more flexible structure and slightly higher clogP values (Table 1). Again, all of the electron-withdrawing (5b – c, 5e – f) and -donating groups (5d and 5i) substituted on the right benzene ring of 5a improved the antimicrobial activity. In particular, trifluoromethyl substituted compound 5e exhibited an MIC of 1 μg/mL against S. pneumoniae, even though being eight times less potent against S. aureus.
When the benzoic acid group was moved to 3-position (5h and 8h) or changed to methoxy (5j and 8i), the antimicrobial activity vanished. The docking model (Fig. 2B) demonstrates that the benzoic acid group at 2-position to benzyl or benzoyl is positioned between β’CH R278 and R281. The experimental results suggest that benzoic acid may form a critical ionic bonding interaction with the binding site at β’CH, and that the relative position of benzoic acid to the core structure of inhibitor is also influenced by modifications.
Since compound 8e demonstrated good antimicrobial activity against S. aureus and S. pneumoniae with MICs of 2 – 4 μg/mL (Table 1), we went on to further assess its potency against a representative panel of clinically significant Gram-positive pathogens. Growth of both Group A Streptococcus (Streptococcus pyogenes; GAS) causing strep throat, localized skin infection and necrotizing fasciitis [24] and Group B Streptococcus (Streptococcus agalactiae; GBS) causing neonatal infections [25] was inhibited by compound 8e, with MIC 4 μg/mL (Fig. 3). Responsible for serious opportunistic infections, other staphylococcal strains (Staphylococcus epidermidis and S. Staphylococcus saprophyticus) were particularly sensitive when challenged by 8e, with MICs reaching 0.5 – 1 μg/mL, a level comparable to the last-resort antibiotic vancomycin (Fig. 3). Several clinically significant Gram-negative pathogens were also tested, but none was inhibited by the compounds (data not shown). This could result from the difference in membrane permeability and efflux mechanisms between Gram-positive and -negative bacteria.
Fig. 3.

Antimicrobial activity (MIC μg/mL) of compound 8e against clinically important Gram-positive pathogens. EFAE: Enterococcus faecalis ATCC 19433, SEPI: S. epidermidis ATCC 12228, SSAP: S. saprophyticus ATCC 15305, SPYO: S. pyogenes ATCC 19615, SAGA: S. agalactiae ATCC 12386, CDIFF: Clostridium difficile ATCC 9689; RT 002: C. difficile ribotype 002; RT 027: C. difficile ribotype 027; VAN: vancomycin.
Clostridium difficile infections (CDIs) cause diarrhoea in adults and burden the global healthcare system [26, 27]. The clinical outlook is further complicated by the prevalence of the hypervirulent strain ribotype 027 (B1/NAP1/027) in Europe and the USA [28, 29], whilst ribotype 002 is associated with high mortality frequently reported in Asia-Pacific region such as Hong Kong [30, 31]. Current treatment of severe CDIs includes narrow-spectrum drugs such as vancomycin, whilst newer options such as rifampicin and fidaxomicin have emerged for the management of serious recurrent CDIs [32]. Since both rifampicin and fidaxomicin act by inhibiting bacterial transcription [33], 8e was also assessed for its possible role as an anti-clostridial agent. In our study, we included the historical non-NAP1 isolate C. difficile ATCC 9689 as a type strain, alongside the virulent isolate ribotype 002 and the hypervirulent strain ribotype 027. All three clostridial strains responded reasonably well to 8e when exposed for 48 hours anaerobically (MIC = 8 μg/mL; Fig. 3), which incentivized further investigations into the potential effects of 8e on clostridial virulence.
2.3.2. C. difficile toxin secretion
Production of cytotoxins Toxin A (TcdA) and Toxin B (TcdB) are thought to contribute towards C. difficile hypervirulence [34–36]. Fidaxomicin, which inhibits bacterial transcription initiation, has been shown to suppress toxin production in C. difficile strains when compared with first-line anti-clostridial drugs such as vancomycin and metronidazole [37, 38]. Therefore, we compared anti-clostridial effects of our compound 8e, which also inhibits transcription initiation, to those of vancomycin and fidaxomicin by assessing C. difficile viable colony counts and measuring toxin attenuation. Typically, both Toxins A and B undergo optimal production during the stationary phase of C. difficile, and their release can be accelerated under conditions of stress, such as chemotherapeutic challenges [39, 40]. C. difficile strains were therefore cultured and incubated anaerobically in the presence of sub-inhibitory concentrations of compound 8e, vancomycin and fidaxomicin for up to 48 hours, whereby the levels of Toxins A and B can be determined and cross-referenced with counts of colony-forming units (CFUs).
The results revealed that the effects of transcription inhibitors were different from those of vancomycin, which inhibits cell wall biosynthesis (Fig. 4). When present at low concentrations, vancomycin stimulated toxin production, and inhibition was observed only at ½ MIC; this stimulation may be plausibly attributed either to upregulation of exotoxin gene expression by vancomycin, as reported for some genes in S. aureus [41], or to the inadvertent mechanical disruption of clostridial cell walls upon inhibition of their biosynthesis by vancomycin. The lytic release of toxins is supported by the drop in viable cell counts in all three strains treated with decreasingly sublethal doses of vancomycin being contrasted with increasing levels of Toxins A and B detected in supernatants. By contrast, the test compound 8e and fidaxomycin inhibited the release of Toxins A and B in all three C. difficile strains at subinhibitory concentrations in a dose-dependent manner (Fig. 4). Fidaxomicin demonstrated remarkable toxin-suppressing potency even at more diluted concentrations, especially against the hypervirulent ribotype 027 (Fig. 4C). 8e could, however, largely match the effects of fidaxomicin when its concentration was further increased, for example, to ½ × MIC across all three strains.
Fig. 4.
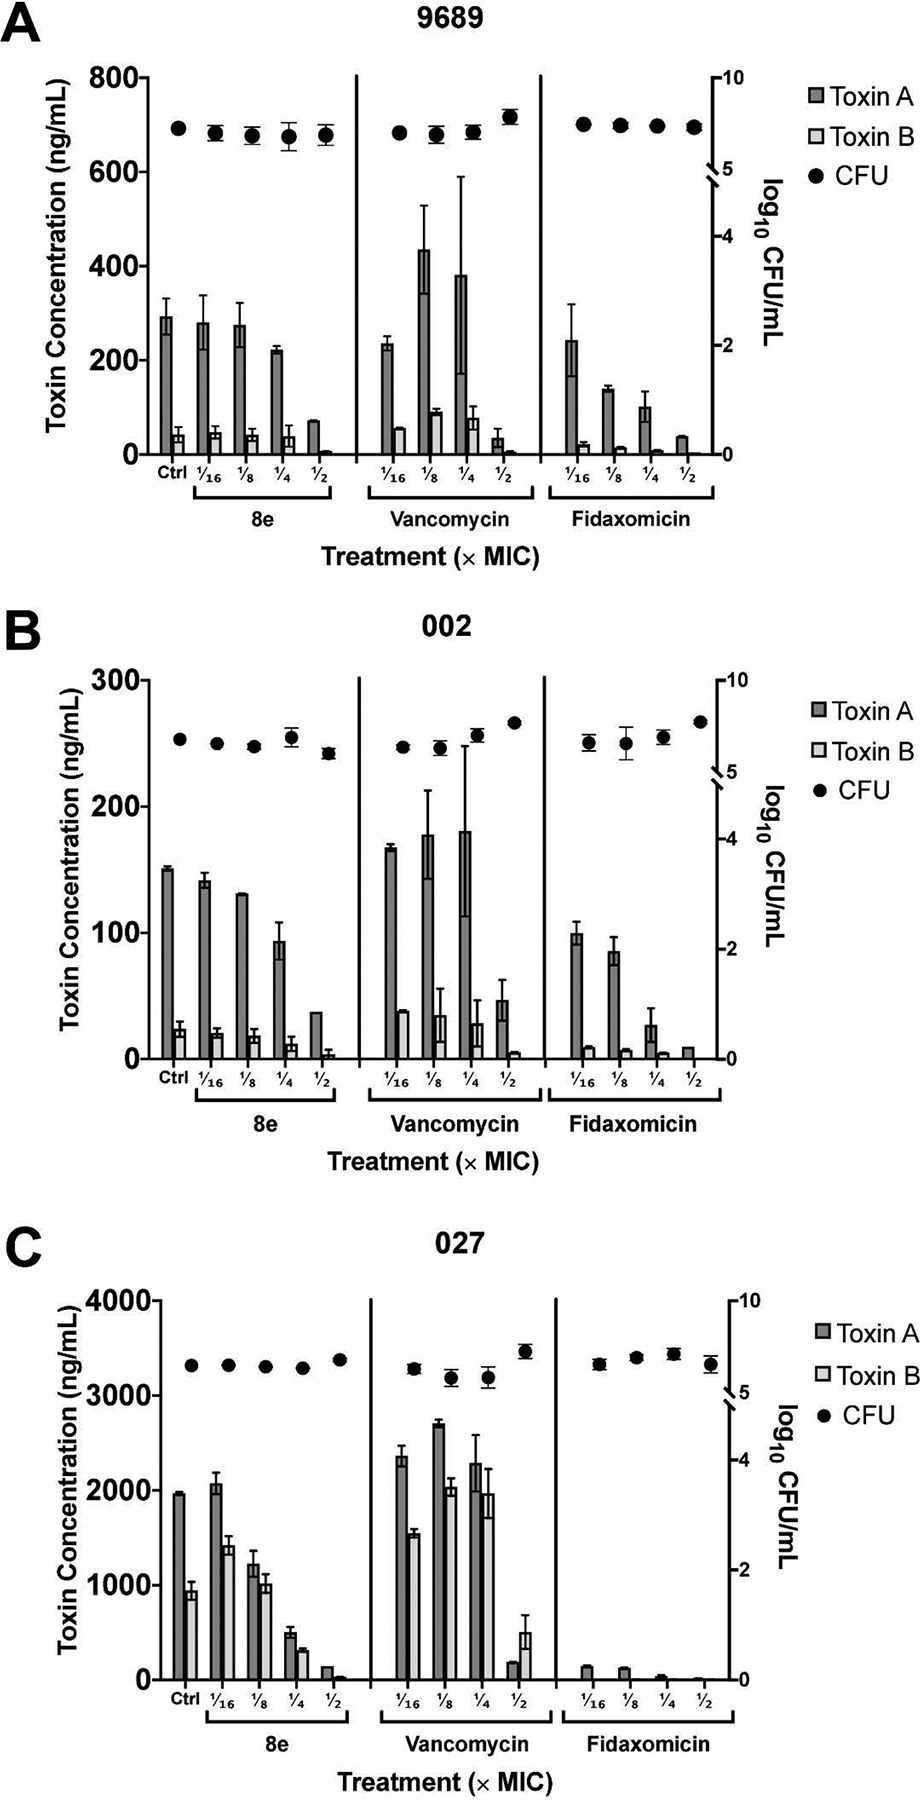
Effects of test compound 8e and control drugs vancomycin and fidaxomicin at sub-inhibitory concentrations (1/2 ×, 1/4 ×, 1/8 ×, and 1/16 × MIC) on the levels of Toxin A (dark grey bars), Toxin B (light grey bars) and CFU count (black circles) in (A) C. difficile ATCC 9689, (B) ribotype 002, and (C) ribotype 027 after 48 hours of anaerobic incubation. All toxin levels were normalized against drug-free control (dotted horizontal line from left y-axis = 1). CFU counts are relative to drug-free control values denoted by each respective dashed horizontal line from right y-axes: (A) y = 7.23, (B) y = 6.79 and (C) y = 6.48.
2.4. Mechanistic studies:
2.4.1. In vitro β’CH - σ affinity inhibitory assay
Selected compounds 5b, 5e, 8e, and 5f were also examined for their inhibitory activity against in vitro interaction between β’CH and σ, using the previously established NanoLuc protein complementation assay (PCA) [19]. The PPI pair consisted of a combination of C-LgBiT-σA and C-SmBiT-β’CH close to a 1:1 ratio, which generated luminescence unless prevented from binding by a test compound. We incubated the PPI pair with increasing concentrations of test compounds and plotted a dose-dependent decrease in luminescence, which was expressed as a percentage of inhibition of β’CH-σ as compared to the no-drug control (Fig. 5). We found that compounds 5b, 5e, and 8e showed good inhibitory activity, implying that their binding to the β’CH/σ interface was preserved following structural modifications to the lead compound 8a through the addition of Cl or trifluoromethyl (CF3) groups (Table 1 and Fig. 5). 5b, 5e, and 8e significantly decreased luminescence at relatively low concentrations, whereas 5f was less potent (Fig. 5). Comparison of 5b, 5e, and 8e with 5f suggests that the substitution of Cl or CF3 at the para-position of benzoic acid significantly improved the bonding interaction of benzoic acid with β’CH R278 and R281, and thus increased their inhibitory activity.
Fig. 5.
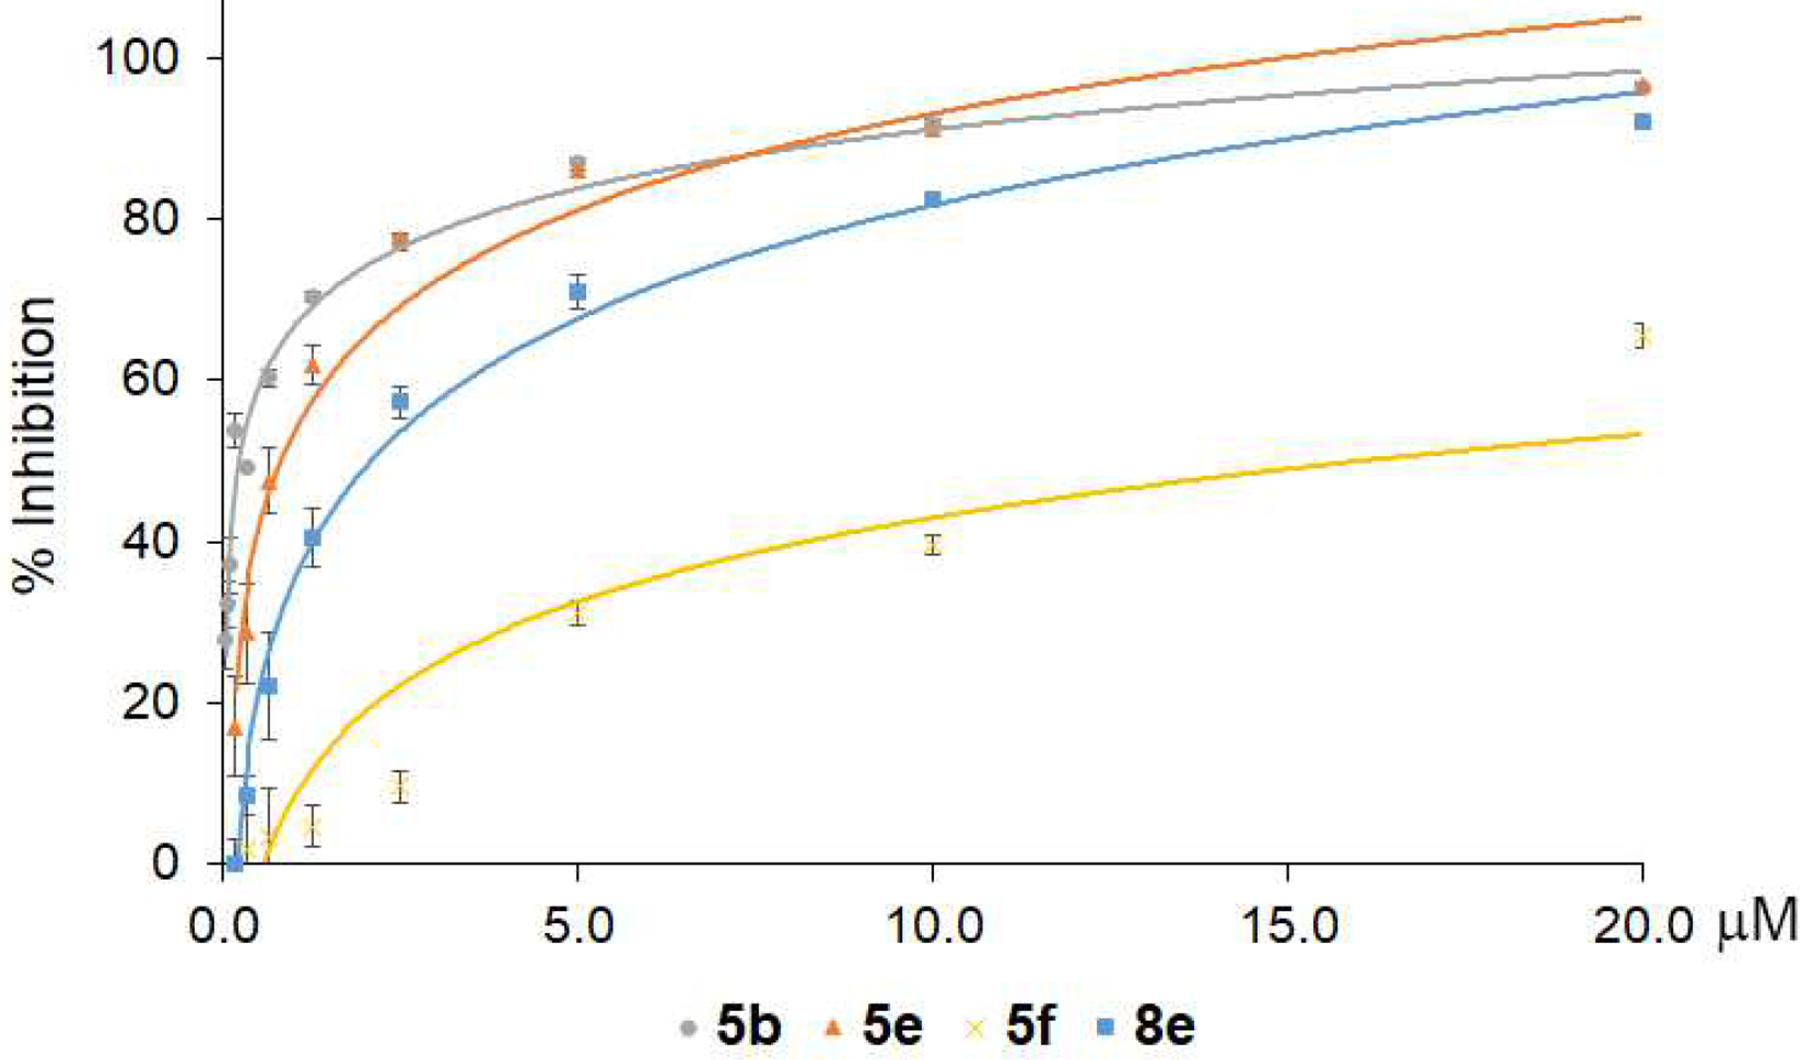
Inhibition of the β’CH-σ interaction by representative compounds 5b, 5e, 8e and 5f using the NanoLuc PCA system.
The half-inhibitory activity (IC50) of β’CH-σ interaction was calculated for compounds 5b, 5e, 8e and 5f and presented in Table 2. The IC50 for the compounds corresponded to their antimicrobial activities, especially for 5f, which has the highest IC50 and MIC values against S. pneumoniae (Tables 1 and 2). However, inhibition of target protein function, or in this case protein-protein interactions, is not the sole determinant of in vitro antimicrobial activities. There are a number of other contributing factors, such as solubility, membrane permeability, modification/degradation by bacterial enzyme, and efflux. Based on its potent antimicrobial activity (Table 1 and Fig. 3) and efficient inhibition β’CH-σ interaction (Fig. 5), compound 8e was chosen for further mechanistic studies.
Table 2.
IC50 of representative compounds inhibiting the β’CH-σ interaction
| No. | 5b | 5e | 5f | 8e |
|---|---|---|---|---|
| IC50 (μM) | 0.26 ± 0.04 | 0.73 ± 0.04 | 16.00 ± 0.04 | 2.12 ± 0.21 |
2.4.2. Confocal fluorescence microscope
The cellular effects of compound 8e were examined by fluorescent microscopy as previously described [14]. B. subtilis strain BS1048 carries a gfp-fused rpoC gene expressing the green fluorescence protein (GFP)-tagged β’ subunit of RNAP. As expected, fluorescently tagged RNAP localized to the central chromosome-containing lumen of the cell in the untreated control strain (Fig. 6 Ctrl; [42]). 8e elicited antimicrobial activity against B. subtilis BS1048 with a MIC of 2 μg/mL. When 8e was added at ½ MIC, fluorescence was seen to have delocalized from the nucleoid compared to the untreated control, which may be a result of decondensed chromosomes at the sub-MIC levels (Fig. 6 ½ MIC). As the concentration of 8e was increased, diffusion of the fluorescent signal into the cytosol became more pronounced (Fig. 6 1 MIC and 2 MIC). These results suggest that 8e can affect the localization of bacterial transcription complexes when assessed at the cellular level.
Fig. 6.
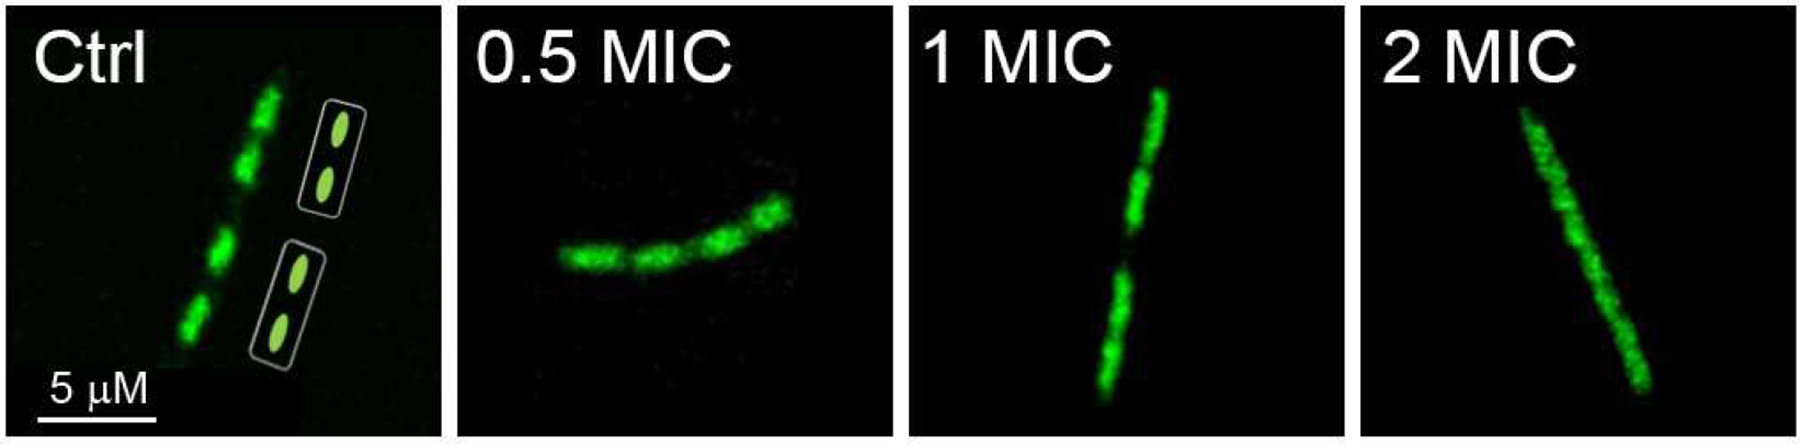
Confocal microscopy of B. subtilis with RNAP fluorescence where 8e was added to the culture at 0.5, 1, and 2 MIC.
2.4.3. Quantification of major cellular macromolecules
Next, we measured levels of major macromolecules in S. aureus ATCC 29213 cells treated with 8e and rifampicin, in comparison with a no-treatment control. 8e and rifampicin were added to staphylococcal cells in liquid culture at ¼, and ⅛ MIC levels at the end of the lag phase (OD600 = 0.2), and cells were harvested during mid-log phase (OD600 = 0.6). Consistent with their effect on cellular transcription, total levels of DNA were largely unaffected by either 8e or rifampicin, as compared to the untreated control (Fig. 7A). In contrast to a more conventional measurement of de novo RNA synthesis, the total RNA was measured in this case, reducing the apparent inhibition. Total RNA levels were significantly reduced following exposure to rifampicin, consistent with its known mechanism of action and previous observations [43]. Treatment with 8e closely mirrored the inhibitory effects of rifampicin, reducing the total levels of staphylococcal RNA in a dose-dependent manner (Fig. 7B). Interestingly, and in contrast to rifampicin, 8e also reduced the total levels of protein observed in S. aureus ATCC 29213 (Fig. 7C). We speculate that this difference could be explained by the difference in the mechanism of rifampicin and 8e. Rifampicin binds to an internal site on the β subunit of RNAP and interferes with the nascent RNA chain extension [44]. By contrast, 8e was designed to interact with the exposed β’CH region, which serves as a major binding site not only for σ but also for NusG, which is proposed to modulate translation [45]. A possibility that 8e may also inhibit RNAP binding to NusG will be investigated in future studies.
Fig. 7.
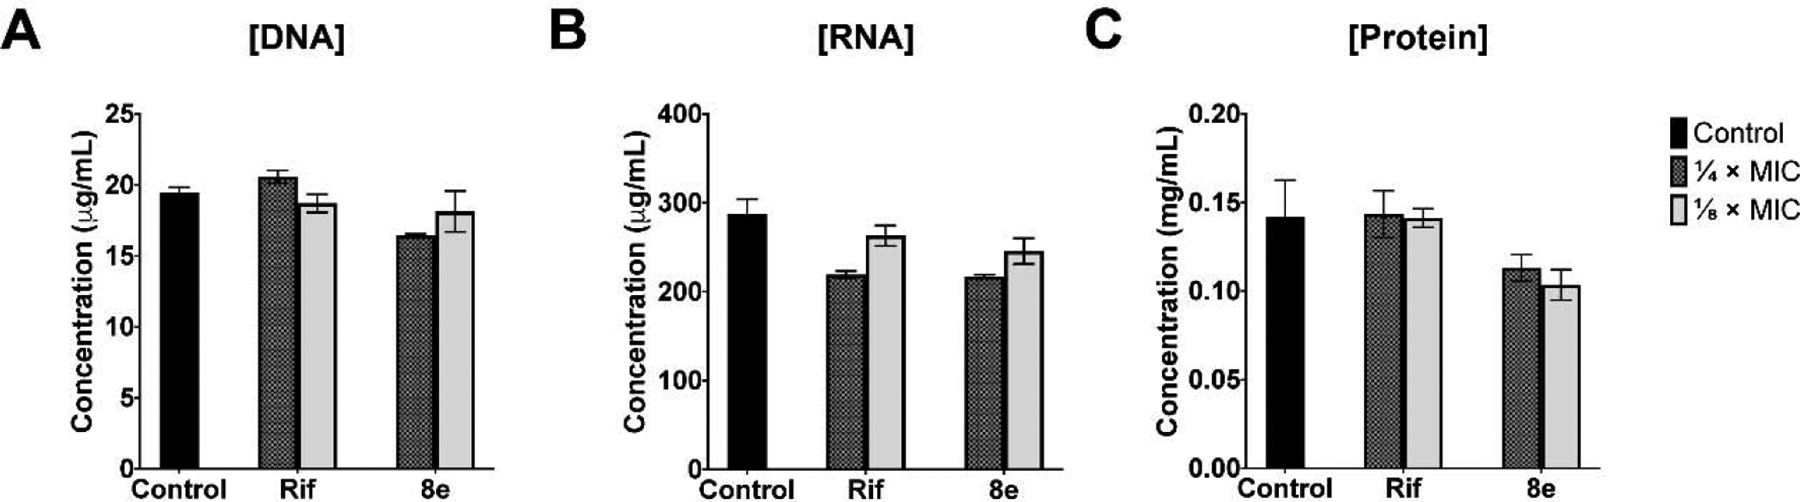
The effects of 8e on the levels of (A) DNA, (B) RNA and (C) protein of S. aureus ATCC 29213 when challenged at ¼ × (checkered bars) and ⅛ × (light grey bars) MICs compared to the control drug rifampicin (Rif) and the no-drug control (solid black bars).
Taking together, our observations that 8e inhibited the β’CH-σ interaction in vitro (Fig. 5 & Table 2), altered subcellular localization of the transcription complex (Fig. 6), and suppressed RNA synthesis at the cellular level (Fig. 7), strongly suggest that the antimicrobial activities of 8e resulted from the interference with bacterial transcription as designed.
2.5. Cytotoxicity
We evaluated the cytotoxicity of selected compounds 5b, 5f, 8e, and 5e against human HepG2 hepatocellular carcinoma and A549 lung carcinoma cell lines. All the tested compounds demonstrated very little cytotoxicity to these two human cancer cell lines, as compared with the cisplatin control (Table 3). This result indicates that our compounds have a potential for further development as novel antimicrobial agents.
Table 3.
Cytotoxicity and therapeutic index of selected compounds
| No. | CC50 (μM) | Therapeutic Indexa | ||
|---|---|---|---|---|
| HepG2 | A549 | HepG2 | A549 | |
| 5b | 3.90 × 10³ ± 2.83 | 2.40 × 10⁴ ± 3.20 | 1.82 × 10³ | 1.12 × 10⁴ |
| 5f | 3.41 × 10³ ± 6.43 | 1.48 × 10⁴ ± 7.49 | 1.71 × 10³ | 7.40 × 10³ |
| 8e | 387 ± 6.25 | 1.84 × 10³ ± 5.98 | 199 | 946 |
| 5e | 145 ± 7.87 | 129 ± 6.99 | 145 | 129 |
| DDPb | 4.35 ± 0.23 | 5.26 ± 0.32 | - | - |
Calculated by CC50 / ½ MIC;
DDP: Cisplatin
2.6. Metabolic stability
To explore the feasibility for further development, metabolic stability was investigated using compound 8a. Rat liver microsomes were employed with carbamazepine (CBZ) as the positive control according to the established method [46]. After microsomal incubation of 8a at 10 μM and 50 μM, the average percentage of the remaining compound was maintained at 100%, whereas that of carbamazepine reduced to 45% (Table 4). The results indicated that 8a was stable under the testing conditions and suggested its steady in vivo concentration with minimal metabolism.
Table 4.
Metabolic stability of 8a in rat liver Microsomes
| No. | % Metabolism | |
|---|---|---|
| 10 μM | 50 μM | |
| 8a | 98.28 ± 2.68 | 113.68 ± 13.06 |
| CBZ | 39.44 ± 3.32 | 48.86 ± 5.27 |
3. Conclusions
In this article, we report structural optimization, biological evaluation, and mechanistic validation of a bacterial transcription inhibitor targeting RNAP β’CH-σ binding interface. A series of benzoyl and benzyl benzoic acid derivatives were synthesized based on a dichlorobenzyl lead compound, and their antibacterial activities against S. pneumoniae and S. aureus strains were used to evaluate important pharmacophores. The results showed that structural flexibility at the benzyl group did not affect the antibacterial activity and that the rigid benzoyl structure may present the active conformation for activity [47]. Substitution on the right benzene ring is important, as reflected by changes in both protein-binding inhibition and antibacterial activities. Electron-withdrawing and donating substituents can both improve the antibacterial activity, while electron-withdrawing groups were preferred, probably because of increased ionic bonding interaction between benzoic acid and β’CH residues R278 and R281, which are critical for σ binding. Para-substituted derivatives demonstrated greater activity than meta isomers.
The most potent trifluoromethyl derivative 8e was chosen to test against a panel of clinically important Gram-positive pathogenic bacteria. The best result was obtained against S. epidermidis, with an MIC value of 0.5 μg/mL equal to that of vancomycin, the last-resort antibiotic in clinical practice. In addition, 8e displayed antibacterial activity against C. difficile, including type strain and clinical isolates. C. difficile, an opportunistic pathogen causing fatal diarrhea and associated diseases, produces cytotoxins responsible for hypervirulence. 8e inhibited toxin secretion of C. difficile at sub-MIC levels without affecting cell growth, similarly to fidaxomicin, another inhibitor of transcription that has been approved for treatment of C. difficile infections. antibiotic drug. The toxin secretion inhibitory effect of 8e was even more significant compared to vancomycin as a common therapeutic choice in clinics for treating C. difficile infections [48].
Mechanistic studies were first carried out using in vitro protein complement assay. Several representative compounds were evaluated, and IC50 values of these compounds reached the sub-μM level, suggesting structural modifications maintained the protein-ligand affinity. When the experiment was carried out within the whole-cell system, fluorescence microscopy demonstrated representative compound 8e started to disrupt the normal functions of RNAP and cause nucleoid delocalization in cells even at a sub-MIC level. Likewise, cell content quantification demonstrated that bacteria treated by sub-MIC of 8e reduced RNA production as rifampicin, a transcription inhibitor antibiotic drug, while normal cell growth was maintained.
Finally, cytotoxicity measurement showed that these series of compounds exhibited exceptionally low toxic effects on two human cell lines, and rat liver microsomal metabolism assay demonstrated significant stability compared to carbamazepine. The experimental results suggest that these series of compounds are potential for further studies towards antibiotic development.
4. Experimental section
4.1. Chemistry
4.1.1. General methods
All reactions were monitored by thin-layer chromatography (TLC) on glass sheets (Silica gel F254) which can be visualized under UV light. Flash chromatography was carried out using silica gel (200 – 300 mesh). Commercial reagents and anhydrous solvents were used without further purification. All yields reported were isolated yields. 1H NMR (400 MHz) and 13C NMR (100 MHz) spectra were generated from a BRUKER AVANCE-III spectrometer with TMS as an internal standard. Chemical shifts were expressed in δ (ppm) and coupling constants (J) in Hz. High resolution MS spectra were measured using a Micromass® QTOF-2 spectrometer by electron spray ionization. HPLC analysis was performed on an Agilent 1260 HPLC apparatus.
4.1.2. General procedure for the synthesis of intermediates 3a – j (Scheme 1)
To a Schlenk flask was added 4-(bromomethyl)-1-fluoro-2-nitrobenzene (234 mg, 1.0 mmol), an arylboronic acid from 2a – j (1.2 mmol), Pd(OAc)2 (12 mg, 0.05 mmol), PPh3 (26 mg, 10%), K3PO4 (425 mg, 2.0 mmol) and toluene (10 ml) under nitrogen. After stirring at 80 °C for 12 h, the solvent was removed by evaporation and water was added. The mixture was extracted with DCM. The organic layer was concentrated and purified by silica gel column chromatography with hexane/ethyl acetate (15 : 1 to 10 : 1) as the eluent.
4.1.3. Methyl 2-(4-fluoro-3-nitrobenzyl)benzoate (3a)
Colorless oil (207 mg, 72%). 1H NMR (400 MHz, CDCl3) δ 7.98 (dd, J = 7.8, 1.2 Hz, 1H), 7.83 (dd, J = 7.1, 2.1 Hz, 1H), 7.51 (td, J = 7.6, 1.3 Hz, 1H), 7.43 (ddd, J = 6.7, 4.1, 2.2 Hz, 1H), 7.36 (td, J = 7.8, 1.1 Hz, 1H), 7.25 – 7.28 (m, 1H), 7.16 (dd, J = 10.6, 8.7 Hz, 1H), 4.42 (s, 2H), 3.84 (s, 3H).
4.1.4. Methyl 4-chloro-2-(4-fluoro-3-nitrobenzyl)benzoate (3b)
Colorless oil (173 mg, 56%). 1H NMR (400 MHz, CDCl3) δ 7.94 (d, J = 8.4 Hz, 1H), 7.84 (dd, J = 7.0, 2.1 Hz, 1H), 7.43 (ddd, J = 8.3, 4.1, 2.4 Hz, 1H), 7.34 (dd, J = 8.4, 2.0 Hz, 1H), 7.28 – 7.15 (m, 2H), 4.40 (s, 2H), 3.84 (s, 3H).
4.1.5. Methyl 5-chloro-2-(4-fluoro-3-nitrobenzyl)benzoate (3c)
Colorless oil (200 mg, 62%). 1H NMR (400 MHz, CDCl3) δ 7.97 (d, J = 2.3 Hz, 1H), 7.81 (dd, J = 7.0, 2.1 Hz, 1H), 7.48 (dd, J = 8.2, 2.3 Hz, 1H), 7.41 (ddd, J = 8.5, 4.0, 2.4 Hz, 1H), 7.23 – 7.14 (m, 2H), 4.38 (s, 2H), 3.85 (s, 3H).
4.1.6. Methyl 2-(4-fluoro-3-nitrobenzyl)-4-methoxybenzoate (3d)
White solid (220 mg, 69%). 1H NMR (400 MHz, CDCl3) δ 8.02 (d, J = 8.8 Hz, 1H), 7.82 (dd, J = 7.1, 2.1 Hz, 1H), 7.44 (ddd, J = 8.2, 4.1, 2.4 Hz, 1H), 7.16 (dd, J = 10.4, 8.8 Hz, 1H), 6.84 (dd, J = 8.8, 2.5 Hz, 1H), 6.74 (d, J = 2.6 Hz, 1H), 4.42 (s, 2H), 3.85 (s, 3H), 3.80 (s, 3H).
4.1.7. Methyl 2-(4-fluoro-3-nitrobenzyl)-4-(trifluoromethyl)benzoate (3e)
Colorless oil (182 mg, 51%). 1H NMR (400 MHz, CDCl3) δ 8.08 (d, J = 8.2 Hz, 1H), 7.84 (dd, J = 7.0, 2.0 Hz, 1H), 7.63 (d, J = 8.2 Hz, 1H), 7.51 (s, 1H), 7.40 (ddd, J = 8.3, 3.9, 2.5 Hz, 1H), 7.20 (dd, J = 10.5, 8.7 Hz, 1H), 4.46 (s, 2H), 3.87 (s, 3H).
4.1.8. Methyl 2-(4-fluoro-3-nitrobenzyl)-5-(trifluoromethyl)benzoate (3f)
Colorless oil (210 mg, 64%). 1H NMR (400 MHz, CDCl3) δ 8.25 (s, 1H), 7.84 (dd, J = 7.0, 2.1 Hz, 1H), 7.75 (d, J = 8.0 Hz, 1H), 7.43 (ddd, J = 14.7, 8.1, 5.3 Hz, 2H), 7.20 (dd, J = 10.5, 8.6 Hz, 1H), 4.49 (s, 2H), 3.89 (s, 3H).
4.1.9. Methyl 4-fluoro-2-(4-fluoro-3-nitrobenzyl)benzoate (3g)
Colorless oil (200 mg, 72%). 1H NMR (400 MHz, CDCl3) δ 8.04 (dd, J = 8.7, 6.0 Hz, 1H), 7.84 (dd, J = 7.0, 2.1 Hz, 1H), 7.46 – 7.40 (m, 1H), 7.19 (dd, J = 10.5, 8.6 Hz, 1H), 7.05 (td, J = 8.4, 2.6 Hz, 1H), 6.93 (dd, J = 9.4, 2.6 Hz, 1H), 4.43 (s, 2H), 3.84 (s, 3H).
4.1.10. Methyl 3-(4-fluoro-3-nitrobenzyl)benzoate (3h)
Colorless oil (145 mg, 50%). 1H NMR (400 MHz, CDCl3) δ 7.94 (d, J = 7.6 Hz, 1H), 7.89 – 7.83 (m, 2H), 7.48 – 7.34 (m, 3H), 7.22 (dd, J = 10.5, 8.6 Hz, 1H), 4.08 (s, 2H), 3.91 (s, 3H).
4.1.11. Methyl 2-(4-fluoro-3-nitrobenzyl)-4-methylbenzoate (3i)
Colorless oil (130 mg, 45%). 1H NMR (400 MHz, CDCl3) δ 7.90 (d, J = 8.0 Hz, 1H), 7.82 (dd, J = 7.1, 2.1 Hz, 1H), 7.48 – 7.37 (m, 1H), 7.22 – 7.11 (m, 2H), 7.06 (s, 1H), 4.39 (s, 2H), 3.81 (d, J = 4.1 Hz, 3H), 2.39 (s, 3H).
4.1.12. 1-Fluoro-4-(2-methoxybenzyl)-2-nitrobenzene (3j)
Colorless oil (188 mg, 72%). 1H NMR (400 MHz, CDCl3) δ 7.90 (dd, J = 7.1, 2.0 Hz, 1H), 7.45 (ddd, J = 8.4, 4.2, 2.4 Hz, 1H), 7.25 (dd, J = 15.4, 1.6 Hz, 1H), 7.19 – 7.10 (m, 2H), 6.92 (t, J = 7.3 Hz, 1H), 6.88 (d, J = 8.2 Hz, 1H), 3.99 (s, 2H), 3.80 (s, 3H).
4.1.13. General procedure for the synthesis of intermediates 4a – i and 5j (Scheme 1)
To a flask was added a compound from 3a – j (0.2 mmol), 3,4-dichlorobenzenethiol (31 μL, 0.24 mmol), NaOAc (82 mg, 1 mmol) and EtOH 5 ml. The mixture was heated to reflux for 4 h. After cooling to room temperature, the precipitate was collected via filtration and washed with appropriate amount of EtOH and water successively and dried in vacuo to give the titled compound. Otherwise, water was added and then the mixture was extracted with EtOAc. The combined organic layers were dried over Na2SO4, concentrated and purified by chromatography with hexane/ethyl acetate (10 : 1) as the eluent to provide the titled compound.
4.1.14. Methyl 2-(4-((3,4-dichlorophenyl)thio)-3-nitrobenzyl)benzoate (4a)
Yellow solid (50 mg, 56%). 1H NMR (400 MHz, CDCl3) δ 8.04 (d, J = 1.5 Hz, 1H), 7.98 (dd, J = 7.8, 0.9 Hz, 1H), 7.66 (d, J = 2.0 Hz, 1H), 7.53 (d, J = 8.2 Hz, 1H), 7.50 (dd, J = 7.6, 1.1 Hz, 1H), 7.37 (dd, J = 11.2, 5.0 Hz, 2H), 7.25 (dd, J = 14.0, 5.2 Hz, 2H), 6.79 (d, J = 8.4 Hz, 1H), 4.42 (s, 2H), 3.86 (s, 3H).
4.1.15. Methyl 4-chloro-2-(4-((3,4-dichlorophenyl)thio)-3-nitrobenzyl)benzoate (4b)
Yellow solid (66 mg, 68%). 1H NMR (400 MHz, CDCl3) δ 8.03 (d, J = 1.5 Hz, 1H), 7.92 (d, J = 8.5 Hz, 1H), 7.66 (d, J = 2.0 Hz, 1H), 7.52 (d, J = 8.2 Hz, 1H), 7.38 (dd, J = 8.3, 2.0 Hz, 1H), 7.32 (dd, J = 8.4, 2.0 Hz, 1H), 7.20 (dd, J = 8.8, 1.8 Hz, 2H), 6.78 (d, J = 8.4 Hz, 1H), 4.38 (s, 2H), 3.84 (s, 3H).
4.1.16. Methyl 5-chloro-2-(4-((3,4-dichlorophenyl)thio)-3-nitrobenzyl)benzoate (4c)
Yellow solid (70 mg, 72%). 1H NMR (400 MHz, CDCl3) δ 8.00 (d, J = 1.5 Hz, 1H), 7.95 (d, J = 2.2 Hz, 1H), 7.64 (d, J = 2.0 Hz, 1H), 7.52 (d, J = 8.3 Hz, 1H), 7.45 (dd, J = 8.2, 2.3 Hz, 1H), 7.37 (dd, J = 8.3, 2.0 Hz, 1H), 7.22 – 7.14 (m, 2H), 6.77 (d, J = 8.4 Hz, 1H), 4.36 (s, 2H), 3.85 (s, 3H).
4.1.17. Methyl 2-(4-((3,4-dichlorophenyl)thio)-3-nitrobenzyl)-4-methoxybenzoate (4d)
Yellow solid (73 mg, 76%). 1H NMR (400 MHz, CDCl3) δ 8.01 (d, J = 2.0 Hz 1H), 8.00 (d, J = 8.9 Hz, 1H), 7.65 (d, J = 1.9 Hz, 1H), 7.51 (d, J = 8.3 Hz, 1H), 7.37 (dd, J = 8.3, 1.9 Hz, 1H), 7.23 (dd, J = 8.4, 1.6 Hz, 1H), 6.82 (dd, J = 8.8, 2.6 Hz, 1H), 6.77 (d, J = 8.4 Hz, 1H), 6.72 (d, J = 2.5 Hz, 1H), 4.40 (s, 2H), 3.84 (s, 3H), 3.80 (s, 3H).
4.1.18. Methyl 2-(4-((3,4-dichlorophenyl)thio)-3-nitrobenzyl)-4-(trifluoromethyl)benzoate (4e)
Yellow solid (58 mg, 57%). 1H NMR (400 MHz, CDCl3) δ 8.08 (d, J = 8.3 Hz, 1H), 8.06 (d, J = 1.5 Hz, 1H), 7.68 (d, J = 2.0 Hz, 1H), 7.62 (d, J = 8.7 Hz, 1H), 7.54 (d, J = 8.3 Hz, 1H), 7.52 (s, 1H), 7.38 – 7.42 (m, 1H), 7.19 (dd, J = 8.4, 1.8 Hz, 1H), 6.80 (d, J = 8.4 Hz, 1H), 4.45 (s, 2H), 3.89 (s, 3H).
4.1.19. Methyl 2-(4-((3,4-dichlorophenyl)thio)-3-nitrobenzyl)-5-(trifluoromethyl)benzoate (4f)
Yellow solid (64 mg, 62%). 1H NMR (400 MHz, CDCl3) δ 8.23 (s, 1H), 8.03 (s, 1H), 7.72 (d, J = 8.3 Hz, 1H), 7.65 (d, J = 2.0 Hz, 1H), 7.56 (d, J = 2.1 Hz, 2H), 7.52 (d, J = 8.3 Hz, 1H), 7.20 (dd, J = 8.5, 1.8 Hz, 1H), 6.78 (d, J = 8.4 Hz, 1H), 4.46 (s, 2H), 3.88 (s, 3H).
4.1.20. Methyl 2-(4-((3,4-dichlorophenyl)thio)-3-nitrobenzyl)-4-fluorobenzoate (4g)
Yellow solid (61 mg, 65%). 1H NMR (400 MHz, CDCl3) δ 8.02 (dd, J = 8.7, 6.0 Hz, 2H), 7.66 (d, J = 2.0 Hz, 1H), 7.52 (d, J = 8.3 Hz, 1H), 7.38 (dd, J = 8.2, 2.0 Hz, 1H), 7.21 (dd, J = 8.5, 1.8 Hz, 1H), 7.06 – 6.98 (m, 1H), 6.91 (dd, J = 9.4, 2.5 Hz, 1H), 6.79 (d, J = 8.4 Hz, 1H), 4.40 (s, 2H), 3.84 (s, 3H).
4.1.21. Methyl 3-(4-((3,4-dichlorophenyl)thio)-3-nitrobenzyl)benzoate (4h)
Yellow solid (63 mg, 70%). 1H NMR (400 MHz, CDCl3) δ 8.06 (d, J = 1.6 Hz, 1H), 7.91 (s, 1H), 7.85 (s, 1H), 7.66 (d, J = 1.9 Hz, 1H), 7.53 (d, J = 8.2 Hz, 1H), 7.41 – 7.34 (m, 3H), 7.21 (dd, J = 8.3, 1.8 Hz, 1H), 6.80 (d, J = 8.4 Hz, 1H), 4.04 (s, 2H), 3.91 (s, 3H).
4.1.22. Methyl 2-(4-((3,4-dichlorophenyl)thio)-3-nitrobenzyl)-4-methylbenzoate (4i)
Yellow solid (67 mg, 72%). 1H NMR (400 MHz, CDCl3) δ 8.01 (d, J = 1.3 Hz, 1H), 7.88 (d, J = 8.0 Hz, 1H), 7.64 (d, J = 1.9 Hz, 1H), 7.51 (d, J = 8.3 Hz, 1H), 7.39 (dd, J = 9.9, 1.9 Hz, 1H), 7.35 (dd, J = 5.7, 1.9 Hz, 1H), 7.22 (dd, J = 8.5, 1.6 Hz, 1H), 7.14 (d, J = 7.9 Hz, 1H), 6.76 (d, J = 8.4 Hz, 1H), 4.36 (s, 2H), 3.81 (s, 3H), 2.37 (s, 3H).
4.1.23. General procedure for the synthesis of intermediates 5a – i (Scheme 1)
The methyl ester of the title compound (0.1 mmol) was hydrolyzed with 1 M NaOH (0.5 mmol) in dioxane and H2O (v/v = 1 : 1) at 50 °C overnight. The mixture was then diluted with a small amount of water and washed twice with DCM. The aqueous solution was acidified by addition of 2 M HCl. The precipitate was collected by filtration and washed with water to afford the title compound. If the compound was not pure at this stage of the procedure, it was purified by column chromatography with DCM/MeOH (25 : 1) as the eluent.
4.1.24. 2-(4-((3,4-Dichlorophenyl)thio)-3-nitrobenzyl)benzoic acid (5a)
Yellow solid (30 mg, 70%); mp 118 – 120 °C; 1H NMR (400 MHz, DMSO-d6) δ 8.12 (s, 1H), 7.87 (d, J = 1.4 Hz, 1H), 7.73 (dd, J = 11.5, 8.3 Hz, 2H), 7.52 (dd, J = 11.0, 4.6 Hz, 2H), 7.29 (t, J = 7.1 Hz, 1H), 7.21 (dd, J = 6.6, 3.4 Hz, 2H), 6.89 (d, J = 8.3 Hz, 1H), 4.41 (s, 2H). 13C NMR (100 MHz, DMSO-d6) δ 171.1, 145.8, 142.3, 139.0, 137.4, 136.4, 135.7, 135.2, 133.4, 133.0, 132.6, 132.5, 131.1, 130.3, 129.89, 129.85, 129.6, 126.6, 125.9, 37.9. HRMS (ESI): calcd for C20H12Cl2NO4S, [M-H]− 431.9870, found 431.9879. HPLC purity: 96.90%.
4.1.25. 4-Chloro-2-(4-((3,4-dichlorophenyl)thio)-3-nitrobenzyl)benzoic acid (5b)
Yellow solid (26 mg, 56%); mp 243 – 245 °C; 1H NMR (400 MHz, DMSO-d6) δ 8.18 (s, 1H), 7.89 (d, J = 1.8 Hz, 1H), 7.75 (d, J = 8.3 Hz, 1H), 7.70 (d, J = 8.3 Hz, 1H), 7.53 (dd, J = 8.3, 1.5 Hz, 2H), 7.29 (s, 1H), 7.24 (dd, J = 8.3, 1.6 Hz, 1H), 6.91 (d, J = 8.3 Hz, 1H), 4.43 (s, 2H). 13C NMR (100 MHz, DMSO-d6) δ 169.9, 145.8, 141.7, 141.4, 136.5, 135.7, 135.3, 133.7, 133.4, 133.0, 132.9, 132.6, 132.5, 132.2, 130.4, 129.6, 126.4, 126.0, 37.4. HRMS (ESI): calcd for C20H11Cl3NO4S, [M-H]− 465.9480, found 465.9486. HPLC purity: 99.68%.
4.1.26. 5-Chloro-2-(4-((3,4-dichlorophenyl)thio)-3-nitrobenzyl)benzoic acid (5c)
Yellow solid (19 mg, 40%); mp 186 – 188 °C; 1H NMR (400 MHz, DMSO-d6) δ 14.91 – 12.01 (br, 1H), 8.06 (s, 1H), 7.88 (s, 1H), 7.82 (s, 1H), 7.76 (d, J = 8.1 Hz, 1H), 7.55 (t, J = 7.6 Hz, 2H), 7.39 (t, J = 7.3 Hz, 2H), 6.92 (d, J = 8.2 Hz, 1H), 4.39 (s, 2H). 13C NMR (100 MHz, DMSO-d6) δ 168.0, 145.7, 140.7, 139.4, 136.6, 135.44, 135.36, 133.9, 133.7, 133.5, 133.4, 133.0, 132.6, 132.3, 132.0, 131.8, 130.4, 129.7, 125.8, 37.2. HRMS (ESI): calcd for C20H11Cl3NO4S, [M-H]− 465.9480, found 465.9486. HPLC purity: 100.00%.
4.1.27. 2-(4-((3,4-Dichlorophenyl)thio)-3-nitrobenzyl)-4-methoxybenzoic acid (5d)
Yellow solid (23 mg, 50%); mp 196 – 198 °C; 1H NMR (400 MHz, CDCl3) δ 8.10 (d, J = 8.8 Hz, 1H), 8.04 (s, 1H), 7.64 (d, J = 1.9 Hz, 1H), 7.50 (d, J = 8.3 Hz, 1H), 7.36 (dd, J = 8.3, 1.9 Hz, 1H), 7.20 (d, J = 8.2 Hz, 1H), 6.85 (dd, J = 8.8, 2.2 Hz, 1H), 6.76 (d, J = 8.4 Hz, 1H), 6.73 (d, J = 2.2 Hz, 1H), 4.42 (s, 2H), 3.85 (s, 3H). 13C NMR (100 MHz, CDCl3) δ 171.0, 163.4, 145.3, 144.2, 139.5, 136.9, 134.9, 134.64, 134.59, 134.5, 134.3, 133.9, 131.7, 128.4, 125.8, 120.1, 118.0, 111.7, 55.5, 39.1. HRMS (ESI): calcd for C21H14Cl2NO5S, [M-H]− 461.9975, found 461.9976. HPLC purity: 97.38%.
4.1.28. 2-(4-((3,4-Dichlorophenyl)thio)-3-nitrobenzyl)-4-(trifluoromethyl)benzoic acid (5e)
Yellow solid (31 mg, 60%); mp 79 – 81 °C; 1H NMR (400 MHz, DMSO-d6) δ 13.61 (s, 1H), 8.10 (d, J = 0.8 Hz, 1H), 8.01 (d, J = 8.1 Hz, 1H), 7.88 (d, J = 1.8 Hz, 1H), 7.82 (s, 1H), 7.74 (dd, J = 12.9, 8.3 Hz, 2H), 7.54 (dd, J = 8.3, 1.9 Hz, 1H), 7.40 (dd, J = 8.3, 1.2 Hz, 1H), 6.93 (d, J = 8.4 Hz, 1H), 4.48 (s, 2H). 13C NMR (100 MHz, DMSOd6) δ 168.2, 145.6, 141.6, 140.2, 136.6, 135.62, 135.44, 135.43, 133.7, 133.6, 133.0, 132.6, 132.2, 131.2 (q, J = 31.7 Hz), 131.8, 129.7, 128.6 (d, J = 3.5 Hz), 125.9, 124.2 (d, J = 3.6 Hz), 124.1 (q, J = 271.1 Hz), 37.5. HRMS (ESI): calcd for C21H11Cl2F3NO4S, [M-H]− 499.9743, found 499.9741. HPLC purity: 100.00%.
4.1.29. 2-(4-((3,4-Dichlorophenyl)thio)-3-nitrobenzyl)-5-(trifluoromethyl)benzoic acid (5f)
Yellow solid (33 mg, 65%); mp 167 – 169 °C; 1H NMR (400 MHz, DMSO-d6) δ 13.64 (s, 1H), 8.11 (s, 2H), 7.83 – 7.95 (m, 2H), 7.76 (d, J = 8.2 Hz, 1H), 7.57 (dd, J = 24.6, 7.7 Hz, 2H), 7.41 (d, J = 8.0 Hz, 1H), 6.93 (d, J = 8.3 Hz, 1H), 4.50 (s, 2H). 13C NMR (100 MHz, DMSO-d6) δ 167.8, 145.7, 145.3, 140.0, 136.6, 135.5, 135.4, 133.7, 133.6, 133.3, 133.0, 132.6, 132.4, 132.2, 129.7, 128.8 (d, J = 3.1 Hz), 128.0 (d, J = 32.4 Hz), 127.5 (d, J = 3.7 Hz), 126.0, 124.2 (q, J = 270.5 Hz), 37.6. HRMS (ESI): calcd for C21H11Cl2F3NO4S, [M-H]− 499.9743, found 499.9751. HPLC purity: 99.80%.
4.1.30. 2-(4-((3,4-Dichlorophenyl)thio)-3-nitrobenzyl)-4-fluorobenzoic acid (5g)
Yellow solid (22 mg, 49%); mp 97 – 99 °C; 1H NMR (400 MHz, DMSO-d6) δ 8.13 (s, 1H), 7.95 – 7.83 (m, 2H), 7.76 (d, J = 8.3 Hz, 1H), 7.54 (d, J = 6.9 Hz, 1H), 7.49 (d, J = 8.1 Hz, 1H), 7.15 (d, J = 9.9 Hz, 1H), 7.10 (t, J = 8.5 Hz, 1H), 6.91 (d, J = 8.3 Hz, 1H), 4.45 (s, 2H). 13C NMR (100 MHz, DMSO-d6) δ 169.4, 163.4 (d, J = 248.5 Hz), 145.8, 143.3 (d, J = 8.3 Hz), 141.1, 136.5, 135.6, 135.3, 133.6, 133.5, 133.2, 133.0, 132.6, 132.4, 129.6, 125.9, 117.9 (d, J = 21.1 Hz), 113.7 (d, J = 20.8 Hz), 37.67. HRMS (ESI): calcd for C20H11Cl2FNO4S, [M-H]− 449.9775, found 449.9782. HPLC purity: 99.75%.
4.1.31. 3-(4-((3,4-Dichlorophenyl)thio)-3-nitrobenzyl)benzoic acid (5h)
Yellow solid (35 mg, 80%); mp 161 – 163 °C; 1H NMR (400 MHz, DMSO-d6) δ 8.13 (s, 1H), 7.91 (s, 1H), 7.79 (s, 1H), 7.76 (d, J = 8.1 Hz, 2H), 7.55 (d, J = 8.0 Hz, 1H), 7.49 (d, J = 8.2 Hz, 1H), 7.37 – 7.25 (m, 2H), 6.95 (d, J = 8.3 Hz, 1H), 4.06 (s, 2H). 13C NMR (100 MHz, DMSO-d6) δ 169.9, 145.9, 141.2, 139.8, 137.2, 136.5, 135.6, 135.4, 133.5, 133.0, 132.6, 132.4, 131.4, 129.99, 129.96, 128.5, 127.8, 125.8, 39.9. HRMS (ESI): calcd for C20H12Cl2NO4S, [M-H]− 431.9870, found 431.9869. HPLC purity: 99.80%.
4.1.32. 2-(4-((3,4-Dichlorophenyl)thio)-3-nitrobenzyl)-4-methylbenzoic acid (5i)
Yellow solid (20 mg, 45%); mp 182 – 184 °C; 1H NMR (400 MHz, DMSO-d6) δ 12.82 (s, 1H), 8.04 (d, J = 1.2 Hz, 1H), 7.90 (s, 1H), 7.78 (dd, J = 11.3, 8.1 Hz, 2H), 7.54 (dd, J = 8.3, 1.8 Hz, 1H), 7.40 (dd, J = 8.3, 1.3 Hz, 1H), 7.24 – 7.13 (m, 2H), 6.92 (d, J = 8.4 Hz, 1H), 4.39 (s, 2H), 2.32 (s, 3H). 13C NMR (100 MHz, DMSO-d6) δ 168.8, 145.6, 142.8, 141.2, 141.0, 136.6, 135.44, 135.38, 133.5, 133.2, 133.0, 132.9, 132.6, 132.3, 131.5, 129.6, 128.0, 127.7, 125.7, 37.9, 21.4. HRMS (ESI): calcd for C21H14Cl2NO4S, [M-H]− 446.0026, found 446.0018. HPLC purity: 99.20%.
4.1.33. (3,4-Dichlorophenyl)(4-(2-methoxybenzyl)-2-nitrophenyl)sulfane (5j)
Yellow solid (23 mg, 66%); mp 105 – 107 °C; 1H NMR (400 MHz, CDCl3) δ 8.11 (s, 1H), 7.66 (d, J = 1.6 Hz, 1H), 7.53 (d, J = 8.3 Hz, 1H), 7.39 (dd, J = 8.2, 1.7 Hz, 1H), 7.32 – 7.22 (m, 2H), 7.13 (d, J = 7.2 Hz, 1H), 6.91 (dd, J = 16.1, 8.0 Hz, 2H), 6.80 (d, J = 8.4 Hz, 1H), 3.99 (s, 2H), 3.82 (s, 3H). 13C NMR (100 MHz, CDCl3) δ 157.2, 145.4, 140.0, 136.8, 134.5, 134.44, 134.43, 134.2, 133.9, 131.9, 131.7, 130.3, 128.5, 128.3, 127.7, 125.8, 120.7, 110.7, 55.3, 35.3. HRMS (ESI): calcd for C20H14Cl2NO3S, [M-H]− 418.0077, found 418.0059. HPLC purity: 98.67%.
4.1.34. General procedure for the synthesis of intermediates 6a – h (Scheme 2)
In a sealed tube, a compound from 3a – h or 3j (0.5 mmol), NBS (445 mg, 2.5 mmol) and water (45 μL, 2.5 mmol) were added CHCl3 (2.0 mL). After heating at 65 – 85 °C for 12 h, the reaction mixture was quenched with Na2S2O3 aqueous solution. The mixture was extracted with DCM, washed by brine, dried over Na2SO4 and concentrated. The titled compounds were purified by chromatography with hexane/ethyl acetate (15 : 1 to 8 : 1) as the eluent.
4.1.35. Methyl 2-(4-fluoro-3-nitrobenzoyl)benzoate (6a)
White solid (81 mg, 53%). 1H NMR (400 MHz, CDCl3) δ 8.37 (dd, J = 7.1, 2.1 Hz, 1H), 8.12 (d, J = 8.2 Hz, 1H), 8.10 – 8.07 (m, 1H), 7.71 (td, J = 7.5, 1.1 Hz, 1H), 7.64 (td, J = 7.6, 1.1 Hz, 1H), 7.42 – 7.35 (m, 2H), 3.75 (s, 3H).
4.1.36. Methyl 4-chloro-2-(4-fluoro-3-nitrobenzoyl)benzoate (6b)
White solid (76 mg, 45%). 1H NMR (400 MHz, CDCl3) δ 8.36 (dd, J = 7.1, 2.1 Hz, 1H), 8.16 – 8.02 (m, 2H), 7.61 (dd, J = 8.4, 2.0 Hz, 1H), 7.46 – 7.32 (m, 2H), 3.74 (s, 3H).
4.1.37. Methyl 5-chloro-2-(4-fluoro-3-nitrobenzoyl)benzoate (6c)
Colorless jelly (126 mg, 74%). 1H NMR (400 MHz, CDCl3) δ 8.35 (dd, J = 7.1, 2.1 Hz, 1H), 8.09 (d, J = 1.9 Hz, 1H), 8.08 – 8.04 (m, 1H), 7.68 (dd, J = 8.2, 2.0 Hz, 1H), 7.39 (dd, J = 9.8, 8.9 Hz, 1H), 7.34 (d, J = 8.2 Hz, 1H), 3.76 (s, 3H).
4.1.38. Methyl 2-(4-fluoro-3-nitrobenzoyl)-4-methoxybenzoate (6d)
Colorless oil (93 mg, 56%). 1H NMR (400 MHz, CDCl3) δ 8.36 (dd, J = 7.1, 2.2 Hz, 1H), 8.13 – 8.03 (m, 2H), 7.37 (dd, J = 10.0, 8.8 Hz, 1H), 7.08 (dd, J = 8.8, 2.5 Hz, 1H), 6.83 (d, J = 2.5 Hz, 1H), 3.90 (s, 3H), 3.70 (s, 3H).
4.1.39. Methyl 2-(4-fluoro-3-nitrobenzoyl)-4-(trifluoromethyl)benzoate (6e)
Colorless jelly (160 mg, 86%). 1H NMR (400 MHz, CDCl3) δ 8.37 (dd, J = 7.0, 2.2 Hz, 1H), 8.25 (d, J = 8.2 Hz, 1H), 8.06 (ddd, J = 8.7, 4.2, 2.3 Hz, 1H), 7.91 (d, J = 7.5 Hz, 1H), 7.65 (s, 1H), 7.42 (dd, J = 9.8, 8.9 Hz, 1H), 3.78 (s, 3H).
4.1.40. Methyl 2-(4-fluoro-3-nitrobenzoyl)-5-(trifluoromethyl)benzoate (6f)
Colorless oil (102 mg, 55%). 1H NMR (400 MHz, CDCl3) δ 8.39 (s, 1H), 8.36 (dd, J = 7.1, 2.2 Hz, 1H), 8.07 (ddd, J = 8.6, 4.1, 2.2 Hz, 1H), 7.97 (d, J = 7.9 Hz, 1H), 7.52 (d, J = 7.9 Hz, 1H), 7.41 (dd, J = 9.8, 8.9 Hz, 1H), 3.81 (s, 3H).
4.1.41. Methyl 4-fluoro-2-(4-fluoro-3-nitrobenzoyl)benzoate (6g)
Colorless oil (80 mg, 50%). 1H NMR (400 MHz, CDCl3) δ 8.36 (dd, J = 7.1, 2.2 Hz, 1H), 8.16 (dd, J = 8.7, 5.3 Hz, 1H), 8.08 (ddd, J = 8.6, 4.1, 2.2 Hz, 1H), 7.40 (dd, J = 9.9, 8.9 Hz, 1H), 7.31 (td, J = 8.4, 2.5 Hz, 1H), 7.08 (dd, J = 8.0, 2.5 Hz, 1H), 3.74 (s, 3H).
4.1.42. Methyl 3-(4-fluoro-3-nitrobenzoyl)benzoate (6h)
Colorless oil (45 mg, 60%). 1H NMR (400 MHz, CDCl3) δ 8.51 (dd, J = 7.1, 2.1 Hz, 1H), 8.40 (s, 1H), 8.33 (d, J = 7.8 Hz, 1H), 8.12 (ddd, J = 8.5, 4.0, 2.2 Hz, 1H), 7.99 (d, J = 7.7 Hz, 1H), 7.65 (t, J = 7.8 Hz, 1H), 7.47 (dd, J = 10.0, 8.8 Hz, 1H), 3.96 (s, 3H).
4.1.43. (4-Fluoro-3-nitrophenyl)(2-methoxyphenyl)methanone (6i)
Colorless oil (106 mg, 77%). 1H NMR (400 MHz, CDCl3) δ 8.43 (dd, J = 7.1, 2.0 Hz, 1H), 8.09 (ddd, J = 8.5, 4.0, 2.1 Hz, 1H), 7.64 (dd, J = 8.8, 2.4 Hz, 1H), 7.55 (d, J = 2.4 Hz, 1H), 7.42 – 7.33 (m, 1H), 6.92 (d, J = 8.9 Hz, 1H), 3.71 (s, 3H).
4.1.44. General procedure for the synthesis of intermediates 7a – 7h (Scheme 2)
To a flask was added a compound from 6a – h (0.2 mmol), 3,4-dichlorobenzenethiol (31 μL, 0.24 mmol), NaOAc (82 mg, 1 mmol) and EtOH (5 ml). The mixture was heated to reflux for 4 h. After cooling to room temperature, the precipitate was collected via filtration and washed with appropriate amount of EtOH and water successively and dried in vacuo to give the titled compound. Otherwise, water was added and then the mixture was extracted with EtOAc. The combined organic layers were dried over Na2SO4, concentrated, and purified by chromatography with hexane/ethyl acetate (10 : 1 to 8 : 1) as the eluent to provide the titled compound.
4.1.45. Methyl 2-(4-((3,4-dichlorophenyl)thio)-3-nitrobenzoyl)benzoate (7a)
Yellow solid, 85 mg, 92% yield. 1H NMR (400 MHz, CDCl3) δ 8.55 (d, J = 1.6 Hz, 1H), 8.11 (d, J = 7.8 Hz, 1H), 7.82 (dd, J = 8.6, 1.7 Hz, 1H), 7.72 (d, J = 1.9 Hz, 1H), 7.69 (d, J = 6.7 Hz, 1H), 7.64 (d, J = 7.7 Hz, 1H), 7.61 (d, J = 8.3 Hz, 1H), 7.45 (dd, J = 8.2, 1.9 Hz, 1H), 7.37 (d, J = 7.4 Hz, 1H), 6.95 (d, J = 8.5 Hz, 1H), 3.76 (s, 3H).
4.1.46. Methyl 4-chloro-2-(4-((3,4-dichlorophenyl)thio)-3-nitrobenzoyl)benzoate (7b)
Yellow solid (61mg, 62%). 1H NMR (400 MHz, CDCl3) δ 8.53 (d, J = 1.7 Hz, 1H), 8.04 (d, J = 8.4 Hz, 1H), 7.78 (dd, J = 8.6, 1.8 Hz, 1H), 7.70 (d, J = 1.9 Hz, 1H), 7.58 (dd, J = 12.4, 5.2 Hz, 2H), 7.43 (dd, J = 8.2, 2.0 Hz, 1H), 7.32 (d, J = 1.9 Hz, 1H), 6.93 (d, J = 8.5 Hz, 1H), 3.74 (s, 3H).
4.1.47. Methyl 5-chloro-2-(4-((3,4-dichlorophenyl)thio)-3-nitrobenzoyl)benzoate (7c)
Yellow solid (60 mg, 61%). 1H NMR (400 MHz, CDCl3) δ 8.50 (d, J = 1.8 Hz, 1H), 8.06 (d, J = 2.0 Hz, 1H), 7.78 (dd, J = 8.6, 1.9 Hz, 1H), 7.70 (d, J = 2.0 Hz, 1H), 7.64 (dd, J = 8.1, 2.1 Hz, 1H), 7.59 (d, J = 8.3 Hz, 1H), 7.42 (dd, J = 8.3, 2.0 Hz, 1H), 7.30 (d, J = 8.1 Hz, 1H), 6.93 (d, J = 8.6 Hz, 1H), 3.75 (s, 3H).
4.1.48. Methyl 2-(4-((3,4-dichlorophenyl)thio)-3-nitrobenzoyl)-4-methoxybenzoate (7d)
Yellow solid (65 mg, 66%). 1H NMR (400 MHz, CDCl3) δ 8.53 (d, J = 1.7 Hz, 1H), 8.04 (d, J = 8.8 Hz, 1H), 7.80 (dd, J = 8.5, 1.7 Hz, 1H), 7.70 (d, J = 1.9 Hz, 1H), 7.58 (d, J = 8.3 Hz, 1H), 7.42 (dd, J = 8.2, 1.9 Hz, 1H), 7.05 (dd, J = 8.8, 2.5 Hz, 1H), 6.92 (d, J = 8.6 Hz, 1H), 6.79 (d, J = 2.5 Hz, 1H), 3.88 (s, 3H), 3.70 (s, 3H).
4.1.49. Methyl 2-(4-((3,4-dichlorophenyl)thio)-3-nitrobenzoyl)-4-(trifluoromethyl)benzoate (7e)
Yellow solid (76 mg, 72%). 1H NMR (400 MHz, CDCl3) δ 8.54 (d, J = 1.9 Hz, 1H), 8.22 (d, J = 8.2 Hz, 1H), 7.88 (s, 1H), 7.75 (dd, J = 8.6, 1.7 Hz, 1H), 7.70 (d, J = 1.8 Hz, 1H), 7.59 (d, J = 8.2 Hz, 2H), 7.43 (dd, J = 8.2, 1.7 Hz, 1H), 6.94 (d, J = 8.5 Hz, 1H), 3.78 (s, 2H).
4.1.50. Methyl 2-(4-((3,4-dichlorophenyl)thio)-3-nitrobenzoyl)-5-(trifluoromethyl)benzoate (7f)
Yellow solid (73 mg, 69%). 1H NMR (400 MHz, CDCl3) δ 8.52 (d, J = 1.8 Hz, 1H), 8.37 (s, 1H), 7.94 (d, J = 7.8 Hz, 1H), 7.77 (dd, J = 8.6, 1.9 Hz, 1H), 7.70 (d, J = 2.0 Hz, 1H), 7.59 (d, J = 8.3 Hz, 1H), 7.48 (d, J = 7.9 Hz, 1H), 7.43 (dd, J = 8.3, 2.0 Hz, 1H), 6.94 (d, J = 8.6 Hz, 1H), 3.80 (s, 3H).
4.1.51. Methyl 2-(4-((3,4-dichlorophenyl)thio)-3-nitrobenzoyl)-4-fluorobenzoate (7g)
Yellow solid (68 mg, 71%). 1H NMR (400 MHz, CDCl3) δ 8.52 (d, J = 1.8 Hz, 1H), 8.13 (dd, J = 8.7, 5.3 Hz, 1H), 7.79 (dd, J = 8.6, 1.9 Hz, 1H), 7.70 (d, J = 2.0 Hz, 1H), 7.59 (d, J = 8.2 Hz, 1H), 7.43 (dd, J = 8.3, 2.0 Hz, 1H), 7.32 – 7.27 (m, 1H), 7.04 (dd, J = 8.0, 2.5 Hz, 1H), 6.94 (d, J = 8.6 Hz, 1H), 3.73 (s, 3H).
4.1.52. Methyl 3-(4-((3,4-dichlorophenyl)thio)-3-nitrobenzoyl)benzoate (7h)
Yellow solid (65 mg, 70%). 1H NMR (400 MHz, CDCl3) δ 8.67 (d, J = 1.8 Hz, 1H), 8.38 (s, 1H), 8.30 (d, J = 7.8 Hz, 1H), 7.97 (d, J = 7.8 Hz, 1H), 7.84 (dd, J = 8.5, 1.8 Hz, 1H), 7.74 (d, J = 2.0 Hz, 1H), 7.66 – 7.58 (m, 2H), 7.47 (dd, J = 8.2, 2.0 Hz, 1H), 7.00 (d, J = 8.5 Hz, 1H), 3.95 (s, 3H).
4.1.53. General procedure for the synthesis of compounds 8a – h (Scheme 2)
The methyl ester of the title compound was hydrolyzed with 1 M NaOH in dioxane and H2O (v/v = 1 : 1) at 50 °C overnight. The mixture was then diluted with a small amount of water and washed twice with DCM. The aqueous solution was acidified by addition of 2 M HCl. The precipitate was collected by filtration and washed with water to afford the title compound. If the compound was not pure at this stage of the procedure, it was purified by silica gel column chromatography with DCM/MeOH (20 : 1) as the eluent.
4.1.54. 2-(4-((3,4-Dichlorophenyl)thio)-3-nitrobenzoyl)benzoic acid (8a)
Yellow solid, (58 mg, 62%); mp 246 – 248 °C; 1H NMR (400 MHz, DMSO-d6) δ 13.34 (s, 1H), 8.37 (s, 1H), 8.02 (d, J = 13.0 Hz, 2H), 7.84 (d, J = 8.3 Hz, 1H), 7.76 (dd, J = 14.9, 7.7 Hz, 2H), 7.72 – 7.67 (m, 1H), 7.64 (d, J = 8.0 Hz, 1H), 7.46 (d, J = 6.8 Hz, 1H), 7.07 (d, J = 8.4 Hz, 1H). 13C NMR (100 MHz, DMSO-d6) δ 194.4, 167.2, 144.8, 142.7, 140.7, 137.4, 136.1, 135.0, 134.4, 134.1, 133.3, 132.9, 130.8, 130.7, 130.5, 130.1, 129.5, 127.8, 125.8. HRMS (ESI): calcd for C20H10Cl2NO5S, [M-H]− 445.9662, found 445.9651. HPLC purity: 99.73%.
4.1.55. 4-Chloro-2-(4-((3,4-dichlorophenyl)thio)-3-nitrobenzoyl)benzoic acid (8b)
Yellow solid (27 mg, 55%); mp 229 – 231 °C; 1H NMR (400 MHz, DMSO-d6) δ 13.43 (s, 1H), 8.39 (d, J = 1.5 Hz, 1H), 8.05 – 7.92 (m, 2H), 7.84 (d, J = 8.3 Hz, 1H), 7.80 – 7.70 (m, 2H), 7.69 – 7.59 (m, 1H), 7.05 (d, J = 8.6 Hz, 1H). 13C NMR (100 MHz, DMSO-d6) δ 192.9, 166.4, 144.9, 142.8, 138.4, 137.4, 136.2, 134.7, 134.5, 134.2, 133.3, 132.9, 132.3, 130.70, 130.68, 129.5, 128.8, 127.6, 125.7, 120.2. HRMS (ESI): calcd for C20H9Cl3NO5S, [M-H]− 479.9272, found 479.9265. HPLC purity: 92.07%.
4.1.56. 5-Chloro-2-(4-((3,4-dichlorophenyl)thio)-3-nitrobenzoyl)benzoic acid (8c)
Yellow solid (26 mg, 58%); mp 246 – 248 °C; 1H NMR (400 MHz, DMSO-d6) δ 8.32 (d, J = 1.6 Hz, 1H), 7.99 (d, J = 1.6 Hz, 1H), 7.90 (d, J = 1.8 Hz, 1H), 7.82 (d, J = 8.3 Hz, 1H), 7.67 (d, J = 7.6 Hz, 2H), 7.63 (dd, J = 8.3, 1.9 Hz, 1H), 7.36 (d, J = 8.1 Hz, 1H), 7.01 (d, J = 8.5 Hz, 1H). 13C NMR (100 MHz, DMSO-d6) δ 192.8, 166.3, 144.8, 141.7, 139.3, 137.4, 136.1, 135.99, 135.97, 134.7, 134.3, 134.0, 133.3, 132.9, 131.2, 130.9, 129.6, 129.3, 129.0, 125.3. HRMS (ESI): calcd for C20H9Cl3NO5S, [M-H]− 479.9276, found 479.9272. HPLC purity: 96.70%.
4.1.57. 2-(4-((3,4-Dichlorophenyl)thio)-3-nitrobenzoyl)-4-methoxybenzoic acid (8d)
Yellow solid (19 mg, 40%); mp 218 – 220 °C; 1H NMR (400 MHz, DMSO-d6) δ 12.92 (s, 1H), 8.36 (s, 1H), 8.00 (d, J = 1.6 Hz, 1H), 7.96 (d, J = 8.7 Hz, 1H), 7.84 (d, J = 8.3 Hz, 1H), 7.72 (d, J = 8.5 Hz, 1H), 7.64 (dd, J = 8.3, 1.5 Hz, 1H), 7.18 (dd, J = 8.7, 2.2 Hz, 1H), 7.05 (d, J = 8.6 Hz, 1H), 6.97 (d, J = 2.1 Hz, 1H), 3.84 (s, 3H). 13C NMR (100 MHz, DMSO-d6) δ 194.0, 166.9, 163.0, 144.8, 143.5, 142.1, 137.4, 136.2, 135.4, 134.4, 134.0, 133.3, 132.9, 132.4, 130.8, 129.4, 125.5, 122.3, 115.7, 112.7, 56.3. HRMS (ESI): calcd for C21H12Cl2NO6S, [M-H]− 475.9768, found 475.9770. HPLC purity: 95.07%.
4.1.58. 2-(4-((3,4-Dichlorophenyl)thio)-3-nitrobenzoyl)-4-(trifluoromethyl)benzoic acid (8e)
Pale yellow solid (21 mg, 40%); mp 154 – 156 °C; 1H NMR (400 MHz, DMSO-d6) δ 8.35 (d, J = 1.5 Hz, 1H), 8.11 (d, J = 8.1 Hz, 1H), 7.98 (d, J = 1.9 Hz, 1H), 7.91 (d, J = 7.9 Hz, 1H), 7.82 (d, J = 8.3 Hz, 1H), 7.67 (s, 1H), 7.63 (ddd, J = 8.2, 4.4, 1.9 Hz, 2H), 7.01 (d, J = 8.6 Hz, 1H). 13C NMR (100 MHz, DMSO-d6) δ 192.8, 166.4, 144.8, 141.43, 141.36, 140.6, 137.4, 136.1, 134.3, 134.0, 133.3, 132.9, 131.1, 130.9, 130.8, 129.3, 126.7 (d, J = 3.3 Hz), 125.2, 124. 3 (q, J = 271 Hz), 123.8 (d, J = 3.4 Hz). HRMS (ESI): calcd for C21H9Cl2F3NO5S, [M-H]− 513.9536, found 513.9529. HPLC purity: 95.40%.
4.1.59. 2-(4-((3,4-Dichlorophenyl)thio)-3-nitrobenzoyl)-5-(trifluoromethyl)benzoic acid (8f)
Yellow solid (18 mg, 35%); mp 181 – 183 °C; 1H NMR (400 MHz, DMSO-d6) δ 8.37 (d, J = 0.9 Hz, 1H), 8.21 (s, 1H), 7.99 (d, J = 1.8 Hz, 2H), 7.83 (d, J = 8.2 Hz, 1H), 7.64 (t, J = 7.5 Hz, 2H), 7.58 (d, J = 7.8 Hz, 1H), 7.01 (d, J = 8.5 Hz, 1H). 13C NMR (100 MHz, DMSO-d6) δ 195.0, 165.9, 144.9, 144.5, 141.9, 137.4, 136.1, 135.5, 134.4, 134.1, 133.3, 132.9, 130.8, 129.4, 129.2, 128.4, 128.3, 127.8, 126.6 (d, J = 3.3 Hz), 125.6, 125.2, 124.2 (q, J = 270.9 Hz). HRMS (ESI): calcd for C21H9Cl2F3NO5S, [M-H]− 513.9516, found 513.9536. HPLC purity: 92.61%.
4.1.60. 2-(4-((3,4-Dichlorophenyl)thio)-3-nitrobenzoyl)-4-fluorobenzoic acid (8g)
Yellow solid (20 mg, 43%); mp 90 – 92 °C; 1H NMR (400 MHz, DMSO-d6) δ 13.29 (s, 1H), 8.37 (s, 1H), 8.06 (dd, J = 8.1, 5.6 Hz, 1H), 8.01 (s, 1H), 7.84 (d, J = 8.3 Hz, 1H), 7.72 (d, J = 8.3 Hz, 1H), 7.64 (d, J = 8.1 Hz, 1H), 7.49 (t, J = 7.5 Hz, 1H), 7.38 (d, J = 8.1 Hz, 1H), 7.04 (d, J = 8.5 Hz, 1H). 13C NMR (100 MHz, DMSO-d6) δ 166.4, 164.6 (d, J =250.5 Hz), 144.9, 142.3, 137.4, 136.2, 135.1, 134.4, 134.1, 133.3, 132.9, 132.0, 130.8, 129.4, 129.2, 127.8, 125.5, 117.4 (d, J = 22.8 Hz), 114.8 (d, J = 24.0 Hz). HRMS (ESI): calcd for C20H9Cl2FNO5S, [M-H]− 463.9568, found 463.9570. HPLC purity: 97.19%.
4.1.61. 3-(4-((3,4-Dichlorophenyl)thio)-3-nitrobenzoyl)benzoic acid (8h)
Yellow solid (23 mg, 52%); mp 207 – 209 °C; 1H NMR (400 MHz, DMSO-d6) δ 8.52 (d, J = 1.6 Hz, 1H), 8.25 (s, 1H), 8.22 (d, J = 7.6 Hz, 1H), 8.05 (d, J = 1.9 Hz, 1H), 7.92 (dd, J = 8.5, 1.7 Hz, 1H), 7.90 – 7.82 (m, 2H), 7.70 (dd, J = 8.3, 1.9 Hz, 1H), 7.62 (t, J = 7.6 Hz, 1H), 7.14 (d, J = 8.5 Hz, 1H). 13C NMR (100 MHz, DMSO-d6) δ 193.3, 167.8, 144.7, 142.3, 137.4, 136.3, 136.2, 135.0, 134.8, 134.4, 134.1, 133.3, 132.9, 132.4, 130.8, 130.6, 129.3, 129.1, 127.3. HRMS (ESI): calcd for C20H10Cl2NO5S, [M-H]− 445.9666, found 445.9662. HPLC purity: 96.06%.
4.1.62. (4-((3,4-Dichlorophenyl)thio)-3-nitrophenyl)(2-methoxyphenyl)methanone (8i)
Yellow solid (34 mg, 77%); mp 139 – 141 °C; 1H NMR (400 MHz, CDCl3) δ 8.59 (d, J = 1.8 Hz, 1H), 7.81 (dd, J = 8.5, 1.8 Hz, 1H), 7.72 (d, J = 2.0 Hz, 1H), 7.64 – 7.57 (m, 2H), 7.49 (d, J = 2.5 Hz, 1H), 7.44 (dd, J = 8.3, 2.0 Hz, 1H), 7.26 (s, 1H), 6.91 (dd, J = 14.3, 8.7 Hz, 2H), 3.71 (s, 3H). 13C NMR (100 MHz, CDCl3) δ 191.6, 156.3, 144.6, 143.8, 137.2, 135.6, 135.5, 134.9, 134.7, 134.5, 133.5, 132.4, 132.2, 130.1, 129.0, 127.9, 127.4, 113.45, 113.38, 55.9. HRMS (ESI): calcd for C20H12Cl2NO4S, [M-H]− 431.9870, found 431.9873. HPLC purity: 95.41%.
4.2. Biology
4.2.1. Determination of minimum inhibitory concentration (MIC)
Antimicrobial activity of each compound was determined by broth microdilution according to the Clinical & Laboratory Standards Institute (CLSI) guidelines [49]. The test medium was cation-adjusted Mueller-Hinton Broth (MHB) for Staphylococcus spp. and Brain Heart Infusion (BHI) for Streptococcus spp. During screening, serial two-fold dilutions of the compound were performed starting from 256 μg/mL down to 0.5 μg/mL, and the bacterial inoculum calibrated to approximately 5 × 10⁵ CFU/mL. Results were examined after incubation of 20 h at 37 °C, where the MIC was defined as the lowest concentration of antibiotic with no observable growth.
Three strains of Clostridium difficile were also used in this study, including the toxinotype 0 / ribotype 001 type strain C. difficile ATCC® 9689™ (positive for both TcdA and TcdB) and two clinical isolates ribotype 002 and ribotype 027. The test compound and control drugs vancomycin and fidaxomicin used in this work were first prepared as DMSO solutions and their MICs assessed anaerobically.
To remove dissolved oxygen, all media for C. difficile were incubated for 3 h in the anaerobic chamber prior to use. Colonies were first selected from overnight anaerobic culture on GAM agar before MIC assays were carried out in BHI supplemented with 0.5% w/v yeast extract and filter-sterilized 0.05% L-cysteine. C. difficile colonies in BHI were then allowed to grow anaerobically to early log phase before being diluted into a 0.5 McFarland suspension, which was further diluted by having 100 μL taken to inoculate 15 mL of BHI. 50 μL aliquots from this suspension were summarily used to inoculate wells pre-loaded with 50 μL BHI solutions containing serially diluted antimicrobial agents in 96-well plates. MIC plates were incubated at 37 °C and examined for growth at 48 h. Experiments were performed in triplicate.
4.2.2. Toxin secretion inhibition and CFU counting in C. difficile
C. difficile strains used in this section and their corresponding anaerobic culturing conditions were described above in Section 4.2.1. 120 μL of a 0.5 McFarland early log phase suspension of C. difficile was taken and further diluted into 18 mL of BHI. 300 μL aliquots from this C. difficile suspension were used to inoculate wells pre-loaded with 300 μL BHI solutions containing serially diluted antimicrobial agents in 48-well plates. Plates were then incubated anaerobically at 37 °C and samples were withdrawn at 48 h for total CFU counting on GAM agar using broth microdilution method. At 48 h, all cultures from wells ½, ¼, ⅛, 1/16 MICs, as well as the drug-free control, were harvested by centrifuging at 10,000 × g for 2 min and their supernatants retained for TcdA and TcdB toxin production by ELISA.
Quantification of TcdA and TcdB was performed with a commercial ELISA kit (Cat. No. TGC-E002–1, tgcBIOMICS GmbH, Germany) according to the manufacturer’s instructions. Samples within each strain were diluted by the same factor to the range recommended in the assay for better comparison across the ELISA results. All samples were tested in duplicate with technical and biological repeats.
4.2.3. Determination of inhibitory activity to β’CH-σ interaction
Inhibition assay was carried out following protein overproduction and purification based on previously established protocols [15]. 40 μL C-LgBiT-σA (0.125 μM in PBS) was added to 96-well plates loaded with 20 μL compound at desired concentrations. The mixture was incubated for 10 min at 37 °C, after which 40 μL C-SmBiT-CH (0.125 μM in PBS) was added to each well and a further 10 mins incubation period at 37 °C. Finally, 10 μL of 1:100 buffer-dissolved Promga NanoGlo® Luciferase Assay Substrate was added to the reaction mixture. Luminescence was measured using a Victor X3 Multilabel plate reader. The experiment was performed in triplicate with technical replicates.
4.2.4. Confocal fluorescence microscopy
B. subtilis strain BS1048 (RpoC-GFP) [14] was grown on LB agar plate. A single colony was incubated in LB medium supplemented at 37 °C until OD600 ~ 0.6. Compound at ¼ ½, 1, 2 MIC was then added to the culture and allowed to incubate for further 15 min. 2.5 μL of cell culture was placed onto 1.2% freshly made agarose plate and covered with a coverslip prior to imaging. Leica TCS SPE confocal microscope equipped with 63 × /1.3 oil objective and mercury metal halide bulb was used to capture the fluorescence images. The fluorescence images were processed with LAS X software.
4.2.5. Cell content quantification
The effects of varying concentrations of treatment compounds elicited on total levels of DNA, RNA and protein during cell growth was assessed by first preparing a master culture of S. aureus ATCC 29213. First inoculated at OD600 0.1 and agitated at 175 rpm at 37 °C, its confluence was doubled to 0.2 (early log phase) before being divided into aliquots where compounds and control drugs were added at their respective ¼ and ⅛ MICs, complete with a drug-free control culture. Cells were harvested upon the control reaching an OD600 of 0.6 (mid-log phase), where other samples were harvested at volumes adjusted to an OD600 equivalent of 0.6. 3 mL cultures were pelleted at 5000 × g for 5 min at 4 °C and the supernatant discarded. The major macromolecules were extracted and purified using the AllPrep® Bacterial DNA/RNA/Protein Kit (Qiagen) following the manufacturer’s protocols, and the nucleic acid levels quantified with Qubit™ DNA BR Assay Kit (Invitrogen) and Qubit™ RNA BR Assay Kit (Invitrogen) in conjunction with a Qubit 4 Fluorometer (Thermo Fisher). Pierce BCA Protein Assay Kit (Thermo Fisher) was used to measure protein levels. The experiment was performed in triplicate.
4.2.6. Cytotoxicity assay
Human cell lines A549 lung carcinoma and HepG2 hepatocellular carcinoma were used in this study, where they were seeded at 2.5 × 10⁵ cells per well and incubated for 24 hours at 37 °C. Test compounds were added in two-fold serial dilutions ranging from 50 μg/mL to 1.56 μg/mL. Plates were incubated for a further 24 h at 37 °C. MTT assay was performed at 48 h and 72 h post-addition of compounds as previously described [42]. 5-fluorouracil was used as the positive control and DMSO as the negative control.
4.2.7. Microsomal stability assay
Compound 8a at 10 and 50 μM were pre-incubated with 1 mg/ml rat liver microsome and 6 mM MgCl2 in 50 mM phosphate buffer (pH = 7.4) at 37 °C. The reaction was initiated by addition of 5 mM NADPH and terminated by adding 600 μl ice-cold methanol after 60 min of incubation. After centrifugation of resulted reaction mixture at 12,000 × g for 10 min, the supernatant was obtained for analysis of the remaining concentrations of 8a by LC/MS/MS method. The reaction system was validated using carbamazepine at 10 and 50 μM as positive controls as described [46] and the experiments were conducted in triplicates.
Supplementary Material
Highlights.
Structural optimization improved antibacterial activity to an MIC of 0.5 μg/mL
Compound 8e attenuated C. difficile virulence and toxin secretion
Studies showed the mechanism of disrupting bacterial transcription process
Compounds 5b, 5e and 8e inhibited the β’CH–σ interaction with IC50 0.26 to 2.1 μM
Drug-like properties were demonstrated by cytotoxicity and metabolic stability
Acknowledgments
We gratefully acknowledge the financial support from the Research Grants Council of the Hong Kong Special Administrative Region, China (PolyU 251000/17M, 151000/19M, C5008-19G, CUHK 141659/17M and 141079/19M), Hong Kong Polytechnic University internal grants (G-YBYY, 1-ZVPS and large equipment fund, the State Key Laboratory of Chemical Biology and Drug Discovery to C.M.), Hong Kong Food and Health Bureau HMRF (19180052 to X.Y.) and the Chinese University of Hong Kong (Faculty of Medicine Faculty Innovation Award FIA2018/A/03 to X.Y.). Studies in the I.A. laboratory were supported by the National Institutes of Health grant GM67153. All C. difficile strains were kindly provided by Professor Mamie Hui.
Abbreviations
- MRSA
methicillin-resistant Staphylococcus aureus
- PPI
protein-protein interaction
- MIC
minimum inhibition concentration
- SAR
structure-activity relationship
- CD
circular dichroism
- QSAR
quantitative structureeactivity relationship
- rRNA
ribosomal RNA
- MIC
minimum inhibition concentration
- DCM
dichloromethane
- THF
tetrahydrofuran
- DMSO
dimethyl sulfoxide
- AcOH
acetic acid
- EtOAc
ethyl acetate
Footnotes
Publisher's Disclaimer: This is a PDF file of an unedited manuscript that has been accepted for publication. As a service to our customers we are providing this early version of the manuscript. The manuscript will undergo copyediting, typesetting, and review of the resulting proof before it is published in its final form. Please note that during the production process errors may be discovered which could affect the content, and all legal disclaimers that apply to the journal pertain.
Appendix A. Supplementary data
Supplementary data to this article can be found online at https://doi.org/10.1016/j.ejmech.2020.112671
Declaration of interests
The authors declare that they have no known competing financial interests or personal relationships that could have appeared to influence the work reported in this paper.
References
- [1].O’Neill J, Antimicrobial Resistance: Tackling a Crisis for the Future Health and Wealth of Nations, Review on Antimicrobial Resistance, London, 2014. [Google Scholar]
- [2].Ma C, Yang X, Lewis PJ, Bacterial transcription as a target for antibacterial drug development, Microbiol. Mol. Biol. Rev 80 (2016) 139–160. [DOI] [PMC free article] [PubMed] [Google Scholar]
- [3].Ruff EF, Record MT Jr., Artsimovitch I, Initial events in bacterial transcription initiation, Biomolecules 5 (2015) 1035–1062. [DOI] [PMC free article] [PubMed] [Google Scholar]
- [4].Feklistov A, Sharon BD, Darst SA, Gross CA, Bacterial sigma factors: a historical, structural, and genomic perspective, Annu. Rev. Microbiol 68 (2014) 357–376. [DOI] [PubMed] [Google Scholar]
- [5].Borukhov S, Nudler E, RNA polymerase holoenzyme: structure, function and biological implications, Curr. Opin. Microbiol 6 (2003) 93–100. [DOI] [PubMed] [Google Scholar]
- [6].Gruber TM, Markov D, Sharp MM, Young BA, Lu CZ, Zhong HJ, Artsimovitch I, Geszvain KM, Arthur TM, Burgess RR, Landick R, Severinov K, Gross CA, Binding of the initiation factor σ70 to core RNA polymerase is a multistep process, Mol. Cell 8 (2001) 21–31. [DOI] [PubMed] [Google Scholar]
- [7].Burgess RR, Anthony L, How sigma docks to RNA polymerase and what sigma does, Curr. Opin. Microbiol 4 (2001) 126–131. [DOI] [PubMed] [Google Scholar]
- [8].Artsimovitch I, Post-initiation control by the initiation factor sigma, Mol. Microbiol 68 (2008) 1–3. [DOI] [PMC free article] [PubMed] [Google Scholar]
- [9].Murakami KS, Masuda S, Campbell EA, Muzzin O, Darst SA, Structural basis of transcription initiation: an RNA polymerase holoenzyme-DNA complex, Science 296 (2002) 1285–1290. [DOI] [PubMed] [Google Scholar]
- [10].Bae B, Feklistov A, Lass-Napiorkowska A, Landick R, Darst SA, Structure of a bacterial RNA polymerase holoenzyme open promoter complex, Elife 4 (2015) e08504. [DOI] [PMC free article] [PubMed] [Google Scholar]
- [11].Arthur TM, Burgess RR, Localization of a σ70 binding site on the N terminus of the Escherichia coli RNA polymerase β’ subunit, J. Biol. Chem 273 (1998) 31381–31387. [DOI] [PubMed] [Google Scholar]
- [12].Arthur TM, Anthony LC, Burgess RR, Mutational analysis of β’260–309, a σ70 binding site located on Escherichia coli core RNA polymerase, J. Biol. Chem 275 (2000) 23113–23119. [DOI] [PubMed] [Google Scholar]
- [13].Ma C, Yang X, Kandemir H, Mielczarek M, Johnston EB, Griffith R, Kumar N, Lewis PJ, Inhibitors of bacterial transcription initiation complex formation, ACS Chem. Biol 8 (2013) 1972–1980. [DOI] [PubMed] [Google Scholar]
- [14].Yang X, Ma C, Lewis PJ, Identification of inhibitors of bacterial RNA polymerase, Methods 86 (2015) 45–50. [DOI] [PubMed] [Google Scholar]
- [15].Ma C, Yang X, Lewis PJ, Bacterial transcription inhibitor of RNA polymerase holoenzyme formation by structure-based drug design: From in silico screening to validation, ACS Infect. Dis 2 (2016) 39–46. [DOI] [PubMed] [Google Scholar]
- [16].Andre E, Bastide L, Villain-Guillot P, Latouche J, Rouby J, Leonetti JP, A multiwell assay to isolate compounds inhibiting the assembly of the prokaryotic RNA polymerase, Assay Drug Dev. Technol 2 (2004) 629–635. [DOI] [PubMed] [Google Scholar]
- [17].Hinsberger S, Husecken K, Groh M, Negri M, Haupenthal J, Hartmann RW, Discovery of novel bacterial RNA polymerase inhibitors: pharmacophore-based virtual screening and hit optimization, J. Med. Chem 56 (2013) 8332–8338. [DOI] [PubMed] [Google Scholar]
- [18].Bae B, Davis E, Brown D, Campbell EA, Wigneshweraraj S, Darst SA, Phage T7 Gp2 inhibition of Escherichia coli RNA polymerase involves misappropriation of σ70 domain 1.1, Proc. Natl. Acad. Sci. U. S. A 110 (2013) 19772–19777. [DOI] [PMC free article] [PubMed] [Google Scholar]
- [19].Tsang TF, Qiu Y, Lin L, Ye J, Ma C, Yang X, Simple method for studying in vitro protein-protein interactions based on protein complementation and its application in drug screening targeting bacterial transcription, ACS Infect. Dis 5 (2019) 521–527. [DOI] [PubMed] [Google Scholar]
- [20].Ye J, Chu AJ, Lin L, Yang X, Ma C, First-in-class inhibitors targeting the interaction between bacterial RNA polymerase and sigma initiation factor affect the viability and toxin release of Streptococcus pneumoniae, Molecules 24 (2019) 2902. [DOI] [PMC free article] [PubMed] [Google Scholar]
- [21].Yang Y, Yu Y, Li X, Li J, Wu Y, Yu J, Ge J, Huang Z, Jiang L, Rao Y, Yang M, Target elucidation by cocrystal structures of NADH-ubiquinone oxidoreductase of Plasmodium falciparum (PfNDH2) with small molecule to eliminate drug-resistant malaria, J. Med. Chem 60 (2017) 1994–2005. [DOI] [PubMed] [Google Scholar]
- [22].He C, Zhang X, Huang R, Pan J, Li J, Ling X, Xiong Y, Zhu X, Synthesis of structurally diverse diarylketones through the diarylmethyl sp3 CH oxidation, Tetrahedron Lett. 55 (2014) 4458–4462. [Google Scholar]
- [23].WHO, Global priority list of antibiotic-resistant bacteria to guide research, discovery, and development of new antibiotics. https://www.who.int/medicines/publications/WHO-PPL-Short_Summary_25Feb-ET_NM_WHO.pdf, 2020. (accessed 24 June 2020)
- [24].Watanabe S, Takemoto N, Ogura K, Miyoshi-Akiyama T, Severe invasive streptococcal infection by Streptococcus pyogenes and Streptococcus dysgalactiae subsp. equisimilis, Microbiol. Immunol 60 (2016) 1–9. [DOI] [PubMed] [Google Scholar]
- [25].Raabe VN, Shane AL, Group B Streptococcus (Streptococcus agalactiae), Microbiol. Spectr 7 (2019) 10.1128/microbiolspec.GPP3-0007-2018. [DOI] [PMC free article] [PubMed] [Google Scholar]
- [26].Cammarota G, Gallo A, Ianiro G, Montalto M, Emerging drugs for the treatment of Clostridium difficile, Expert Opin. Emerg. Drugs 24 (2019) 17–28. [DOI] [PubMed] [Google Scholar]
- [27].Czepiel J, Drozdz M, Pituch H, Kuijper EJ, Perucki W, Mielimonka A, Goldman S, Wultanska D, Garlicki A, Biesiada G, Clostridium difficile infection: review, Eur. J. Clin. Microbiol. Infect. Dis 38 (2019) 1211–1221. [DOI] [PMC free article] [PubMed] [Google Scholar]
- [28].Freeman J, Bauer MP, Baines SD, Corver J, Fawley WN, Goorhuis B, Kuijper EJ, Wilcox MH, The changing epidemiology of Clostridium difficile infections, Clin. Microbiol. Rev 23 (2010) 529–549. [DOI] [PMC free article] [PubMed] [Google Scholar]
- [29].Couturier J, Davies K, Gateau C, Barbut F, Ribotypes and new virulent strains across Europe, Adv. Exp. Med. Biol 1050 (2018) 45–58. [DOI] [PubMed] [Google Scholar]
- [30].Wong SH, Ip M, Hawkey PM, Lo N, Hardy K, Manzoor S, Hui WW, Choi KW, Wong RY, Yung IM, Cheung CS, Lam KL, Kwong T, Wu WK, Ng SC, Wu JC, Sung JJ, Lee N, High morbidity and mortality of Clostridium difficile infection and its associations with ribotype 002 in Hong Kong, J. Infect 73 (2016) 115–122. [DOI] [PubMed] [Google Scholar]
- [31].Collins DA, Sohn KM, Wu Y, Ouchi K, Ishii Y, Elliott B, Riley TV, Tateda K, G. Clostridioides difficile infection in the Asia-Pacific region, Emerg. Microbes Infect 9 (2020) 42–52. [DOI] [PMC free article] [PubMed] [Google Scholar]
- [32].Shah D, Dang MD, Hasbun R, Koo HL, Jiang ZD, DuPont HL, Garey KW, Clostridium difficile infection: update on emerging antibiotic treatment options and antibiotic resistance, Expert Rev. Anti-Infect. Ther 8 (2010) 555–564. [DOI] [PMC free article] [PubMed] [Google Scholar]
- [33].Artsimovitch I, Seddon J, Sears P, Fidaxomicin is an inhibitor of the initiation of bacterial RNA synthesis, Clin. Infect. Dis 55 Suppl 2 (2012) S127–131. [DOI] [PMC free article] [PubMed] [Google Scholar]
- [34].Merrigan M, Venugopal A, Mallozzi M, Roxas B, Viswanathan VK, Johnson S, Gerding DN, Vedantam G, Human hypervirulent Clostridium difficile strains exhibit increased sporulation as well as robust toxin production, J. Bacteriol 192 (2010) 4904–4911. [DOI] [PMC free article] [PubMed] [Google Scholar]
- [35].Warny M, Pepin J, Fang A, Killgore G, Thompson A, Brazier J, Frost E, McDonald LC, Toxin production by an emerging strain of Clostridium difficile associated with outbreaks of severe disease in North America and Europe, Lancet 366 (2005) 1079–1084. [DOI] [PubMed] [Google Scholar]
- [36].Vedantam G, Clark A, Chu M, McQuade R, Mallozzi M, Viswanathan VK, Clostridium difficile infection: toxins and non-toxin virulence factors, and their contributions to disease establishment and host response, Gut Microbes 3 (2012) 121–134. [DOI] [PMC free article] [PubMed] [Google Scholar]
- [37].Aldape MJ, Heeney DD, Bryant AE, Stevens DL, Tigecycline suppresses toxin A and B production and sporulation in Clostridium difficile, J. Antimicrob. Chemother 70 (2015) 153–159. [DOI] [PMC free article] [PubMed] [Google Scholar]
- [38].Babakhani F, Bouillaut L, Sears P, Sims C, Gomez A, Sonenshein AL, Fidaxomicin inhibits toxin production in Clostridium difficile, J. Antimicrob. Chemother 68 (2013) 515–522. [DOI] [PubMed] [Google Scholar]
- [39].Gerber M, Walch C, Loffler B, Tischendorf K, Reischl U, Ackermann G, Effect of sub-MIC concentrations of metronidazole, vancomycin, clindamycin and linezolid on toxin gene transcription and production in Clostridium difficile, J. Med. Microbiol 57 (2008) 776–783. [DOI] [PubMed] [Google Scholar]
- [40].Drummond LJ, Smith DGE, Poxton IR, Effects of sub-MIC concentrations of antibiotics on growth of and toxin production by Clostridium difficile, J. Med. Microbiol 52 (2003) 1033–1038. [DOI] [PubMed] [Google Scholar]
- [41].Yang H, Xu S, Huang K, Xu X, Hu F, He C, Shu W, Wang Z, Gong F, Zhang C, Liu Q, Anti-staphylococcus antibiotics interfere with the transcription of leucocidin ED gene in Staphylococcus aureus strain Newman, Front. Microbiol 11 (2020) 265. [DOI] [PMC free article] [PubMed] [Google Scholar]
- [42].Lewis PJ, Thaker SD, Errington J, Compartmentalization of transcription and translation in Bacillus subtilis, EMBO J. 19 (2000) 710–718. [DOI] [PMC free article] [PubMed] [Google Scholar]
- [43].Yang X, Luo MJ, Yeung ACM, Lewis PJ, Chan PKS, Ip M, Ma C, First-in-class inhibitor of ribosomal RNA synthesis with antimicrobial activity against Staphylococcus aureus, Biochemistry 56 (2017) 5049–5052. [DOI] [PubMed] [Google Scholar]
- [44].Artsimovitch I, Vassylyeva MN, Svetlov D, Svetlov V, Perederina A, Igarashi N, Matsugaki N, Wakatsuki S, Tahirov TH, Vassylyev DG, Allosteric modulation of the RNA polymerase catalytic reaction is an essential component of transcription control by rifamycins, Cell 122 (2005) 351–363. [DOI] [PubMed] [Google Scholar]
- [45].Saxena S, Myka KK, Washburn R, Costantino N, Court DL, Gottesman ME, Escherichia coli transcription factor NusG binds to 70S ribosomes, Mol. Microbiol 108 (2018) 495–504. [DOI] [PMC free article] [PubMed] [Google Scholar]
- [46].Ren T, Yang M, Xiao M, Zhu J, Xie W, Zuo Z, Time-dependent inhibition of carbamazepine metabolism by piperine in anti-epileptic treatment, Life Sci. 218 (2019) 314–323. [DOI] [PubMed] [Google Scholar]
- [47].Ye J, Chu AJ, Harper R, Chan ST, Shek TL, Zhang Y, Ip M, Sambir M, Artsimovitch I, Zuo Z, Yang X, Ma C, Discovery of antibacterials that inhibit bacterial RNA polymerase interactions with sigma factors, J. Med. Chem doi: 10.1021/acs.jmedchem.0c00520 [DOI] [PMC free article] [PubMed] [Google Scholar]
- [48].Leffler DA, Lamont JT, Treatment of Clostridium difficile-associated disease, Gastroenterology 136 (2009) 1899–1912. [DOI] [PubMed] [Google Scholar]
- [49].Clinical & Laboratory Standards Institute, Methods for Dilution Antimicrobial Susceptibility Tests for Bacteria That Grow Aerobically, 11th Edition (M07Ed11) ed., Clinical & Laboratory Standards Institute, Wayne, PA, 2018. [Google Scholar]
Associated Data
This section collects any data citations, data availability statements, or supplementary materials included in this article.