

Abstract
Objectives:
To estimate the prevalence of hypertension and its risk factors among adults in four slum communities in Port-au-Prince.
Methods:
Cluster area random sampling was used to select adults for a health and demographic survey, including anthropometric measurements. Hypertension was defined as systolic blood pressure ≥140 and/or diastolic blood pressure ≥90 mmHg, or current hypertension treatment, and was age-standardized to WHO world population. Correlates of hypertension were tested using sex-stratified logistic regression.
Results:
Overall, 20.3% of adults had hypertension (28.5% age-standardized), including 22.3% of men and 18.9% of women. Three percent of participants reported current hypertension treatment, and 49.5% of them had their hypertension controlled. Overweight/obesity (BMI≥25) was the most common risk factor (20.6% among men, 48.5% among women), while smoking was less common (11.8% and 3.9%, respectively). Increasing age and hypertension prevalence in immediate surroundings were associated with greater odds of hypertension. Among men, having in-migrated in the 3 years prior (versus ≥3 years) was also associated with hypertension (adjusted odds ratio [aOR]=3.32, 95% confidence interval [CI]:1.79-6.17); as was overweight and obesity (aOR=1.90, 95% CI:1.09-3.33, and aOR=5.73, 95% CI:2.49-13.19, respectively) and non-receipt of needed medical care in the preceding six months (aOR=2.82, 95% CI:1.35-5.88) among women.
Conclusions:
Hypertension prevalence was high across the age spectrum, in addition to substantial levels of overweight/obesity and unmet healthcare needs. It is important to better understand the possible effects of intraurban migration and environmental risk factors on hypertension, and ensure that benefits of increasingly cost-effective prevention and treatment programs extend to slum residents.
Keywords: Hypertension, non-communicable disease, NCD risk factors, Haiti, slum
Introduction
Non-communicable diseases (NCDs) such as cardiovascular disease (CVD) are the leading cause of death and disability, and on the rise in low- and middle-income countries (LMICs), where three quarters of all NCD deaths occur [1]. The World Health Organization (WHO) targets a 25% global reduction in CVD mortality, as well as hypertension, by 2025 [1]. However, achievement of these goals may be hampered by a scarcity of data on the burden of NCDs and their risk factors such as hypertension in many LMICs.
Rapidly growing urban slums, with worldwide populations estimated to reach 2 billion by 2030 [2], are an important setting with respect to the increasing CVD burden, with residents vulnerable to poor health outcomes because of a confluence of poverty, inadequate healthcare access, and environmental and social disadvantage. With their unique social and physical environment, and possible associated neighborhood effects on health, slum settings merit concerted research efforts into their health status and needs [3].
CVD is increasingly common in Haiti, the poorest country in the Western Hemisphere, where 74% of the urban population live in slums [4]. Adult hypertension prevalence in Port-au-Prince has been reported as high as 47% [5] and hypertensive heart disease is one of the fastest growing causes of death nationally [6]. Haiti has one of the highest stroke mortality rates in the Latin America/Caribbean region, and more than twice that of the neighboring Dominican Republic [7]. Congestive heart failure is common in young women in Haiti (largely due to peripartum cardiomyopathy [8, 9]). No slum-specific estimates of hypertension prevalence are available from Haiti, but research from slums in other countries has reported a wide range of estimates (12% to 52% [10–19]), often low awareness of having hypertension (5% to 65% [11–18]), and poor hypertension control (4% to 29% [11–13, 18]), though most available data were limited by convenience sampling.
This paper characterizes for the first time hypertension and its risk factors in a representative sample of adult residents of four Port-au-Prince slum communities.
Methods
Setting
GHESKIO (Haitian Group for the Study of Kaposi’s Sarcoma and Opportunistic Infections) is a non-governmental organization and the largest provider of HIV and tuberculosis services in Haiti [20], and neighbors large slum communities in Port-au-Prince. From July to October 2016, GHESKIO collaborated with Cornell University, City University of New York, and University of Minnesota, on a survey in four of these neighborhoods: Village (Cité) de Dieu, Cité Plus, Cité l’Eternel, and Martissant Littoral, with an estimated population of 61,000-100,000 [21]. Most residents live in extreme poverty, in crowded conditions with limited access to education, sanitation, and medical care [21, 22]. No systematic demographic studies or general health surveys had been previously conducted in these communities.
Study design
Design of this cross-sectional survey is described in detail in the Supplemental Digital Content 1. Using cluster area random sampling and high-resolution aerial images from the DigitalGlobe Foundation [23], we randomly selected 111 geospatial waypoints across the four adjacent neighborhoods based on the estimated population density of each neighborhood. At each waypoint, fieldworkers surveyed five nearest households, and two adults were randomly selected from each household’s resident roster for an additional survey.
Households were defined as a person or persons, related or unrelated, who live together in a residential structure, make common provisions for food, and regularly take their food from the same pot [24]. Eligible household members had to be ≥18 years old and have slept in the household at least once in the past two nights.
Up to three attempts were made to interview households and individuals, and verbal consent was obtained from participants after study goals, content, risks, and voluntary nature were discussed. Due to literacy gaps in the study population, written consent was waived, and the consent form was read out loud to participants by fieldworkers.
Data collection
Household surveys were paper-based and included questions on household composition, living conditions, and mortality. Individual surveys were administered on an encrypted Android tablet and included sociodemographics, migration history, disease symptoms and diagnoses, healthcare utilization, and select NCD risk factors. All surveys were in Haitian Creole, after translation from and back-translation into English. Anthropometrics (height and weight without shoes, waist circumference) and blood pressure were also recorded. Blood pressure was measured three times on the left arm using a Panasonic model EW3109W monitor, with three cuff sizes based on upper arm circumference, after participant was seated for a minimum of 15 minutes [25]. We used the mean of the last two readings as the final blood pressure measurement.
Participants with any systolic blood pressure (SBP)≥140 mmHg and/or diastolic blood pressure (DBP)≥90 mmHg received basic information about hypertension and were referred to GHESKIO for free re-screening and medical care. Participants with any SBP≥180 mmHg were escorted to GHESKIO on the same day.
Data from paper forms were double-entered and reconciled using RedCap (Research Electronic Data Capture) [26]. Tablet data were stored in a secure database at GHESKIO. Data were regularly reviewed for completeness and consistency against paper logs of survey attempts. All data were de-identified for cleaning and analysis.
Hypertension definition
Hypertension was defined as mean SBP≥140 mmHg or mean DBP≥90 mmHg, or a self-report of taking anti-hypertensive drugs prescribed by a medical professional, per JNC-VII [27]. Stage 2 hypertension was defined as mean SBP≥160 mmHg and/or mean DBP≥100 mmHg. Among remaining subjects, stage 1 hypertension was defined as mean SBP 140-159 mmHg or mean DBP 90-100 mmHg. Then prehypertension was defined as mean SBP 120-139 mmHg or mean DBP 80-89 mmHg [27]. For sensitivity analysis, hypertension prevalence was also calculated using the new 2017 American College of Cardiology (ACC) guidance (elevated BP: SBP 120-129 and DBP <80 mmHg; hypertension stage 1: SBP 130-139 mmHg or 80-89 mmHg, and hypertension stage 2: SBP ≥140 mmHg or DBP ≥90 mmHg) [28].
Risk factor definitions
Body mass index (BMI) was categorized as underweight (<18.5kg/m2), normal (18.5-<25kg/m2), overweight (25-<30kg/m2), and obese (≥30kg/m2) [29]. Waist circumference >94cm and >80cm (for men and women, respectively), corresponding to WHO classification of increased metabolic risk, was classified as central obesity [30].
Psychological distress was assessed for the preceding 30-day period using the Kessler-6 instrument [31]. Smoking status was self-reported as smoking on some or all days. Frequency of alcohol use was self-reported as never, monthly or less, 2–4 times a month, 2–3 times a week, or 4 or more times a week. For analysis, the variable was dichotomized into at least twice a week versus less. To assess diet, respondents were asked how many days in a typical week they eat 1) fresh fruit, and 2) vegetables. For analysis, the mean of both numbers was used.
To reflect unmet healthcare needs, participants were asked whether they needed, but did not get healthcare at any point in the preceding six months. To represent possible shared genetic and/or environmental risk factors, hypertension prevalence in each participant’s immediate surroundings was calculated as proportion of participants with hypertension in the same waypoint, excluding the participant.
Statistical Analysis
Descriptive statistics were used to characterize study participants and the prevalence of hypertension and its risk factors. Reported p-values are for Rao-Scott chi-square tests for complex survey samples.
Sex-stratified logistic regression was used to assess correlates of hypertension, including sociodemographics and possible risk factors. All variables with bivariate p-values <0.20 were included in initial multivariable models, and eliminated by backward selection until all remaining variables had p-values <0.05. Dropped variables were then individually added back to further assess possible confounding. Both models were adjusted for slum neighborhood. All analyses were weighted for complex survey design and nonresponse. Population-attributable fractions for overweight and obesity were calculated using adjusted odds ratios (aOR) from the final models.
Hypertension prevalence was age-standardized to the world population using the 2000–2025 WHO standard population data [32].
Ethics
This study was approved by institutional review boards at Weill Cornell Medicine, City University of New York, University of Minnesota, and the Ethics Board at GHESKIO.
Results
Fieldworkers obtained community cooperation and accessed 109 of 111 waypoints, resulting in random selection of 545 households, of which 525 (96.3%) completed the household survey. Of 993 randomly selected adults in these households, 894 (90.0%) completed the individual survey and 99.1% of them (886/894) had their blood pressure measured.
Sociodemographics and health status
More than half of adults were 30 years old or younger, with a median age of 28 years (IQR: 22–39). Over a third (36.0%) had no more than primary education, 40.1% had no income, and 40.0% moved to the current slum in the past three years. Most residents who migrated to the current community had previously resided in another slum in Port-au-Prince (36.3%) or elsewhere in Metropolitan Port-au-Prince (26.6%). The main reasons for migrating included desire to join relatives or friends, work, and education. In the past year, 21.7% of adults spent over a month at a time away from the community. (Table 1)
Table 1.
Characteristics of study participants, by sex (N=894).
| Overall N (weighted %) | Men N (weighted %) | Women N (weighted %) | p-value men vs women | |
|---|---|---|---|---|
| Total N (weighted %) | 894 (100%) | 350 (41.6%) | 544 (58.4%) | |
| Sociodemographics | ||||
| Neighborhood | ||||
| Village de Dieu | 271 (27.7%) | 106 (30.6%) | 165 (25.7%) | <0.001 |
| Cite Plus | 165 (13.2%) | 66 (16.8%) | 99 (10.6%) | |
| Martissant Littoral | 254 (24.3%) | 103 (24.6%) | 151 (24.1%) | |
| Cite Eternel | 204 (34.8%) | 75 (28%) | 129 (39.7%) | |
| Age | ||||
| Median (IQR) | 28 (22-39) | 30 (23-41) | 27 (22-39) | |
| 18-24 | 263 (34%) | 96 (28.6%) | 167 (37.8%) | 0.013 |
| 25-30 | 212 (23%) | 79 (23.5%) | 133 (22.6%) | |
| 31-44 | 263 (23.5%) | 112 (26.6%) | 151 (21.4%) | |
| ≥45 | 156 (19.5%) | 63 (21.3%) | 93 (18.2%) | |
| Highest education level attended | ||||
| No formal education | 68 (7.3%) | 11 (3.8%) | 57 (9.8%) | 0.036 |
| Primary | 286 (28.7%) | 99 (28.7%) | 187 (28.8%) | |
| Secondary | 461 (54.1%) | 200 (56.2%) | 261 (52.6%) | |
| Higher | 78 (9.9%) | 39 (11.3%) | 39 (8.8%) | |
| Marital status | ||||
| Married / cohabitating | 427 (45.4%) | 168 (49.2%) | 259 (42.8%) | 0.001 |
| Single | 370 (45.2%) | 161 (45.6%) | 209 (44.9%) | |
| Widowed / divorced / separated | 97 (9.4%) | 21 (5.2%) | 76 (12.3%) | |
| Income per day | ||||
| None | 308 (40.1%) | 91 (26.0%) | 217 (50.1%) | <0.001 |
| Up to 100 goudes | 178 (17.7%) | 53 (16.0%) | 125 (18.9%) | |
| More than 100 goudes | 385 (42.2%) | 192 (58.0%) | 193 (31.0%) | |
| Time in current neighborhood | ||||
| Less than a year | 137 (14.7%) | 44 (10.3%) | 93 (17.7%) | 0.001 |
| 1-3 years | 244 (25.3%) | 95 (23.9%) | 149 (26.3%) | |
| >3 years but not whole life | 230 (28.2%) | 83 (27.4%) | 147 (28.7%) | |
| Whole life | 282 (31.8%) | 127 (38.4%) | 155 (27.2%) | |
| [Among ever migrants] Previous residence | ||||
| Another slum in Port-au-Prince | 253 (36.3%) | 86 (33.9%) | 167 (37.8%) | 0.066 |
| Elsewhere in Metropolitan Port-au-Prince | 152 (26.6%) | 54 (24.2%) | 98 (28.0%) | |
| Elsewhere in Haiti or abroad | 205 (37.1%) | 81 (41.9%) | 124 (34.2%) | |
| Away from current home for >1 month at a time in past year | 187 (21.7%) | 67 (23.1%) | 120 (20.7%) | 0.367 |
| Cardiovascular disease risk factors | ||||
| BMI | ||||
| Underweight (<18.5) | 78 (9.3%) | 34 (10.2%) | 44 (8.7%) | <0.001 |
| Normal (18.5-<25) | 462 (53.8%) | 230 (69.2%) | 232 (42.9%) | |
| Overweight (25-<30) | 232 (26.6%) | 62 (17.0%) | 170 (33.4%) | |
| Obese (>=30) | 100 (10.3%) | 11 (3.6%) | 89 (15.1%) | |
| Central obesity | 325 (35.8%) | 21 (7.9%) | 304 (55.4%) | <0.001 |
| Currently smokes cigarettes | 68 (7.2%) | 47 (11.8%) | 21 (3.9%) | <0.001 |
| Consumes alcohol at least twice per week | 148 (17.7%) | 109 (32.1%) | 39 (7.4%) | <0.001 |
| Number of days/week drinks soda/sugary drinks (median, IQR) | 2.1 (0.5-6.1) | 2.4 (1.1-6.1) | 1.9 (0.1-6.1) | |
| Mean number of days/week eats fresh fruit/vegetables (median, IQR) | 1.6 (0.7-2.8) | 1.6 (0.9-2.6) | 1.6 (0.6-3.0) | |
| Eats at least one fried meal per day | 606 (68.7%) | 247 (69.1%) | 359 (68.4%) | 0.854 |
| Always or often adds salt or salty seasoning to foods | 262 (33.2%) | 95 (28.8%) | 167 (36.3%) | 0.004 |
| Lives in a household with indoor cooking over charcoal, wood, or fire | 517 (65.7%) | 196 (61.3%) | 321 (68.8%) | <0.001 |
| Psychological distress score (median, IQR) | 9.9 (6.7-12.0) | 9.2 (5.7-11.7) | 10.6 (7.3-12.3) | |
| Health status and healthcare access | ||||
| Health problem keeps from working | 198 (20.2%) | 59 (17.4%) | 139 (22.3%) | 0.108 |
| Sought medical care in past year | 304 (35.6%) | 93 (26.8%) | 211 (41.8%) | <0.001 |
| Did not receive needed care in past 6 months | 235 (26.3%) | 90 (25%) | 145 (27.2%) | 0.552 |
| Household environment | ||||
| Number of HH members (median, IQR) | 4.4 (2.9-6.0) | |||
| A HH member owns dwelling | 421 (46.8%) | |||
A fifth of adults (20.2%) reported having a health problem that keeps them from working and a quarter (26.3%) did not receive needed healthcare in the six months prior. Approximately a third (35.6%; 26.8% of men and 41.8% of women, p<0.001) had seen a medical practitioner in the year prior. (Table 1)
Blood pressure levels and hypertension prevalence
Overall, 20.3% of adults (22.3% of men and 18.9% of women, p=0.425) had hypertension per JNC-VII definition. Age-standardized prevalence was 28.5%. Restricted to blood pressure measures, 12.6% of adults had hypertension stage 1 and 6.2% - stage 2. An additional 27.5% had pre-hypertension. (Table 2) Applying the 2017 ACC definitions, 36.8% of adults had hypertension (17.0% - stage 1 and 18.8% - stage 2) and 10.5% had elevated blood pressure.
Table 2.
Hypertension prevalence by sex, age, and healthcare access (N=886).
| Crude N | Overall N with hypertension (%) | Men N with hypertension (%) | Women N with hypertension (%) | p-value men vs women | |
|---|---|---|---|---|---|
| Overall (includes self-reported treatment from a clinic) | 886 | 179 (20.3%) | 66 (22.3%) | 113 (18.9%) | 0.425 |
| Level 1 (includes only measured blood pressure) | 108 (12.6%) | 44 (15.4%) | 64 (10.7%) | 0.333 | |
| Level 2 (includes only measured blood pressure) | 53 (6.2%) | 19 (6.2%) | 34 (6.1%) | ||
| Pre-hypertension (includes only measured blood pressure) | 278 (27.5%) | 115 (29.0%) | 163 (26.4%) | ||
| Among those with measured hypertension, type | 161 | ||||
| Both systolic and diastolic | 69 (48.8%) | 23 (45.2%) | 46 (52.0%) | 0.667 | |
| Systolic only | 37 (20.5%) | 16 (21.6%) | 21 (19.5%) | ||
| Diastolic only | 55 (30.7%) | 24 (33.1%) | 31 (28.5%) | ||
| Overall, age standardized to WHO world population | 28.5% | 29.6% | 28.0% | ||
| Age | |||||
| 18-24 | 258 | 21 (7.1%) | 9 (13.5%) | 12 (3.7%) | 0.013 |
| 25-30 | 212 | 35 (16.8%) | 13 (16.4%) | 22 (17.1%) | 0.908 |
| 31-44 | 261 | 61 (23.9%) | 21 (16.9%) | 40 (30.1%) | 0.089 |
| ≥45 | 155 | 62 (43.6%) | 23 (48.8%) | 39 (39.6%) | 0.262 |
| Healthcare access | |||||
| Sought medical care in past year | |||||
| Yes | 300 | 72 (22.3%) | 21 (26.6%) | 51 (20.5%) | 0.400 |
| No | 585 | 107 (19.2%) | 45 (20.8%) | 62 (17.9%) | 0.458 |
| Did not receive needed care in past six months | |||||
| Yes | 232 | 62 (28.9%) | 19 (26.4%) | 43 (30.4%) | 0.565 |
| No | 654 | 117 (17.3%) | 47 (21.0%) | 70 (14.6%) | 0.094 |
Mean SBP and DBP increased with age, reaching 133/85 mmHg and 132/83 mmHg among men and women, respectively, at age 45 and above. (Figure 1) Similarly, prevalence of hypertension increased with age, with 7.1% of adults ages 18-24 having hypertension (13.5% of men and 3.7% of women, p=0.013) and 43.6% of adults aged ≥45 years (48.8% of men and 39.6% of women, p=0.125). Prevalence of hypertension was higher among men than women, despite markedly lower obesity levels among men across the age spectrum. (Table 2, Figure 2)
Figure 1.
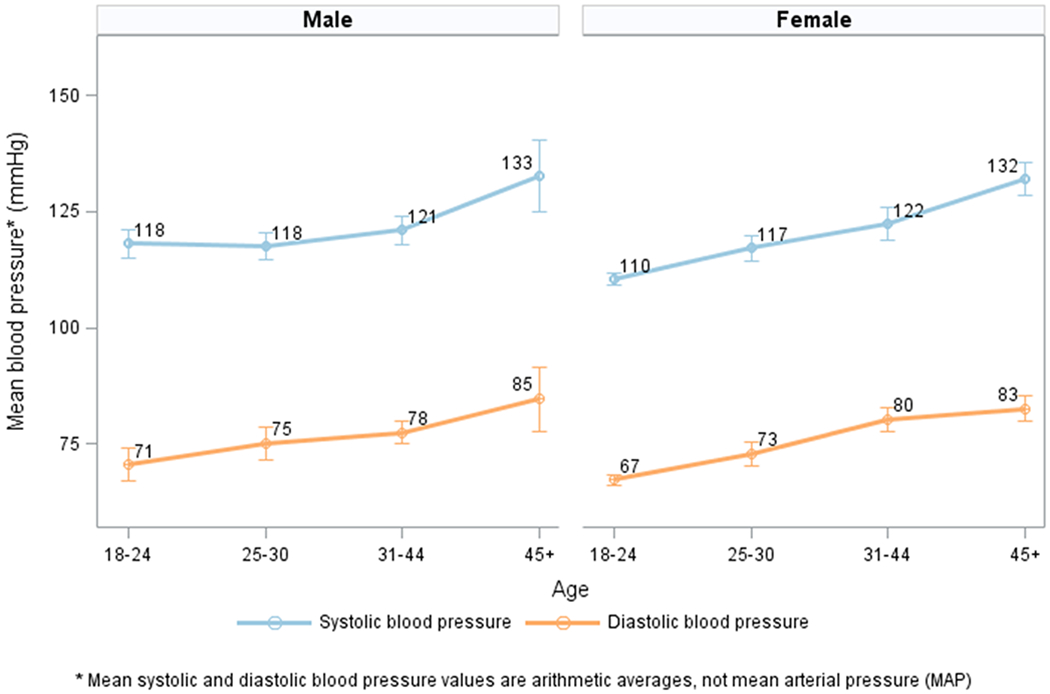
Mean systolic and diastolic blood pressure* and 95% confidence interval, by age and sex.
Figure 2.
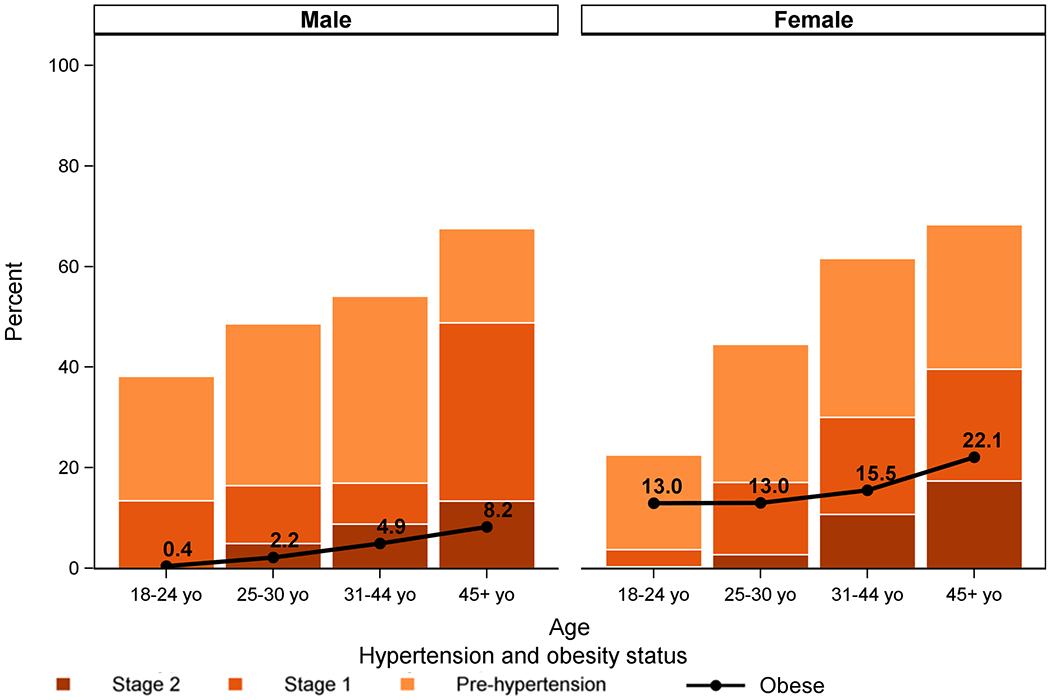
Prevalence of hypertension stage 1 and 2, and pre-hypertension (per JNC-VII definitions) by age and sex, and proportion obese by group.
Prevalence of hypertension risk factors
Overall, 36.9% of adults were overweight or obese (20.6% of men and 48.5% of women; p<0.001). Many individuals ate at least one fried meal per day (68.7%) and always or often added salt to foods (33.2%). Fresh fruit/vegetables were consumed on a median of 1.6 days per week (IQR: 0.7-2.8) and soda or sugary drinks – on a median of 2.1 days (IQR: 0.5-6.1). Only 7.2% of adults were smokers (11.8% of men and 3.9% of women, p<0.001) and 17.7% drank alcohol at least twice a week (32.1% of men and 7.4% of women, p<0.001). Almost two thirds of adults (65.7%) lived in households which cook indoors over charcoal, wood, or fire.
Hypertension awareness and care continuum
Most adults (62.0%) had had blood pressure measured previously. Among persons with hypertension per actual blood pressure measures (excluding self-reported treatment), 36% of men and 44% of women had previously been diagnosed, and 4% of men and 12% of women reported taking anti-hypertensive treatment prescribed by a clinician. (Figure 3)
Figure 3.
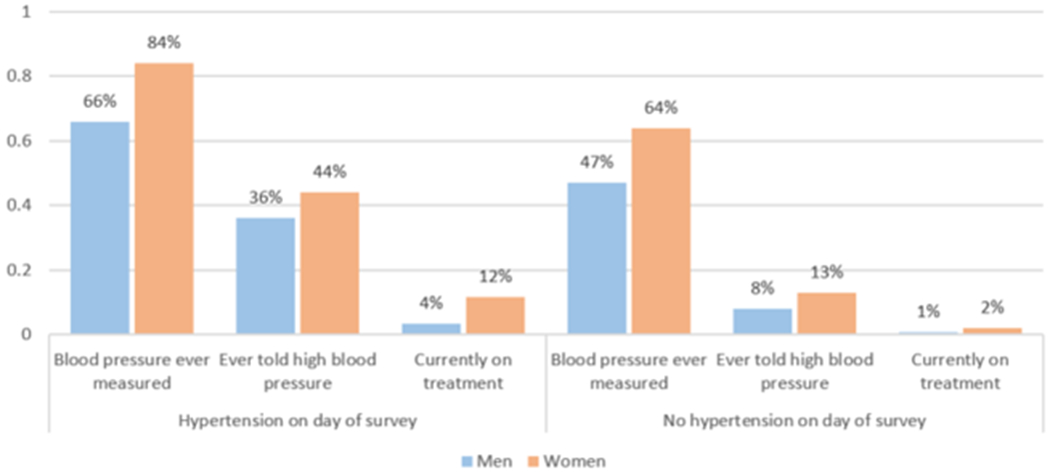
Hypertension care continuum by sex and hypertension status per actual blood pressure measures.
Among all previously diagnosed adults, regardless of current hypertension status, 8.4% of men and 20.5% of women reported such treatment. Nevertheless, 42.1% were hypertensive per actual blood pressure measures, as were 50.5% of adults reporting current anti-hypertensive treatment prescribed by a clinician. In addition to patients reporting clinician-prescribed treatment alone or in addition to herbal treatment (67.8% of those reporting any treatment), 32.2% of patients reported receiving only herbal or self-prescribed treatment.
Correlates of hypertension
In multivariable analyses, increasing age was associated with increased odds of hypertension, with an adjusted odds ratio (aOR)=1.40 (95% confidence interval [CI]:1.23-1.60) for each 5-year increase in age among men and aOR=1.34 (95% CI:1.22-1.47) among women. Each 5 percentage point increase in waypoint-level hypertension prevalence was also consistently associated with increased odds of hypertension (aOR=1.42 [95% CI:1.19-1.70] among men, aOR=1.26 [95% CI:1.17-1.36] among women). Overweight and obesity were only associated with hypertension among women (aOR=1.90, 95% CI:1.09-3.33, and aOR=5.73, 95% CI:2.49-13.19, respectively), as was non-receipt of needed healthcare in the preceding six months (aOR=2.82, 95% CI:1.35-5.88). Migration history was a statistically significant correlate of hypertension among men (aOR=3.32, 95% CI:1.79-6.17, for three years or less in the neighborhood versus more than three years). (Table 3)
Table 3.
Factors associated with hypertension, by sex (N=886).
| Men | Women | |||||
|---|---|---|---|---|---|---|
| Bivariate N | OR | aOR (N=333)* | Bivariate N | OR | aOR (N=531)* | |
| Sociodemographics | ||||||
| Age | ||||||
| 5-year increase | 346 | 1.26 (1.11-1.43) | 1.40 (1.23-1.60) | 540 | 1.32 (1.21-1.45) | 1.34 (1.22-1.47) |
| Education | ||||||
| None | 10 | 3.89 (0.79-19.2) | 57 | 1.43 (0.86-2.36) | ||
| Primary | 98 | ref | 186 | ref | ||
| Secondary or higher | 237 | 1.50 (0.86-2.59) | 297 | 0.35 (0.20-0.62) | ||
| Time in current neighborhood | ||||||
| ≤3 years | 137 | 1.91 (1.15-3.17) | 3.32 (1.79-6.17) | 239 | 0.61 (0.37-1.01) | |
| >3 years | 208 | ref | ref | 301 | ref | |
| Health status | ||||||
| Did not receive needed care in past 6 months | ||||||
| Yes | 88 | 1.35 (0.77-2.35) | 144 | 2.55 (1.47-4.45) | 2.82 (1.35-5.88) | |
| No | 258 | ref | 396 | ref | ref | |
| Kessler-6 psychological distress score | ||||||
| 1-point increase | 346 | 0.96 (0.89-1.02) | 538 | 1.09 (1.02-1.17) | ||
| Individual risk factors | ||||||
| BMI | ||||||
| Underweight (<18.5) | 34 | 0.30 (0.06-1.53) | 0.33 (0.05-2.28) | 44 | 0.68 (0.26-1.78) | 0.81 (0.27-2.48) |
| Normal (18.5-<25) | 228 | ref | ref | 230 | ref | ref |
| Overweight (25-<30) | 61 | 2.08 (1.07-4.04) | 1.13 (0.54-2.35) | 170 | 1.95 (1.12-3.38) | 1.90 (1.09-3.33) |
| Obese (>=30) | 11 | 1.46 (0.34-6.28) | 0.99 (0.22-4.43) | 87 | 4.31 (2.10-8.86) | 5.73 (2.49-13.19) |
| Central obesity | ||||||
| Yes | 21 | 6.23 (1.74-22.35) | 302 | 2.79 (1.71-4.56) | ||
| No | 321 | ref | 231 | ref | ||
| Tobacco use | ||||||
| Current smoker | 45 | 1.05 (0.49-2.23) | 21 | 0.60 (0.12-2.96) | ||
| Previous or never smoker | 301 | ref | 519 | ref | ||
| Alcohol consumption | ||||||
| At least twice a week | 106 | 0.77 (0.42-1.43) | 39 | 0.44 (0.14-1.41) | ||
| Less than twice a week or never | 240 | ref | 501 | ref | ||
| Consumes fried food at least once a day | ||||||
| Yes | 244 | 1.09 (0.50-2.37) | 357 | 0.45 (0.27-0.76) | ||
| No | 102 | ref | 181 | ref | ||
| Adds salty seasoning or sauce to foods | ||||||
| Always or often | 95 | 0.98 (0.43-2.19) | 164 | 0.94 (0.58-1.51) | ||
| Sometimes, rarely, or never | 246 | ref | 374 | ref | ||
| Household environment | ||||||
| Cooking location | ||||||
| Indoor | 210 | 1.05 (0.60-1.83) | 337 | 0.66 (0.40-1.09) | ||
| Outdoor | 126 | ref | 202 | ref | ||
| Number of household members | ||||||
| 1-person increase | 346 | 1.02 (0.90-1.16) | 540 | 0.94 (0.86-1.03) | ||
| Waypoint hypertension prevalence (excluding self) | ||||||
| 5 percentage point increase | 346 | 1.40 (1.23-1.61) | 1.42 (1.19-1.70) | 540 | 1.24 (1.14-1.35) | 1.26 (1.17-1.36) |
The adjusted population-attributable fraction of hypertension due to overweight and obesity was 2.2% among men and 64.8% among women.
Persons with hypertension tended to live in waypoints with greater hypertension prevalence (excluding self: 30% versus 15% for those without hypertension). They were more likely to have been unable to access needed care in the six months prior (36.7% versus 22.5%). There was no appreciable difference in nutritional practices by hypertension status. (see Table, Supplemental Digital Content 2)
Discussion
We found a high prevalence of hypertension in a population-representative sample of residents of four slums in Port-au-Prince, including among young adults, along with large treatment gaps and potentially unique risk factors for the condition. Hypertension appears to cluster, possibly suggesting presence of a social network effect, which could be leveraged in the development of hypertension management programs in this setting.
Overall, 20.3% of adults were classified as having hypertension (age-standardized prevalence of 28.5%). This estimate is higher than most of those reported in other countries with comparable slum-based surveys [14, 15, 17, 18], but lower than in most research from non-slum settings in Haiti (generally convenience samples [33–39] and often from healthcare settings [33–36, 39]). Our estimates are also lower than those from two randomly selected urban population samples in Haiti. In 2002-03, hypertension prevalence was estimated at 47.0% in Port-au-Prince residents aged 20 and above [5], while the 2016-17 Demographic and Health Survey (DHS) estimates for ages 35-64 across urban Haiti were 49.2% among women and 40.5% among men [40], compared to 35.0% and 36.2%, respectively, in this age group in our sample. The higher prevalence of pre-hypertension, overweight, and obesity in our study signals a potential for increases in the burden of hypertension in the slum communities.
Notably, hypertension in our study was common among young adults, including 11.1% of 18 to 30-year-olds. This is much higher than the 5.1% prevalence in a 2011-14 population-representative sample of black US Americans ages 20-30 [41], though population-representative surveys in Rwanda [42], Uganda [43, 44], and Tanzania [44] also found high hypertension prevalence among young adults.
Missed opportunities to provide hypertension diagnosis and care were common in our population. Over a third of hypertensive adults had sought medical care in the recent past and four in ten had previously been told they had the condition (similar or slightly lower than awareness rates previously reported in Haiti [38, 39]). Furthermore, few persons previously diagnosed with hypertension were receiving treatment (less than half of the proportion on treatment reported by the 2016-17 DHS for urban Haiti [40]) and only half of them had the condition controlled (similar to another Haitian sample [37]). Many of these missed opportunities may have occurred because Haitian healthcare services remain focused on communicable conditions, and have not yet adapted to the growing burden of diagnosing and treating NCDs. To maximize patient engagement as access to treatment expands, a diversity of beliefs and preferences should also be considered, as some Haitians may consider hypertension a natural state, while others may seek herbal treatments [45].
Unique risk factors may contribute to hypertension in this population, particularly for men, among whom only 2.2% of hypertension cases were attributable to overweight/obesity. Data from Tanzania and Uganda has also shown a low population-attributable fraction of hypertension for above-normal BMI and central obesity [44], and similarly lower for men than women (personal communication). While we did not have data on many possible risk factors of interest for slum communities, such as stress, exposure to adverse intrauterine environment [46, 47], HIV and antiretroviral treatment status [48, 49], and lead exposure [50], we found strong associations with social determinants such as non-receipt of needed medical care and recent migration to the slum.
Internal migrants are a vulnerable population with sometimes worse health outcomes than host populations [51]. Studies have reported higher blood pressure and/or hypertension levels among recent arrivals [52–54], though some research suggests worsening risk profiles with increased duration of exposure to urban lifestyle and environment [55–57]. An association between migration and increased blood pressure among men only has also been observed previously, possibly due to greater weight gain [58]; drop in physical activity [59]; higher cumulative number of moves, or migration in search of employment and/or alone [57]. The latter may be linked with CVD via depression [60, 61]. Most published research, however, has examined rural-urban migration [52–54, 56–59, 62–65], while the most recent move was intraurban for the majority of migrants in our sample. Future studies of slum communities should assess risk factors specifically with respect to intraurban mobility [3].
Our study also suggests that hypertension programs could be informed by possible social network effects, as indicated by the observed clustering of persons with hypertension. Given Haiti’s strong community bonds [66], offering prevention knowledge and treatment to patients in this setting may facilitate health promotion in these individuals’ immediate environments.
To optimize resource allocation in low-resource settings, it is important to minimize patient misclassification. Although hypertension diagnosis ideally should be based on blood pressure measurements from two different days [67, 68], this requirement can constitute a barrier to timely diagnosis. Simplified screening protocols [69], region-specific non-laboratory cardiovascular risk scores [70], and low-cost laboratory measures such as urine dipstick tests for proteinuria [67] have been proposed to sustainably improve single-visit assessments of cardiovascular risk, though in some low-resource settings, treating everyone with hypertension may be more cost-effective than any risk stratification [67].
Community health workers may be a valuable resource for hypertension control in slum settings, as demonstrated by SCALE UP, an intervention in a community of 35,000 residents in Nairobi, Kenya [71]. Combining door-to-door hypertension screening and awareness activities, group and text message adherence support, and patient and provider treatment incentives, the intervention saw high participation rates [72] at a cost of approximately 1 USD per person per year [71]. Community education, complementing individual prevention and therapeutic focus, is critical to produce population-level cardiovascular risk improvements in dynamic slum communities with a lot of in- and out-migration [67].
Finally, successful hypertension control programs in impoverished settings will also require efficient long-term management of a range of chronic conditions, including strategies such as task sharing, and continued availability of funding mechanisms and affordable medications in primary health settings [73]. Major medications for hypertension and other chronic diseases remain largely unavailable and/or unaffordable in low-income countries [74].
Strengths of this study include its population-representative design and high completion rate, enabling us to publish rare weighted estimates of hypertension prevalence and its risk factors for Haiti, expanding on older research from 2002-03 [5], as well as Haiti’s 2016-17 Demographic and Health Survey, which provided estimates for persons aged 35-64 living in urban areas more broadly [40]. By focusing on slum communities and characterizing a wide range of risk factors, this work offers a more comprehensive view of hypertension in this unique setting and contributes to the limited literature reporting population-representative slum hypertension estimates. We adhered to the WHO STEPS blood pressure measurement guidelines [25] and the JNC-VII hypertension definition [27], facilitating comparisons with other research.
Among limitations, a single-day blood pressure measurement is likely to overestimate hypertension prevalence [68]. Because of the length of the survey, we were also unable to include validated scales for assessment of complex concepts such as diet, or assess physical activity.
In conclusion, in our population-representative sample of adult slum residents in Port-au-Prince, substantial hypertension rates were found across the age spectrum. As slum populations worldwide continue to grow, it will be critical to better understand the unique risk factors for hypertension and cardiovascular disease in these communities, including strong social networks, environmental risk factors, and intraurban migration. In addition, health systems will need to adapt to provide cost-effective primary and secondary prevention programs to slum residents.
Supplementary Material
Supplemental Digital Content 1: Survey design details (text).
Supplemental Digital Content 2: Characteristics of participants without hypertension, with pre-hypertension, and with hypertension (table).
Acknowledgements
The authors thanks study participants and fieldworkers who collected study data.
Conflicts of interest and source of funding
None declared. The study was funded by National Institutes of Health (NIH): the Fogarty International Center and the National Heart, Lung, and Blood Institute through the VECD Fogarty Global Health Fellows Program (grants D43 TW009337, R24 TW09337), the Fogarty International Center and the National Institute of Allergy and Infectious Diseases through grant 3D43TW009606-03S1, and the National Heart, Lung, and Blood Institute through grant R01 HL153788-01. The content is solely the responsibility of the authors and does not necessarily represent the official views of the NIH.
Abbreviations
- NCD
non-communicable disease
- CVD
cardiovascular disease
- LMICs
lower- and middle-income countries
- WHO
World Health Organization
- GHESKIO
Haitian Group for the Study of Kaposi’s Sarcoma and Opportunistic Infections
- SBP
systolic blood pressure
- DBP
diastolic blood pressure
- JNC-VII
Joint National Committee on Prevention, Detection, Evaluation, and Treatment of High Blood Pressure
- ACC
American College of Cardiology
- RedCap
Research Electronic Data Capture
- BMI
body mass index
- aOR
adjusted odds ratio
- CI
confidence interval
- IQR
interquartile range
Footnotes
Previous presentations of this work:
None
References
- 1.Mendis S, Armstrong T, Bettcher D, Branca F, Lauer J, Mace C, et al. Global status report on noncommunicable diseases 2014. Switzerland: World Health Organization; 2014:14–5. [Google Scholar]
- 2.UN-Habitat. The challenge of slums: global report on human settlements. 2003.
- 3.Ezeh A, Oyebode O, Satterthwaite D, Chen YF, Ndugwa R, Sartori J, et al. The history, geography, and sociology of slums and the health problems of people who live in slums. Lancet. 2017;389(10068):547–58. [DOI] [PubMed] [Google Scholar]
- 4.The World Bank. Population living in slums, (% of urban population) 2017. [Available from: http://data.worldbank.org/indicator/EN.POP.SLUM.UR.ZS?view=map.
- 5.Jean-Baptiste ED, Larco P, Charles-Larco N, Vilgrain C, Simon D, Charles R. Glucose intolerance and other cardiovascular risk factors in Haiti. Prevalence of Diabetes and Hypertension in Haiti (PREDIAH). Diabetes & metabolism. 2006;32(5 Pt 1):443–51. [DOI] [PubMed] [Google Scholar]
- 6.Global, regional, and national age-sex specific all-cause and cause-specific mortality for 240 causes of death, 1990-2013: a systematic analysis for the Global Burden of Disease Study 2013. Lancet. 2015;385(9963):117–71. [DOI] [PMC free article] [PubMed] [Google Scholar]
- 7.Lavados PM, Hennis AJ, Fernandes JG, Medina MT, Legetic B, Hoppe A, et al. Stroke epidemiology, prevention, and management strategies at a regional level: Latin America and the Caribbean. The Lancet Neurology. 2007;6(4):362–72. [DOI] [PubMed] [Google Scholar]
- 8.Malebranche R, Tabou Moyo C, Morisset PH, Raphael NA, Wilentz JR. Clinical and echocardiographic characteristics and outcomes in congestive heart failure at the Hospital of The State University of Haiti. American heart journal. 2016;178:151–60. [DOI] [PubMed] [Google Scholar]
- 9.Kwan GF, Jean-Baptiste W, Cleophat P, Leandre F, Louine M, Luma M, et al. Descriptive epidemiology and short-term outcomes of heart failure hospitalisation in rural Haiti. Heart (British Cardiac Society). 2016;102(2):140–6. [DOI] [PMC free article] [PubMed] [Google Scholar]
- 10.Acharyya T, Kaur P, Murhekar MV. Prevalence of behavioral risk factors, overweight and hypertension in the urban slums of North 24 Parganas District, West Bengal, India, 2010. Indian journal of public health. 2014;58(3):195–8. [DOI] [PubMed] [Google Scholar]
- 11.Banerjee S, Mukherjee TK, Basu S. Prevalence, awareness, and control of hypertension in the slums of Kolkata. Indian heart journal. 2016;68(3):286–94. [DOI] [PMC free article] [PubMed] [Google Scholar]
- 12.Daniel OJ, Adejumo OA, Adejumo EN, Owolabi RS, Braimoh RW. Prevalence of hypertension among urban slum dwellers in Lagos, Nigeria. J Urban Health. 2013;90(6):1016–25. [DOI] [PMC free article] [PubMed] [Google Scholar]
- 13.Ezeala-Adikaibe BA, Orjioke C, Ekenze OS, Ijoma U, Onodugo O, Okudo G, et al. Population-based prevalence of high blood pressure among adults in an urban slum in Enugu, South East Nigeria. Journal of human hypertension. 2016;30(4):285–91. [DOI] [PubMed] [Google Scholar]
- 14.Heitzinger K, Montano SM, Hawes SE, Alarcon JO, Zunt JR. A community-based cluster randomized survey of noncommunicable disease and risk factors in a peri-urban shantytown in Lima, Peru. BMC international health and human rights. 2014;14:19. [DOI] [PMC free article] [PubMed] [Google Scholar]
- 15.Joshi MD, Ayah R, Njau EK, Wanjiru R, Kayima JK, Njeru EK, et al. Prevalence of hypertension and associated cardiovascular risk factors in an urban slum in Nairobi, Kenya: a population-based survey. BMC public health. 2014;14:1177. [DOI] [PMC free article] [PubMed] [Google Scholar]
- 16.Olack B, Wabwire-Mangen F, Smeeth L, Montgomery JM, Kiwanuka N, Breiman RF. Risk factors of hypertension among adults aged 35-64 years living in an urban slum Nairobi, Kenya. BMC public health. 2015;15:1251. [DOI] [PMC free article] [PubMed] [Google Scholar]
- 17.Unger A, Felzemburgh RD, Snyder RE, Ribeiro GS, Mohr S, Costa VB, et al. Hypertension in a Brazilian urban slum population. J Urban Health. 2015;92(3):446–59. [DOI] [PMC free article] [PubMed] [Google Scholar]
- 18.Van de Vijver SJ, Oti SO, Agyemang C, Gomez GB, Kyobutungi C. Prevalence, awareness, treatment and control of hypertension among slum dwellers in Nairobi, Kenya. Journal of hypertension. 2013;31(5):1018–24. [DOI] [PubMed] [Google Scholar]
- 19.Anand K, Shah B, Yadav K, Singh R, Mathur P, Paul E, et al. Are the urban poor vulnerable to non-communicable diseases? A survey of risk factors for non-communicable diseases in urban slums of Faridabad. The National medical journal of India. 2007;20(3):115–20. [PubMed] [Google Scholar]
- 20.GHESKIO Centers. [Available from: http://www.gheskio.org/wp/.
- 21.Rouzier V, Severe K, Juste MA, Peck M, Perodin C, Severe P, et al. Cholera vaccination in urban Haiti. The American journal of tropical medicine and hygiene. 2013;89(4):671–81. [DOI] [PMC free article] [PubMed] [Google Scholar]
- 22.Dixon S, Holt J. Port-au-Prince Urban Baseline. An Assessment of Food and Livelihood Security in Port-au-Prince. 2009. [Google Scholar]
- 23.DigitalGlobe Foundation. DigitalGlobe Foundation Maps API 2018. [Available from: https://www.digitalglobe.com/platforms/mapsapi.
- 24.MEASURE DHS/ICF International. Demographic and Health Survey Interviewer’s Manual. Calverton, Maryland: October 2012. [Google Scholar]
- 25.World Health Organization. Chronic Diseases and Health Promotion. STEPS Manual. [Available from: http://www.who.int/chp/steps/manual/en/index3.html.
- 26.Harris PA, Taylor R, Thielke R, Payne J, Gonzalez N, Conde JG. Research electronic data capture (REDCap)--a metadata-driven methodology and workflow process for providing translational research informatics support. Journal of biomedical informatics. 2009;42(2):377–81. [DOI] [PMC free article] [PubMed] [Google Scholar]
- 27.Chobanian AV, Bakris GL, Black HR, Cushman WC, Green LA, Izzo JL, Jr., et al. The Seventh Report of the Joint National Committee on Prevention, Detection, Evaluation, and Treatment of High Blood Pressure: the JNC 7 report. JAMA : the journal of the American Medical Association. 2003;289(19):2560–72. [DOI] [PubMed] [Google Scholar]
- 28.Whelton PK, Carey RM, Aronow WS, Casey DE Jr., Collins KJ, Dennison Himmelfarb C, et al. 2017 ACC/AHA/AAPA/ABC/ACPM/AGS/APhA/ASH/ASPC/NMA/PCNA Guideline for the Prevention, Detection, Evaluation, and Management of High Blood Pressure in Adults: A Report of the American College of Cardiology/American Heart Association Task Force on Clinical Practice Guidelines. Journal of the American College of Cardiology. 2017. [DOI] [PubMed] [Google Scholar]
- 29.World Health Organization. Global Database on Body Mass Index [Available from: http://apps.who.int/bmi/index.jsp?introPage=intro_3.html.
- 30.World Health Organization. Waist circumference and waist–hip ratio: Report of a WHO expert consultation; 2011.
- 31.Kessler RC, Andrews G, Colpe LJ, Hiripi E, Mroczek DK, Normand SL, et al. Short screening scales to monitor population prevalences and trends in non-specific psychological distress. Psychological medicine. 2002;32(6):959–76. [DOI] [PubMed] [Google Scholar]
- 32.National Cancer Institute Suveillance E, and End Results (SEER) Program. Standard Populations - Single Ages. World (WHO 2000-2025) Standard. [Available from: https://seer.cancer.gov/stdpopulations/stdpop.singleages.html.
- 33.Dickstein Y, Neuberger A, Golus M, Schwartz E. Epidemiologic profile of patients seen in primary care clinics in an urban and a rural setting in Haiti, 2010-11. International health. 2014;6(3):258–62. [DOI] [PubMed] [Google Scholar]
- 34.Lluberas G, Parrish LA, Kling CM. Hypertension prevalence in a rural Haitian missionary clinic. The Nurse practitioner. 2000;25(11):59–61. [DOI] [PubMed] [Google Scholar]
- 35.Malino C, Kershaw T, Angley M, Frederic R, Small M. Social capital and hypertension in rural Haitian women. Maternal and child health journal. 2014;18(10):2253–60. [DOI] [PubMed] [Google Scholar]
- 36.Niska RW, Sloand E. Ambulatory medical care in rural Haiti. Journal of health care for the poor and underserved. 2010;21(1):70–80. [DOI] [PubMed] [Google Scholar]
- 37.Pierce L, Shannon A, Sonnenfeld J, Pearlmutter M, Previl H, Forrester JE. Hypertension prevalence and knowledge assessment in rural Haiti. Ethnicity & disease. 2014;24(2):213–9. [PubMed] [Google Scholar]
- 38.Polsinelli VB, Satchidanand N, Singh R, Holmes D, Izzo JL Jr. Hypertension and aging in rural Haiti: results from a preliminary survey. Journal of human hypertension. 2016. [DOI] [PubMed] [Google Scholar]
- 39.Shipp ML. Awareness status and prevalence of hypertension in a group of urban Haitians: findings of a population-based survey. Ethnicity & disease. 2001;11(3):419–30. [PubMed] [Google Scholar]
- 40.Institut Haïtien de l’Enfance (IHE) and ICF. Enquête Mortalité, Morbidité et Utilisation des Services (EMMUS-VI 2016-2017). Pétion-Ville, Haïti, and Rockville, Maryland, USA; 2018. [Google Scholar]
- 41.Centers for Disease Control and Prevention National Center for Health Statistics. National Health and Nutrition Examination Survey. Questionnaires, Datasets, and Related Documentation. [Available from: https://www.cdc.gov/nchs/nhanes/nhanes_questionnaires.htm.
- 42.Nahimana MR, Nyandwi A, Muhimpundu MA, Olu O, Condo JU, Rusanganwa A, et al. A population-based national estimate of the prevalence and risk factors associated with hypertension in Rwanda: implications for prevention and control. BMC public health. 2017;18(1):2. [DOI] [PMC free article] [PubMed] [Google Scholar]
- 43.Guwatudde D, Mutungi G, Wesonga R, Kajjura R, Kasule H, Muwonge J, et al. The Epidemiology of Hypertension in Uganda: Findings from the National Non-Communicable Diseases Risk Factor Survey. PloS one. 2015;10(9):e0138991. [DOI] [PMC free article] [PubMed] [Google Scholar]
- 44.Kavishe B, Biraro S, Baisley K, Vanobberghen F, Kapiga S, Munderi P, et al. High prevalence of hypertension and of risk factors for non-communicable diseases (NCDs): a population based cross-sectional survey of NCDS and HIV infection in Northwestern Tanzania and Southern Uganda. BMC medicine. 2015;13:126. [DOI] [PMC free article] [PubMed] [Google Scholar]
- 45.Sanon MA, Mohammed SA, McCullagh MC. Definition and management of hypertension among Haitian immigrants: a qualitative study. Journal of health care for the poor and underserved. 2014;25(3):1067–78. [DOI] [PMC free article] [PubMed] [Google Scholar]
- 46.Oparil S, Acelajado MC, Bakris GL, Berlowitz DR, Cifkova R, Dominiczak AF, et al. Hypertension. Nature reviews Disease primers. 2018;4:18014. [DOI] [PMC free article] [PubMed] [Google Scholar]
- 47.Poulter NR, Prabhakaran D, Caulfield M. Hypertension. Lancet. 2015;386(9995):801–12. [DOI] [PubMed] [Google Scholar]
- 48.Rivera VR, Jean-Juste MA, Gluck SC, Reeder HT, Sainristil J, Julma P, et al. Diagnostic yield of active case finding for tuberculosis and HIV at the household level in slums in Haiti. The international journal of tuberculosis and lung disease : the official journal of the International Union against Tuberculosis and Lung Disease. 2017;21(11):1140–6. [DOI] [PMC free article] [PubMed] [Google Scholar]
- 49.Fahme SA, Bloomfield GS, Peck R. Hypertension in HIV-Infected Adults: Novel Pathophysiologic Mechanisms. Hypertension. 2018;72(1):44–55. [DOI] [PMC free article] [PubMed] [Google Scholar]
- 50.Sirivarasai J, Kaojarern S, Chanprasertyothin S, Panpunuan P, Petchpoung K, Tatsaneeyapant A, et al. Environmental lead exposure, catalase gene, and markers of antioxidant and oxidative stress relation to hypertension: an analysis based on the EGAT study. BioMed research international. 2015;2015:856319. [DOI] [PMC free article] [PubMed] [Google Scholar]
- 51.McKay L, Macintyre S, Ellaway A. Migration and health: a review of the international literature. 2003.
- 52.Poulter NR, Khaw KT, Hopwood BE, Mugambi M, Peart WS, Rose G, et al. The Kenyan Luo migration study: observations on the initiation of a rise in blood pressure. BMJ (Clinical research ed). 1990;300(6730):967–72. [DOI] [PMC free article] [PubMed] [Google Scholar]
- 53.Sobngwi E, Mbanya JC, Unwin NC, Porcher R, Kengne AP, Fezeu L, et al. Exposure over the life course to an urban environment and its relation with obesity, diabetes, and hypertension in rural and urban Cameroon. Int J Epidemiol. 2004;33(4):769–76. [DOI] [PubMed] [Google Scholar]
- 54.Zhao J, Seubsman SA, Sleigh A, Thai Cohort Study Team T. Timing of urbanisation and cardiovascular risks in Thailand: evidence from 51 936 members of the thai cohort study, 2005-2009. Journal of epidemiology / Japan Epidemiological Association. 2014;24(6):484–93. [DOI] [PMC free article] [PubMed] [Google Scholar]
- 55.Peer N, Steyn K, Lombard C, Gwebushe N, Levitt N. A high burden of hypertension in the urban black population of Cape Town: the cardiovascular risk in Black South Africans (CRIBSA) study. PloS one. 2013;8(11):e78567. [DOI] [PMC free article] [PubMed] [Google Scholar]
- 56.Shahul Hameed S, Kutty VR, Vijayakumar K, Kamalasanan A. Migration Status and Prevalence of Chronic Diseases in Kerala State, India. International journal of chronic diseases. 2013;2013:431818. [DOI] [PMC free article] [PubMed] [Google Scholar]
- 57.Wheaton FV, Crimmins EM. In hindsight: urban exposure explains the association between prior migration and current health of older adults in Mexico. Journal of aging and health. 2013;25(3):422–38. [DOI] [PMC free article] [PubMed] [Google Scholar]
- 58.Salmond CE, Prior IA, Wessen AF. Blood pressure patterns and migration: a 14-year cohort study of adult Tokelauans. Am J Epidemiol. 1989;130(1):37–52. [DOI] [PubMed] [Google Scholar]
- 59.Torun B, Stein AD, Schroeder D, Grajeda R, Conlisk A, Rodriguez M, et al. Rural-to-urban migration and cardiovascular disease risk factors in young Guatemalan adults. Int J Epidemiol. 2002;31(1):218–26. [DOI] [PubMed] [Google Scholar]
- 60.Lu Y Rural-urban migration and health: evidence from longitudinal data in Indonesia. Social science & medicine (1982). 2010;70(3):412–9. [DOI] [PMC free article] [PubMed] [Google Scholar]
- 61.Seligman F, Nemeroff CB. The interface of depression and cardiovascular disease: therapeutic implications. Ann N Y Acad Sci. 2015;1345:25–35. [DOI] [PubMed] [Google Scholar]
- 62.Ebrahim S, Kinra S, Bowen L, Andersen E, Ben-Shlomo Y, Lyngdoh T, et al. The effect of rural-to-urban migration on obesity and diabetes in India: a cross-sectional study. PLoS medicine. 2010;7(4):e1000268. [DOI] [PMC free article] [PubMed] [Google Scholar]
- 63.Bernabe-Ortiz A, Sanchez JF, Carrillo-Larco RM, Gilman RH, Poterico JA, Quispe R, et al. Rural-to-urban migration and risk of hypertension: longitudinal results of the PERU MIGRANT study. Journal of human hypertension. 2017;31(1):22–8. [DOI] [PMC free article] [PubMed] [Google Scholar]
- 64.Doulougou B, Kouanda S, Rossier C, Soura A, Zunzunegui MV. Differences in hypertension between informal and formal areas of Ouagadougou, a sub-Saharan African city. BMC public health. 2014;14:893. [DOI] [PMC free article] [PubMed] [Google Scholar]
- 65.Lerner AG, Bernabe-Ortiz A, Gilman RH, Smeeth L, Miranda JJ. The “rule of halves” does not apply in Peru: awareness, treatment, and control of hypertension and diabetes in rural, urban, and rural-to-urban migrants. Critical pathways in cardiology. 2013;12(2):53–8. [DOI] [PMC free article] [PubMed] [Google Scholar]
- 66.Kelch R, Wehbe-Alamah H, McFarland M. Implementation of Hypertension and Diabetes Chronic Disease Management in an Adult Group in Les Bours, Haiti. 2015.
- 67.Modesti PA, Agostoni P, Agyemang C, Basu S, Benetos A, Cappuccio FP, et al. Cardiovascular risk assessment in low-resource settings: a consensus document of the European Society of Hypertension Working Group on Hypertension and Cardiovascular Risk in Low Resource Settings. Journal of hypertension. 2014;32(5):951–60. [DOI] [PMC free article] [PubMed] [Google Scholar]
- 68.Modesti PA, Rapi S, Bamoshmoosh M, Baldereschi M, Massetti L, Padeletti L, et al. Impact of one or two visits strategy on hypertension burden estimation in HYDY, a population-based cross-sectional study: implications for healthcare resource allocation decision making. BMJ open. 2012;2(4). [DOI] [PMC free article] [PubMed] [Google Scholar]
- 69.Schwalm JD, McKee M, Huffman MD, Yusuf S. Resource Effective Strategies to Prevent and Treat Cardiovascular Disease. Circulation. 2016;133(8):742–55. [DOI] [PMC free article] [PubMed] [Google Scholar]
- 70.Joseph P, Yusuf S, Lee SF, Ibrahim Q, Teo K, Rangarajan S, et al. Prognostic validation of a non-laboratory and a laboratory based cardiovascular disease risk score in multiple regions of the world. Heart (British Cardiac Society). 2018;104(7):581–7. [DOI] [PMC free article] [PubMed] [Google Scholar]
- 71.van de Vijver S, Oti S, Tervaert TC, Hankins C, Kyobutungi C, Gomez GB, et al. Introducing a model of cardiovascular prevention in Nairobi’s slums by integrating a public health and private-sector approach: the SCALE-UP study. Global health action. 2013;6:22510. [DOI] [PMC free article] [PubMed] [Google Scholar]
- 72.van de Vijver S, Oti S, Moll van Charante E, Allender S, Foster C, Lange J, et al. Cardiovascular prevention model from Kenyan slums to migrants in the Netherlands. Global Health. 2015;11:11. [DOI] [PMC free article] [PubMed] [Google Scholar]
- 73.Bovet P, Chiolero A, Paccaud F, Banatvala N. Screening for cardiovascular disease risk and subsequent management in low and middle income countries: challenges and opportunities. Public health reviews. 2015;36:13. [DOI] [PMC free article] [PubMed] [Google Scholar]
- 74.Attaei MW, Khatib R, McKee M, Lear S, Dagenais G, Igumbor EU, et al. Availability and affordability of blood pressure-lowering medicines and the effect on blood pressure control in high-income, middle-income, and low-income countries: an analysis of the PURE study data. The Lancet Public health. 2017;2(9):e411–e9. [DOI] [PubMed] [Google Scholar]
Associated Data
This section collects any data citations, data availability statements, or supplementary materials included in this article.
Supplementary Materials
Supplemental Digital Content 1: Survey design details (text).
Supplemental Digital Content 2: Characteristics of participants without hypertension, with pre-hypertension, and with hypertension (table).