

Abstract
Neuroimmune factors, including the cytokine interleukin-6 (IL-6), are important chemical regulators of central nervous system (CNS) function under both physiological and pathological conditions. Elevated expression of IL-6 occurs in the CNS in a variety of disorders associated with altered CNS function, including excessive alcohol use. Alcohol-induced production of IL-6 has been reported for several CNS regions including the cerebellum. Cerebellar actions of alcohol occur through a variety of mechanisms, but alcohol-induced changes in signal transduction, transcription, and translation are known to play important roles. IL-6 is an activator of signal transduction that regulates gene expression. Thus, alcohol-induced IL-6 production could contribute to cerebellar effects of alcohol by altering gene expression, especially under conditions of chronic alcohol abuse, where IL-6 levels could be habitually elevated. To gain an understanding of the effects of alcohol on IL-6 signal transduction, we studied activation/expression of IL-6 signal transduction partners STAT3 (Signal Transducer and Activator of Transcription), CCAAT-enhancer binding protein (C/EBP) beta, and p42/p44 mitogen-activated protein kinase (MAPK) at the protein level. Cerebella of transgenic mice that express elevated levels of astrocyte produced IL-6 in the CNS were studied. Results show that the both IL-6 and chronic intermittent alcohol exposure/withdrawal affect IL-6 signal transduction partners and that the actions of IL-6 and alcohol interact to alter activation/expression of IL-6 signal transduction partners. The alcohol/IL-6 interactions may contribute to cerebellar actions of alcohol, whereas the effects of IL-6 alone may have relevance to cerebellar changes occurring in CNS disorders associated with elevated levels of IL-6.
Keywords: STAT3, C/EPB beta, p42/44 MAPK, Glia, GFAP, Chronic intermittent alcohol
Introduction
Alcohol exposure results in elevated CNS expression of a variety of neuroimmune factors including the cytokine IL-6 (Kane et al. 2013, 2014; Doremus-Fitzwater et al. 2014,2015; Alfonso-Loeches et al. 2010; Lippai et al. 2013; Roberts et al. 2019; Robinson et al. 2014), a cytokine known to be increased in the serum of alcoholics (Nicolaou et al. 2004; Heberlein et al. 2014). Alcohol-induced expression of neuroimmune factors has been shown to vary with CNS region, age, alcohol dose, and previous alcohol experience (Kane et al. 2013, 2014; Doremus-Fitzwater et al. 2014, 2015; Alfonso-Loeches et al. 2010; Gano et al. 2016, 2017; Baxter-Potter et al. 2017). Expression can persist long after the termination of alcohol exposure and have long-term effects on CNS function (Qin et al. 2008). Alcohol-induced expression of neuroimmune factors in the CNS has been shown to reflect effects of alcohol on astrocytes and microglia, which are the primary producers of neuroimmune factors in the CNS and are sensitive targets of alcohol action (Miguel-Hidalgo 2018; Adermark and Bowers 2016; Crews et al. 2017). For example, both astrocytes and microglia have been shown to exhibit increase IL-6 production following alcohol exposure (Sarc et al. 2011; Boyadjieva and Sarkar 2010).
The cerebellum is known to be highly sensitive to the effects of alcohol in both the adult and developing nervous system (Alfonso-Loeches and Guerri 2011; Oscar-Berman and Marinkovic 2007). A number of cellular and synaptic changes involving both neurons and glial cells have been reported to occur in the cerebellum in response to either acute or chronic alcohol, and these changes presumably underlie cerebellar symptoms of alcohol use such as ataxia and motor dysfunction (Dar 2015; Zhang et al. 2015; Luo 2015; Riikonen et al. 2002; Valenzuela and Jotty 2015; Worst and Vrana 2005). Chronic alcohol exposure has been shown to induced increased expression of IL-6 mRNA in the cerebellum (Kane et al. 2014). Like alcohol, chronic exposure to IL-6 also significantly affects the cellular and synaptic function of cerebellar neurons and glia (Gruol 2013; Ma et al. 2012; Wei et al. 2011; Gruol and Nelson 2005; Nelson et al. 1999, 2002, 2004; Qiu et al. 1998, 1995; Gruol et al. 2011; Holliday et al. 1995) and can result in behavioral symptoms of cerebellar dysfunction such as tremors and ataxia (Campbell et al. 1993). Many of the cellular targets of IL-6 in the cerebellum are also targets of acute or chronic alcohol. For example, both alcohol and IL-6 alter excitatory responses mediated by glutamate receptors and Ca2+ signaling in cerebellar neurons, and alter the climbing fiber synaptic response in Purkinje neurons (Popp et al. 1999; Bhave et al. 1999; Gruol and Parsons 1996; Valenzuela et al. 1998; Qiu et al. 1998, 1995; Netzeband et al. 2002, 1999; Nelson et al. 1999, 2002, 2004; Raike et al. 2013; Carta et al. 2006; Zhang et al. 2017; Gruol et al. 1997).
Given that alcohol induces the production of IL-6 in the cerebellum, that both alcohol and IL-6 affect cerebellar function, that IL-6 acts through several important signal transduction molecules (STAT3, JAK, p42/44 MAPK, c/EPB beta) to regulate cell function, and that little is known about the effects of alcohol on IL-6 signal transduction in the CNS, in the current studies we tested the hypothesis that chronic alcohol exposure increases the activation/expression of IL-6 signal transduction partners in the cerebellum. In addition, we determine if a previous history of exposure to IL-6 alters the effects of alcohol on activation/expression of IL-6 signal transduction partners. Cerebellum from transgenic mice that express elevated levels of IL-6 in the CNS (TG) and their non-transgenic littermate controls (WT) were used for these studies. The TG mice served as a model for subjects who have experienced long-term exposure to IL-6, such as occurs with long-term alcohol abuse, and consequently, have habitually elevated levels of IL-6 in the CNS. The littermate control mice served as a model for short duration alcohol use and more limited IL-6 exposure. The cerebellum was the focus of these studies because of its high sensitivity to alcohol, its central role in motor behavior, which is affected by IL-6 and alcohol, and because the cerebellum of the TG mice expresses a high level of IL-6 mRNA and presumably protein (Campbell et al. 1993), thus facilitating analyses. The mice were subjected to a chronic intermittent alcohol exposure/withdrawal paradigm, a well-established model for binge alcohol drinking, which can lead to alcohol dependence (Becker and Lopez 2004; Griffin et al. 2009; Lopez and Becker 2014).
Effects of IL-6 are mediated through a specific IL-6 receptor (IL-6R) complex, which consists of the IL-6R alpha subunit (IL-6Rα) and glycoprotein 130 (gp130). The IL-6/IL-6R complex associates with a signal transduction subunit, gp130 that can activate several signal transduction pathways (Fig. 1a). A primary signal transduction pathway utilized by IL-6 is the Janus kinase-STAT3 (JAK-STAT3) pathway. The IL-6/IL-6R/gp130 complex activates JAK through phosphorylation. The activated form of JAK then phosphorylates STAT3 at the Tyr705 site resulting in STAT3 activation (pSTAT3). Previous studies have shown that IL-6, IL-6R, gp130 and IL-6 signal transduction partners including STAT3 are expressed in both neurons and glia of the cerebellum (Schobitz et al. 1993; Gruol et al. 2011; Stromberg et al. 2000; Ha and King 2000; Murata et al. 2000; Planas et al. 1997). STAT3 is an important transcription factor that is widely expressed in the CNS and is a downstream effector of many cytokines and growth factors. STAT3 regulates a variety of neuronal and astrocyte functions under both physiological and pathological conditions (Nicolas et al. 2013; Ceyzeriat et al. 2016). Thus, effects of alcohol on IL-6 signal transduction partners such as STAT3 could have widespread effects on cerebellar function and could contribute to the cerebellar symptoms associated with alcohol use.
Fig. 1.

Signal transduction pathway activated by IL-6. a Diagram shows the canonical IL-6 signal transduction pathway, which involves the membrane bound form of IL-6Rα. Double arrowheads indicate potential interactions with other pathways. A non-canonical pathway also exists in which a soluble form of IL-6Rα binds to membrane bound gp130 to activate the JAK-STAT signal transduction pathway. b Alcohol alters IL-6 levels in cerebellum of TG-EtOH mice. IL-6 levels were significantly increased in cerebellum of TG-naive mice compared to WT-naive mice. Alcohol significantly decreased IL-6 levels in cerebellum of TG-EtOH with no apparent changed in WT-EtOH mice. #Significantly different from WT of the same treatment group. *Significantly different from naive of the same genotype
Results from our studies show differences in IL-6 expression and activation/expression of IL-6 signal transduction partners between the cerebellum of alcohol-naïve TG and WT mice and between the cerebellum of alcohol-naïve and alcohol-exposed/withdrawn mice of the same genotype. These changes involved multiple IL-6 signal transduction partners and suggest actions that could occur under conditions of excessive alcohol used, thereby impacting cerebellar function and the function of downstream targets of cerebellar circuitry involved in cognitive and emotional processes, and psychiatric disorders (Fitzpatrick and Crowe 2013; Phillips et al. 2015; Rossi and Richardson 2018; Carta et al. 2019). Additionally, results from alcohol-naïve animals may provide insights into mechanisms underlying altered cerebellar function in conditions associated with increased levels of IL-6 in the cerebellum such as occurs in aging, disease (e.g., autism, multiple sclerosis, Huntington’s disease, systemic lupus erythematosus), and injury (e.g., traumatic brain injury)(Tomita et al. 2001; Ye and Johnson 2001; Giralt et al. 2013; Wei et al. 2011; Silvestroni et al. 2009; Petkovic et al. 2017).
Materials and Methods
Transgenic Mice
Heterozygous male and female TG mice (n = 21) and littermate WT mice (n = 23) 4–5 months of age at the start of the experiments were used. The mice were obtained by breeding heterozygous TG mice with wildtype C57BL/6J mice. Mice were genotyped by PCR analysis of tail DNA using standard methods. Construction of the TG mice was described previously (Campbell et al. 1993). Elevated expression of IL-6 was directed to CNS astrocytes using an expression vector derived from the murine glial fibrillary acidic protein (GFAP) gene. Expression of the transgene IL-6 mRNA was limited to the brain and astrocytes, and showed highest levels of expression in cerebellum and thalamus (Campbell et al. 1993; Vallieres et al. 2002).
Both high and low expressor TG mice lines have been constructed. The current studies utilized the lower expressor line (line 167), which expresses elevated levels of IL-6 relative to WT mice but not as high as the high expressor. Mice from both the high and low expressor lines exhibit neurological symptoms including ataxia, consistent with a role for IL-6 in cerebellar control of movement, a process that is altered by alcohol. Deficits appear at an earlier age and are more severe in high expressor line, consistent with a dose dependency of the effects of IL-6 in the CNS of the transgenic mice (Brett et al. 1995; Heyser et al. 1997; Campbell et al. 1993; Gyengesi et al. 2019). The neurological changes are progressive, but, with the exception of prominent vascular proliferation at 3 months of age, structural features of the cerebellum in the low expressor line are relatively minor until about 12 months of age. In the high expressor, severe neuropathology is evident at 3–6 months of age. In the current studies, mice were 6–7 months of age at the completion of the alcohol treatment when the animals were sacrificed for biochemical studies of cerebellum.
Chronic Intermittent Alcohol (Ethanol) Treatment
Male and female alcohol-naïve TG and WT (littermates) mice were exposed to a chronic intermittent alcohol exposure/withdrawal paradigm (EtOH group) in vapor chambers (La Jolla Alcohol Research, La Jolla, CA) as described previously (Gruol et al. 2018). Prior to alcohol vapor exposure, the EtOH group was injected with 1.75 g/kg alcohol plus 68.1 mg/kg pyrazole (an alcohol dehydrogenase inhibitor; used to stabilize blood alcohol levels) and placed in chambers used for alcohol vapor exposure. The EtOH group was exposed to three days of alcohol vapor (16 h vapor on, 8 h off) and then left undisturbed for 72 h before a second alcohol/withdrawal cycle was started. Three alcohol/withdrawal cycles were used. Target blood alcohol levels were 150–225 mg%. Blood alcohol levels (BAL) were measured at the end of the 16 h alcohol exposure period on the 2nd day of alcohol exposure for each of the three alcohol/withdrawal cycles. BALs were measured on the 2nd day of alcohol exposure rather than the 3rd day to avoid potential stress that could affect EEG recordings that were made during withdrawal from the 3rd day of alcohol exposure. The EEG studies have been published (Gruol et al. 2018). Alcohol-naïve (naïve group) mice were injected with 68.1 mg/kg pyrazole in saline and placed in air chambers for the same period as the alcohol-exposed animals. For simplicity, the alcohol/withdrawn animals are referred to as TG-EtOH or WT-EtOH; alcohol-naïve mice are referred to as TG-naive or WT-naive. The alcohol exposure/withdrawal paradigm is referred to alcohol exposure for simplicity. Mean (± SEM) BAL values (averaged for 3 alcohol exposure cycles) were 150 ± 12 mg/dl (n = 11) for WT-EtOH mice and 136 ± 11 mg/dl (n = 9) for TG-EOH mice and were not significantly different (F(18,1) = 0.741, p = 0.40) (Gruol et al. 2018). Experimentally, these BALs are considered to reflect moderate levels of alcohol.
Protein Assays
Animals were sacrificed for biochemical studies 24 h after the termination of the third alcohol exposure (i.e., sacrificed after a 24 h withdrawal period). Preparation of protein samples and protein assays were carried out following previously described protocols (Gruol et al. 2018). Briefly, the cerebellum was removed from the brains of mice and snap frozen in liquid nitrogen. For each animal, proteins were extracted from the whole cerebellum by sonication in cold lysis buffer containing 50 mM Tris–HCl, pH 7.5, 150 mM NaCl, 2 mM EDTA, 1% Triton X-100, 0.5% NP-40, a Complete Protease Inhibitor Cocktail Tablet (Roche Diagnostics, Mannheim, Germany), and a cocktail of phosphatase inhibitors (Na+ pyrophosphate, β-glycerophosphate, NaF, Na+ orthovanadate; all from Sigma-Aldrich). The samples were incubated on ice for 30 min, centrifuged at 13,860×g for 30 min at 4 °C, and the supernatants were collected and frozen in aliquots stored at − 80 °C until assayed. Protein concentration in the supernatants was determined using the Bio-Rad Protein Assay Kit (Bio-Rad, Hercules, CA).
Levels of specific cerebellar proteins were determined by Western blot following previously published protocols (Gruol et al. 2014; Nelson et al. 2012). Briefly, cerebellar protein samples from TG and WT mice were subjected to SDS-PAGE using 4–12% Novex NuPAGE Bis–Tris gels (Invitrogen Life Technologies, Grand Island, NY). Each gel contained protein samples from both genotypes and treatment groups. Proteins were transferred to Immobilon-P membranes (Millipore, Billerica, MA). Uniform transfer was assessed by Ponceau S staining (Pierce, Rockford, IL). Membranes were washed and blocked (5% casein solution; Pierce), incubated in primary antibody overnight (4 °C), washed, and then incubated (room temperature) in secondary antibody coupled to horseradish peroxidase (HRP). Protein bands were visualized by chemiluminescence and quantified by densitometry measurements using NIH Image software (https://rsb.info.nih.gov/nih-image/). Membranes were stripped and reprobed for beta-actin. To standardize results, the density of each band of interest was normalized to the density of the band for beta-actin in the same lane. Normalized data from TG and WT cerebellum were then normalized to the average normalized value for cerebellum from WT-naive mice run on the same gel. Data were combined according to genotype and treatment.
The following antibodies were used for Western blot studies: a monoclonal antibody produced in rabbits by immunizing with a fusion protein corresponding to a sequence in the carboxy-terminal of mouse STAT3 (Signal Transducer and Activator of Transcription) protein (AB#4904; 1:1000; Cell Signaling Technologies, Danvers, MA), a purified polyclonal antibody produced in rabbits by immunizing with a synthetic phospho-peptide corresponding to the residues surrounding Tyr705 of mouse STAT3 (AB#9131; 1:1000; Cell Signaling Technologies), a mouse monoclonal antibody to CCAAT-enhancer binding protein (C/EBP) beta raised against amino acids 199–345 at the C-terminus of human C/EBP (sc7962, 1:1000; Santa Cruz Biotechnology, Inc, Santa Cruz, CA), a polyclonal antibody produced in rabbits by immunizing with a synthetic phospho-peptide corresponding to the residues surrounding Tyr202/Try204 of human p44 mitogen-activated protein kinase (MAPK)(AB#9101; 1:500; Cell Signaling Technologies), a mouse monoclonal antibody produced by immunizing mice with a synthetic peptide corresponding to the sequence of p42 MAPK (AB#4696; 1:1000; Cell Signaling Technologies), a purified mouse monoclonal antibody to a synthetic peptide (amino acids 411–422) of human glial fibrillary acidic protein (GFAP) (#75–240, 1–10,000, UC Davis/NIH NeuroMab Facility), a monoclonal antibody to beta-actin produced by immunizing mice with a synthetic peptide corresponding to a sequences in the amino-terminal of human beta-actin (AB#3700, 1:10,000; Cell Signaling Technology), a monoclonal antibody to beta-actin produced by immunizing rabbits with a synthetic peptide corresponding to a sequences in the amino-terminal of human beta-actin (AB#4970, 1:5,000; Cell Signaling Technology), a purified mouse monoclonal antibody to a synthetic peptide (amino acids 411–422) of human glial fibrillary acidic protein (GFAP) (#75–240, 1–10,000, UC Davis/NIH NeuroMab Facility), and a purified polyclonal antibody produced in rabbits by immunization with a synthetic peptide derived from a sequence of human enolase 2 (neuron-specific enolase) (#9536, 1–1000, Cell signaling). Validation for specificity, reproducibility, and reliability of the antibodies were carried out by the manufacturer and the user’s lab.
IL-6 levels
IL-6 levels in protein samples from cerebellum of TG and WT mice were determined using the DuoSet mouse IL-6 ELISA kit (DY406, R&D Systems, Minneapolis, Minn) following manufacturer’s instructions.
Statistics
For statistical analysis of data, normality was determined by the Kolmogorov–Smirnov (K-S) test and variance by the F-test. ANOVA was used for parametric data and the Mann–Whitney test for non-parametric data. However, results were similar using ANOVA and the Mann–Whitney test. For presentation purpose, results are presented from ANOVA and post hoc analyses (Fisher’s PLSD). For regression analyses, combined data from EtOH and naïve conditions were used for each data set. StatView 5.0 (SAS Institute, Inc., Cary, NC) was used for all statistical analyses. Compiled data are expressed as the mean ± SEM. Statistical significance was set at p ≤ 0.05. n = number of animals used. There was no significant difference in results from females and males, and data have been combined for presentation purposes.
Results
IL-6 Levels
Comparison of IL-6 levels in cerebellum from alcohol-naïve and alcohol-exposed mice across genotypes and treatment groups showed a significant genotypic difference (F(1,40) = 37.78, p < 0.0001), treatment effect (F(1,40) = 10.48, p = 0.002), and genotype × treatment interaction (F(1,40) = 5.84, p = 0.02). Post hoc tests showed that, as expected, IL-6 levels in cerebellum from TG-naive mice were significantly higher than in cerebellum from WT-naive mice (p < 0.0001) (Fig. 1b). However, in contrast to the expected alcohol-induced increase in IL-6 levels, there was no significant difference in IL-6 levels between cerebellum from WT-EtOH mice and WT-naive mice (p = 0.95) and IL-6 levels were significantly reduced in cerebellum from TG-EtOH mice compared to cerebellum from TG-naive mice (p = 0.004) (Fig. 1b).
IL-6 Signal Transduction Components
Activation/expression of IL-6 signal transduction partners STAT3, C/EBP beta, and p42/p44 MAPK were studied (Fig. 1a). Results are summarized in Table 1.
Table 1.
Summary of changes in levels of cerebellar proteins
| Protein | Alcohol-naive TG vs. WT | Alcohol vs. naïve of the same genotype | |
|---|---|---|---|
| CB IL-6 TG | CB IL-6 TG | CB WT | |
| IL-6 | ↑ | ↓ | ns |
| pSTAT3 | ↑ | ↓ | ↑ |
| pp42 MAPK | ↑ | ↓ | ns |
| pp44 MAPK | ↑ | ↓ | ns |
| c/EBPβ | ↑ | ↓ | ↓ |
| STAT3 | ↑ | ns | ↓ |
| p42 MAPK | ↓ | ns | ns |
| p44 MAPK | ↓ | ns | ns |
| GFAP | ↑ | ↓ | ns |
| Enolase | ↓ | ↑ | ↓ |
↓ = decrease, ↑ = increase, ns no significant change
STAT3
Comparison of STAT3 levels in cerebellum of alcohol-naïve and alcohol-exposed mice across genotypes and treatment groups showed a significant genotypic difference (F(1,39) = 56.97, p < 0.0001), but no treatment effect (F(1,39) = 0.10, p = 0.76), or genotype × treatment interaction (F(1,39) = 1.28, p = 0.26). Post hoc tests showed that STAT3 levels in cerebellum from TG-naive mice were significantly higher than STAT3 levels in cerebellum from WT-naive mice (p = 0.0001) (Fig. 2a). STAT3 levels in cerebellum from WT-EtOH mice were significantly reduced (p = 0.02) compared to STAT3 levels in cerebellum from WT-naive mice (Fig. 2a). There was no significant difference in STAT3 levels between cerebellum from TG-EtOH and TG-naive mice (p = 0.68) (Fig. 2a).
Fig. 2.

Effects of IL-6 and alcohol on levels of STAT3 and pSTAT3 in cerebellum of TG and WT mice. a, b Graphs showing levels of STAT3 (a) and pSTAT3 (b) in cerebellum of WT and TG mice under different treatment conditions. Representative Western blots are shown above the graphs. STAT3 levels (a) were increased in cerebellum from TG-naive mice compared to cerebellum from WT-naive mice, decreased in cerebellum from WT-EtOH mice compared to cerebellum from WT-naive mice, with no effect in cerebellum from TG-EtOH mice compared to TG-naive mice. pSTAT3 levels (b) were increased in cerebellum from TG-naive mice compared to cerebellum from WT-naive mice, increased in cerebellum from WT-EtOH mice compared to cerebellum from WT-naive mice, and decreased in cerebellum from TG-EtOH mice compared to cerebellum from TG-naive mice. #Significantly different from WT of the same treatment group. *Significantly different from naive of the same genotype
pSTAT3
Comparison of pSTAT3 levels, the activated form of STAT3, in cerebellum from alcohol-naïve and alcohol-exposed mice across genotypes and treatment groups showed a significant genotypic difference (F(1,40) = 123.11, p < 0.0001), treatment effect (F(1,40) = 8.71, p = 0.005), and genotype × treatment interaction (F(1,40) = 22.78, p < 0.0001). In post hoc tests, pSTAT3 levels in cerebellum from TG-naive were significantly higher than in cerebellum from WT-naive mice, consistent with the higher levels of IL-6 in the cerebellum of TG mice (p = 0.0001) (Fig. 2 a,c1). pSTAT3 levels were significantly altered by alcohol in the cerebellum from both TG and WT mice compared to their respective alcohol-naïve mice, but in opposite directions. pSTAT3 levels were significantly increased in cerebellum from WT-EtOH mice (p = 0.0002) (Fig. 2b), but significantly reduced in cerebellum from TG-EtOH mice (p = 0.001) (Fig. 2b).
Simple regression analysis was used to assess potential relationships between BALs or IL-6 and pSTAT3 levels in the cerebellum from TG and WT mice (Fig. 3). In cerebellum from WT mice, this analysis showed no significant linear relationship and a low predictive value (i.e., R2 value) between BALs and IL-6 levels (F(1,20) = 0.03, p = 0.87, R2 = 0.001, Y = 36.69 + 0.015 × X) (Fig. 3a1), and between IL-6 and pSTAT3 levels (F(1,20) = 0.002, p = 0.97, R2 = 0.00, Y = 1.62 – 0.0003 × X) (Fig. 3a2). However, there was a significant linear relationship between BALs and the increase in pSTAT3 (F(1,20) = 24.03, p < 0.0001, R2 = 0.55, Y = 1.02 + 0.008 × X) with a predictive value of 55% (Fig. 3a3). These results suggest that in cerebellum from WT mice, alcohol increased pSTAT3 levels in the cerebellum and that this change did not involve a prominent/direct role for IL-6.
Fig. 3.

Regression analysis of data from studies of STAT3 and pSTAT3. a1–a3 Regression analysis of data from cerebellum of WT mice showed no significant predictive relationship between IL-6 levels and BALs (a1) or pSTAT3 and IL-6 levels (a2), but a significant predictive increase in pSTAT3 levels with increasing BALs (a3). b1–b3 Regression analysis of data from cerebellum of TG mice showed a significant predictive decrease in IL-6 levels with increasing BALs (b1), a significant predictive increase in pSTAT3 and with increasing IL-6 levels (b2), and a significant predictive decrease in pSTAT3 levels with increasing BALs (b3). *Significant linear relationship
In the cerebellum from TG mice, significant linear relationships between BALs, IL-6 and pSTAT3 levels were observed (Fig. 3b). The relationships showed a predictive value of 29% between BALs and a decrease in IL-6 levels (F(1,18) = 7.74, p = 0.01, R2 = 0.29, Y = 249.9 − 0.941 × X) (Fig. 3b1), 26% between IL-6 levels and an increase in pSTAT3 levels (F(1,18) = 6.43, p = 0.02, R2 = 0.26, Y = 6.60 + 0.016 × X) (Fig. 3b2), and 47% between BALs and a decrease in pSTAT3 levels (F(1,18) = 16.03, p = 0.0008, R2 = 0.47, Y = 12.05—0.038 × X) (Fig. 3b3). The predictive value for BALs and the decrease in IL-6 levels (29%) and for the relationship between IL-6 and pSTAT3 levels (26%) were of similar magnitude, suggesting that the decrease in IL-6 levels was responsible for 26% of the decrease in pSTAT3 levels in the cerebellum of the TG mice. Thus, the higher predictive value of 47% between BALs and the decrease in pSTAT3 levels indicates that the decrease in IL-6 levels (29%) produced by alcohol does not fully explain the decrease in pSTAT3 levels (47%) in the cerebellum of the TG mice, and that other factors/pathways are likely to be involved.
p42/p44 MAPK
IL-6 signal transduction can activate p42/44 MAPK through JAK independent of STAT3 activation (Fig. 1a). Comparison of p42 MAPK and p44 MAPK levels in cerebellum from alcohol-naïve and alcohol-exposed mice across genotypes and treatment groups showed a significant genotypic difference (p42 MAPK, F(1,39) = 8.01, p = 0.007; p44 MAPK, F(1,39) = 5.51, p = 0.02), but no significant treatment effect (p42 MAPK, F(1,39) = 1.12, p = 0.30; p44 MAPK, F(1,39) = 1.22, p = 0.28), or genotype × treatment interaction (p42 MAPK, F(1,39) = 0.87, p = 0.36; p44 MAPK, F(1,39) = 2.71, p = 0.11). Post hoc tests showed that both p42 MAPK and p44 MAPK levels in cerebellum from TG-naïve mice were significantly reduced compared to cerebellum from WT-naive mice (p42 MAPK, p = 0.04; p44 MAPK, p = 0.0007) (Fig. 4a). p42 MAPK and p44 MAPK levels were not significantly altered in cerebellum from both TG-EtOH and WT-EtOH mice compared to their respective TG-naïve and WT-naïve controls (p42 MAPK, p = 0.22; p44 MAPK, p = 0.07) and TG mice (p42 MAPK, p = 0.98; p44 MAPK, p = 0.07) (Fig. 4a).
Fig. 4.

Effects of IL-6 and alcohol on levels of p42/44 MAPK and pp42/44 MAPK in cerebellum of TG and WT mice. a Cerebellum from TG-naïve mice showed reduced p42 and p44 MAPK levels compared to WT-naive mice. There was no effect of alcohol on p42 or p44 MAPK levels in cerebellum of WT-EtOH or TG-EtOH tg mice compared to the respective alcohol-naïve mice of the same genotype. b pp42 and pp44 MAPK levels were increased in cerebellum from TG-naive mice compared to cerebellum from WT-naive mice. There was no effect of alcohol on pp42 or pp44 MAPK levels in cerebellum from WT-EtOH mice, whereas in cerebellum of TG-EtOH mice, p42 and p44 MAPK levels were decreased compared to cerebellum from the naïve group of the same genotype. Representative Western blots are shown above the graphs. #Significantly different from WT of the same treatment group. *Significantly different from naive of the same genotype
pp42/pp44 MAPK
Comparison of levels of pp42 MAPK and pp44 MAPK, the activated forms of p42/44 MAPK, in cerebellum from alcohol-naïve and alcohol-exposed mice across genotypes and treatment groups showed a significant genotypic difference for both pp42 MAPK and pp44 MAPK (pp42 MAPK (F(1,37) = 5.09, p = 0.03; pp44 MAPK, F(1,38) = 25.54, p < 0.0001), a significant treatment effect (pp42 MAPK, F(1,37) = 6.00, p = 0.02; pp44 MAPK, F(1,38) = 7.10, p = 0.01), and a significant genotype × treatment interaction (pp42 MAPK, F(1,37) = 14.38, p = 0.0005; pp44 MAPK, F(1,38) = 6.44, p = 0.02). Post hoc tests showed that levels of pp42 MAPK and pp44 MAPK were significantly higher in cerebellum from TG-naive mice compared to cerebellum from WT-naive mice, consistent with the higher levels of IL-6 in the TG mice (pp42 MAPK p = 0.0002; pp44 MAPK, p < 0.0001) (Fig. 4b). pp42 MAPK and pp44 MAPK levels were not significantly altered in cerebellum from WT-EtOH mice (pp42 MAPK, p = 0.12; pp44 MAPK, (p = 0.78) (Fig. 4b), whereas both pp42 MAPK and pp44 MAPK levels were significantly reduced in cerebellum from TG-EtOH mice (pp42 MAPK, p = 0.005; pp44 MAPK, p = 0.03) compared to their respective controls (Fig. 4b).
Simple regression analysis was used to assess potential relationships between pp42 MAPK or pp44 MAPK and BALs or IL-6 levels in cerebellum from WT mice and TG mice (Fig. 5). This analysis showed a significant linear relationship between BALs and pp42 MAPK levels for cerebellum from both WT (F(1,19) = 12.23, p = 0.002, R2 = 0.39, Y = 0.993 + 0.002 × X) (Fig. 5a1) and TG mice (F(1,17) = 9.91, p = 0.006, R2 = 0.37, Y = 1.80 − 0.006 × X) (Fig. 5b1). The relationship showed a predictive value of about 38% for pp42 MAPK levels as a function of BAL in cerebellum from both genotypes. However, as was found for pSTAT3, in the cerebellum from WT mice, pp42 MAPK levels increased with increasing BALs, whereas in the cerebellum from TG mice, pp42 MAPK decreased with increasing BALs. These results indicate that BALs play an important role in the changes in pp42 MAPK levels in the cerebellum from both WT and TG mice. The significant results for the regression analysis for the WT mice were not consistent with results described above showing no significant increase in pp 42 MAPK levels with alcohol exposure. However, this discrepancy could be explained by variability in the data, as indicated by the larger standard error in the mean values for the pp 42 MAPK levels in the WT-EtOH mice.
Fig. 5.

Regression analysis of data from studies of p42/44 MAPK. a1–a4. Regression analysis of data from WT mice showed a significant predictive increase in pp42 MAPK levels with increasing BALs (a1), but no significant relationship between pp44 MAPK levels and BALs (a3). There was no significant relationship between pp42 MAPK (a2) or pp44 MAPK (a4) levels and IL-6 levels. b1–b4 Regression analysis of data from studies of TG mice showed a significant predictive decrease in pp42 MAPK (b1) and pp44 MAPK (b3) with increasing BALs, but no significant relationship between pp42 MAPK (b2) or pp44 MAPK (b4) with increasing IL-6 levels. *Significant linear relationship
There was no significant linear relationship between IL-6 levels and pp42 MAPK levels for cerebellum from both WT (F(1,19) = 0.19, p = 0.67, R2 = 0.01, Y = 1.1 + 0.001 × X) (Fig. 5a2) and TG mice (F(1,17) = 0.66, p = 0.43, R2 = 0.30, Y = 1.22 + 0.001 × X) (Fig. 5b2). However, the predictive value between IL-6 levels and pp42 MAPK levels for cerebellum from WT mice was 1%, consistent with a lack of involvement of IL-6, whereas in cerebellum from TG mice, the predictive value was 30%. This result suggests that IL-6 influences pp42 MAPK levels in cerebellum from TG mice, but that the relationship between IL-6 and pp42 MAPK levels is complex (i.e., non-linear).
Simple regression analysis of pp44 MAPK and BALs or IL-6 levels also showed no significant linear relationship between BALs and pp44 MAPK levels for cerebellum from WT mice (F(1,21) = 0.57, p = 0.45, R2 = 0.03, Y = 0.95 + 0.001 × X) (Fig. 5a3), but a significant linear relationship between BALs and pp44 MAPK levels for cerebellum from TG mice (F(1,17) = 7.21, p = 0.02, R2 = 0.37, Y = 1.80 − 0.006 × X) (Fig. 5b3). No significant linear relationship was observed between IL-6 and pp44 MAPK levels for cerebellum from both WT (F(1,21) = 0.00, p = 0.99, R2 = 0.01, Y = 1.01 + X) (Fig. 5a4) and TG mice (F(1,17) = 0.60, p = 0.45, R2 = 0.03, Y = 1.96 + 0.002 × X) and the predictive values were low (Fig. 5b4). These results indicate that in the cerebellum from TG mice, BALs play an important role in the changes in pp44 MAPK levels, whereas for both genotypes, IL-6 levels do not appear to be a critical factor.
C/EBP Beta
C/EBP beta, a downstream IL-6 signal transduction partner (Fig. 1a), is a transcription factor that is expressed by both neurons and glia. c/EBP beta regulates the expression of several genes involved in cell differentiation and proliferation (Pulido-Salgado et al. 2015; Kfoury and Kapatos 2009). In cerebellar granule neurons, c/EBP beta is an important positive regulator of metabotropic glutamate receptor 1 (mGluR1) expression (Crepaldi et al. 2007). Comparison of c/EBP beta levels between cerebellum from alcohol-naïve and alcohol-exposed mice across genotypes and treatment groups showed a significant genotypic difference (F(1,29) = 41.71, p < 0.0001), a significant treatment effect (F(1,29) = 8.44, p = 0.007), and a significant genotype × treatment interaction (F(1,29) = 4.14, p = 0.03). Post hoc test showed that c/EBP beta levels in cerebellum from TG-naïve mice were significantly higher than c/EBP beta levels in cerebellum from WT-naïve mice (p < 0.0001) (Fig. 6). c/EBP beta levels in cerebellum of TG-EtOH and WT-EtOH mice were significantly reduced compared to cerebellum of TG-naïve and WT-naïve mice, respectively (TG, p = 0.04; WT, p = 0.003) (Fig. 6). These results indicate that IL-6 levels do not play a role in the depressive effects of alcohol on levels of c/EBP beta in cerebellum from either genotype.
Fig. 6.
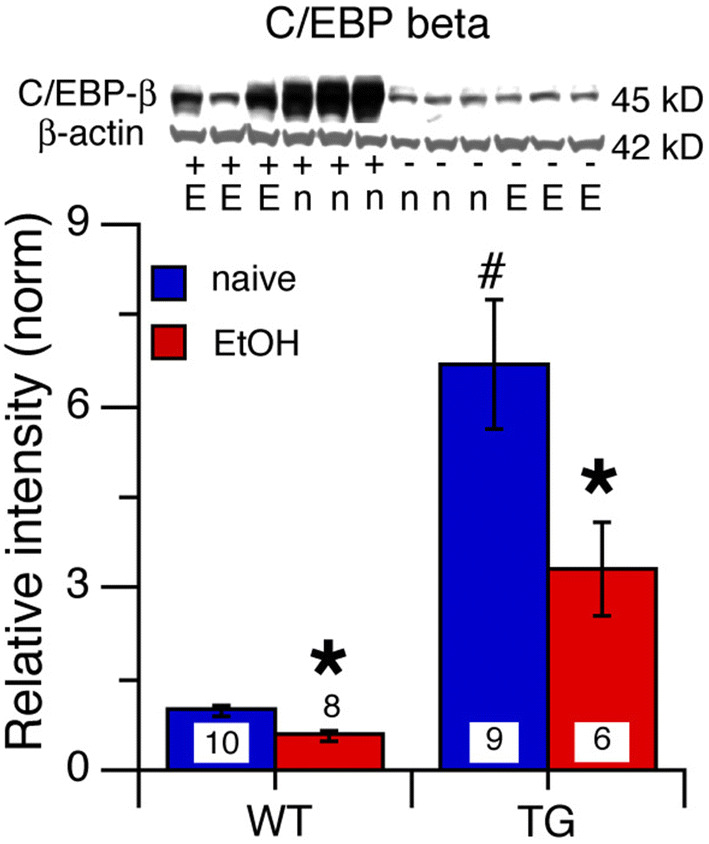
Effects of IL-6 and alcohol on levels of c/EBP beta in cerebellum of TG and WT mice. a c/EBP beta levels in the cerebellum were significantly increased in TG-naive mice relative to WT-naive mice. b c/EBP beta levels in the cerebellum were significantly decreased in both TG-EtOH and WT-EtOH mice relative to levels in the cerebellum from their respective naïve group of the same genotype. Representative Western blots are shown above the graphs. #Significantly different from WT of the same treatment group. *Significantly different from naive of the same genotype
Cell-Specific Protein
GFAP
GFAP, a structural protein expressed by astrocytes (Bergman glia are considered here as a type of astrocyte for simplicity), is a downstream effector of STAT3 signal transduction (O'Callaghan et al. 2014). Comparison of GFAP levels in alcohol-naïve and alcohol-exposed mice across genotypes and treatment groups showed a significant genotype (F(1,13) = 411.31, p < 0.0001), treatment effect (F(1,13) = 9.39, p = 0.009), and genotype × treatment interaction (F(1,13) = 5.60, p = 0.03). Post hoc tests showed that GFAP levels in cerebellum from TG-naive mice were significantly higher than GFAP levels in cerebellum from WT-naive mice (p < 0.0001) (Fig. 7a), consistent with the higher levels of pSTAT3 in cerebellum from TG-naive mice. There was no significant effect of alcohol on GFAP levels in cerebellum from WT-EtOH mice (p = 0.33), whereas in cerebellum from TG-EtOH, alcohol significantly reduced GFAP levels (p = 0.03) (Fig. 7a), consistent with the reduced pSTAT3 levels.
Fig. 7.

Effects of IL-6 and alcohol on levels of cell specific proteins in cerebellum of TG and WT mice. a GFAP levels were significantly increased in cerebellum of alcohol TG-naive mice relative to WT-naive mice. Alcohol had no effect on cerebellum of WT-EtOH mice but significantly reduced GFAP levels in cerebellum of TG-EtOH mice. b Enolase levels were significantly decreased in cerebellum from TG-naive mice compared cerebellum from WT-naive mice. Alcohol significantly decreased enolase levels in cerebellum from WT-EtOH mice but significantly increased enolase levels in cerebellum from TG-EtOH mice relative to the naïve group of the same genotype. Representative Western blots are shown below the graphs. #Significantly different from WT of the same treatment group. *Significantly different from naive of the same genotype
Enolase 2
Enolase 2 (enolase) is a glycolytic enzyme found predominantly in the cytoplasm of neurons and is commonly used to identify neuronal populations. Enolase plays an important role in energy metabolism and is commonly considered a marker of neuronal viability (Solis-Medina et al. 2018). Neuronal damage results in reduced neuronal levels due to leakage of enolase from the cytoplasm (Cunningham et al. 1996).
We examined enolase levels to determine whether IL-6 and/or alcohol negatively impacted (i.e., reduced cell number or expression of enolase) the neuronal population in the cerebellum. Comparison of enolase levels in alcohol-naïve and alcohol-exposed mice across genotypes and treatment groups showed a significant genotypic difference (F(1,38) = 11.00, p = 0.002), no significant treatment effect (F(1,38) = 0.04, p = 0.78), but a significant genotype × treatment interaction (F(1,38) = 12.48, p < 0.0001). Post hoc tests showed that enolase levels in TG-naive mice were significantly lower than in cerebellum from WT-naive mice (p < 0.0001) (Fig. 7b). Alcohol significantly reduced enolase levels in cerebellum from WT-EtOH mice (p = 0.002), while significantly increasing the level of enolase in cerebellum from TG-EtOH mice (p = 0.01) (Fig. 7b). IL-6 is known to have both neurotoxic and neuroprotective actions (Gruol and Nelson 1997), which depend on a number of factors such as IL-6 concentration, duration of exposure, and cell type. The reduction in the level of enolase in the cerebellum of the TG mice may reflect a toxic effect of IL-6, which was relieved by the alcohol-induced reduction in the IL-6 levels, thus enabling increased enolase production. In contrast, in the cerebellum of WT-EtOH mice, which did not show a change in IL-6 levels, the alcohol-induced reduction in enolase could reflect a toxic effect of CIE/withdrawal.
Discussion
Several signal transduction pathways have been shown to be affected by alcohol (Ron and Messing 2013; Aroor and Shukla 2004; Vetreno and Crews 2014), but few studies have investigated the effects of alcohol on the IL-6 signal transduction pathway, especially with respect to the CNS. This issue is important because alcohol consumption induces the production of IL-6 in the CNS, which could alter the expression/activation of important transcription factors that are components of the IL-6 signal transduction pathway (e.g., STAT3, p42/44 MAPK, c/EPB beta). These transcription factors regulate gene expression for proteins involved in a variety of cellular functions and, consequently, their actions could contribute to or alter the effects of alcohol.
In the current studies, we used TG mice that express elevated levels of IL-6 mRNA and protein in the CNS and their WT littermate controls to examine effects of alcohol on the IL-6 signal transduction pathway in the cerebellum, a CNS region that is highly sensitive to alcohol. Two genotypes were studied that represent different experiences relative to IL-6 exposure. The WT-EtOH mice served as a model for short duration alcohol use and limited alcohol-induced IL-6 exposure. The TG-EtOH mice served as a model for long-term alcohol use and long-term alcohol-induced IL-6 exposure. The TG-EtOH and WT-EtOH mice were subjected to a chronic intermittent pattern of alcohol exposure that involved three cycles of alcohol exposure/withdrawal. Results showed that both elevated expression of IL-6 and alcohol (i.e., alcohol exposure/withdrawal) altered activation/expression of IL-6 signal transduction proteins in the cerebellum from the TG-EtOH mice and that interactions occurred between neuroadaptive effects of IL-6 and the effects of alcohol. These interactions indicate that IL-6 and alcohol impact similar downstream targets. Results also reveal a potential role of astrocytes in cerebellar actions of alcohol, as the IL-6 induced neuroadaptive changes in the cerebellum of the TG mice were initiated by elevated expression of IL-6 by astrocytes with altered gene expression of IL-6. The highest gene expression of IL-6 in the CNS of the TG mice occurs in the Bergmann glia of the cerebellum (Campbell et al. 1993; Chiang et al. 1994). Bergman glia are a type of astrocyte that are localized to the molecular layer of the cerebellum and are present at higher numbers than the principal neuron of the cerebellum, the Purkinje neuron (De Zeeuw and Hoogland 2015).
Results from studies on the cerebellum of WT mice implicate IL-6 signal transduction in neurons as a primary target of alcohol, whereas results from cerebellum of IL-6-tg mice implicate IL-6 signal transduction in astrocytes/Bergman glia as a primary target of alcohol. Thus, habitual alcohol use and exposure to alcohol-induced IL-6 expression may influence the cellular targets involved in the effects of alcohol on IL-6 signal transduction. In particular, habitual exposure of astrocytes to alcohol-induced IL-6 expression may alter regulation of gene expression in astrocytes by transcription factors associated with IL-6 signal transduction, and result in altered astrocyte physiology and function, such as regulation of the balance between excitatory and inhibitory synaptic transmission, which is known to be altered by alcohol (Adermark and Bowers 2016).
IL-6 Levels
IL-6 levels were significantly higher in the cerebellum from TG-naive mice than in cerebellum from WT-naive mice, consistent with increased IL-6 production in glial cells of the cerebellum in the TG mice. Surprisingly, there was no apparent effect of alcohol on the level of IL-6 protein in the cerebellum of WT mice, and regression analysis showed no predictive relationship between BAL levels and IL-6 levels. Thus, the effect of alcohol in the cerebellum of WT mice does not appear to involve a long-lasting increase in IL-6 levels that would be evident after withdrawal, at least at the low dose of alcohol used in our studies (BALs ~ 150 mg/dl). However, a transient increase in IL-6 expression during alcohol exposure could have occurred, such as has been reported for the effect of acute alcohol on IL-6 mRNA levels in the cerebellum and other brain regions of wildtype mice (). In these studies of the wildtype mice, an acute high dose of alcohol (4 g/kg, i.p., peak BAL = 400 mg/dl at 3 h) produced a transient increase in IL-6 mRNA which peaked at 9 h post-alcohol (BAL = 200 mg/dl; intoxication stage), declining to baseline levels during the withdrawal period (15–19 h post-alcohol) (Doremus-Fitzwater et al. 2014). Other alcohol exposure protocols have also resulted in a decrease in IL-6 levels (Marshall et al. 2013). Interestingly, in alcohol-dependent subjects, serum levels of IL-6 were significantly increased at the start of alcohol withdrawal and decreased significantly during withdrawal compared to healthy controls (Heberlein et al. 2014). IL-6 serum levels directly correlated with alcohol use as measured by breath alcohol concentration (Heberlein et al. 2014).
In the cerebellum of the TG-EtOH mice, the elevated levels of IL-6 were reduced compared to cerebellum of TG-naïve mice, and regression analysis showed a predictive relationship between BAL levels and the decrease in IL-6. Thus, higher BALs were associated with a reduction in IL-6 levels, a relationship similar to that described for alcohol-induced secretion of IL-6 in cultured astrocytes, where a bell-shaped dose–response relationship between alcohol levels and alcohol-induced IL-6 levels was observed (Sarc et al. 2011). In the studies of cultured astrocytes, chronic alcohol exposure shifted the dose–response relationship to the left such that the stimulatory and inhibitory effects of alcohol on IL-6 production occurred at lower alcohol levels. In these culture studies, the media were changed every 48 h. Thus, the cultured astrocytes were exposed to both alcohol and alcohol-induced IL-6 during the treatment period. Consequently, the increased sensitivity to alcohol could reflect an action of alcohol and/or IL-6. Increased sensitivity could be a factor in our studies of cerebellum from TG-EtOH mice, where alcohol produced a decrease in IL-6 levels. This decrease could reflect an IL-6 induced increase in sensitivity to the inhibitory effects of alcohol on astrocyte production of IL-6, which would be consistent with our hypothesis that elevated levels of IL-6, as occurs with alcohol abuse, can alter the effects of alcohol exposure/withdrawal on cells of the CNS, and in particular, cells expressing IL-6 such as astrocytes/Bergman glia.
In contrast to the decrease in IL-6 levels observed in our studies, in studies by Kane et al. (Kane et al. 2014), wildtype mice chronically treated with a high dose of alcohol (6 g/kg/day) by gavage for 10 days (BALs 290 ± 14 mg/dl on day 10) showed significantly increased IL-6 mRNA levels in the cerebellum 24 h after termination of alcohol exposure (Kane et al. 2014). Because the route and timing of alcohol exposure, alcohol dose, and CNS region all play an important role in alcohol-induced neuroimmune expression (Gano et al. 2016), it is important to note the experimental differences between our studies and the studies of Kane et al. (2014). These differences include the genotype of the mice studied (TG and WT littermate mice vs. wildtype mice), the method of alcohol administration (chronic intermittent alcohol via vapor vs. daily gavage), and the dose of alcohol tested (moderate vs. high). Such differences are known to affect the actions of alcohol and IL-6 and are likely to produce differences in the neuroadaptive changes induced by alcohol, IL-6, and IL-6/alcohol interactions, and thereby contribute to the differences in results. Moreover, the studies differed in the endpoint measured. In our studies, IL-6 protein was measured rather than IL-6 mRNA, as was the case for the studies by Kane et al. (2014). IL-6 mRNA is considerably more stable than IL-6 protein due to the tight regulation IL-6 mRNA expression at multiple levels (e.g., gene transcription, mRNA translation, mRNA degradation) (Nyati et al. 2017). IL-6 protein is known to be labile and difficult to detect in the CNS due to protease action, especially when levels are low, as was the case for the WT-EtOH mice. In a recent study where both IL-6 mRNA and protein levels were measured, IL-6 mRNA and protein levels did not correspond (Gano et al. 2019). Thus, multiple differences between two studies could contribute to the differences in results between these two studies.
A variety of types of alcohol/IL-6 interactions have been described. For example, effects of alcohol on expression of neuroimmune factors, including IL-6, have been shown to be altered by previous behavioral experiences (Doremus-Fitzwater et al. 2018) and alcohol experience (Grifasi et al. 2019; Doremus-Fitzwater et al. 2014). Moreover, alcohol experience can alter IL-6 expression that occurs during some CNS conditions (Chandrasekar et al. 2017; Gano et al. 2017; Neupane et al. 2014). Thus, it is probably not surprising that different models that may reflect different aspects of alcohol/neuroimmune interactions differ in results.
IL-6 Signal Transduction
Activation/expression of three signal transduction/transcription partners utilized by IL-6 were investigated in the current study, STAT3, p42/44 MAPK, and c/EBP beta (Fig. 1a). All were found to be upregulated in cerebellum from TG-naive mice compared to the cerebellum from the WT-naive mice, consistent with persistent activation of the transgene and increased level of IL-6 observed in the cerebellum from TG-naive mice. A significant increase in pSTAT3 and c/EPB beta levels has also been shown for cerebellum from young TG mice (1–2 months of age) (Gruol et al. 2011).
The cerebellum contains a relatively small number of cell types, including neurons and glia. The most populous neurons are the granule neurons, but the largest neurons are the Purkinje neurons. Bergman glial cells, the largest glial cell, astrocytes, and microglia are also present in the cerebellum. Expression of IL-6 receptors and gp130 has been demonstrated in both Purkinje and granule neurons of the cerebellum as well as in glial cells (Nelson et al. 2002; Schobitz et al. 1993; Morikawa et al. 2000; Wang et al. 2007; Molet et al. 2016). Because our studies were based on biochemical assays, the specific cell types involved in the effects of IL-6 and alcohol on IL-6 signal transduction could not be identified. Future immunohistochemical studies will be used to identify cell types involved the effects of alcohol on IL-6 signal transduction partners. However, results suggest that both neurons and glial cells are involved in the effects of IL-6 and/or alcohol.
Results from our studies of cultured cerebellar granule neurons showed that IL-6 exposure could produce alterations in IL-6 signal transduction partners in neurons of the cerebellum. The granule neuron cultures contain primarily granule neurons and little or no glial cells. Chronic treatment with IL-6 (5 ng/ml) significantly increased c/EPB beta and pp42 MAPK levels, indicative of an IL-6 signal transduction pathway in the granule neurons (Gruol et al. 2011). Others have also shown that cultured granule neurons express c/EPB beta (Pena-Altamira et al. 2014), as do cerebellar glial cells (Perez-Capote et al. 2006; Cardinaux et al. 2000). STAT3 activation in granule neurons in cultures treated with IL-6 (5–10 ng/ml) has also been demonstrated (Wang et al. 2007). However, pSTAT3 was reported to be primarily expressed in astrocytes and particularly Bergman glia in cerebellum from the TG mice (Sanz et al. 2008; Campbell et al. 2014). Differences in the cell types expressing pSTAT3 between the cerebellum from the TG mice and cultured granule neurons could be related to differences in ambient IL-6 levels. IL-6 levels were in the pg/ml range in the CNS of the TG mice (Fig. 1b), whereas IL-6 levels in the ng/ml range are commonly used in experiments with cultured cells (Gruol and Nelson 1997). Thus, higher levels of IL-6 may be required for IL-6 activation of signal transduction in neurons. IL-6 levels in the cerebellum of TG-naive mice are considerably lower than IL-6 levels used for studies of cultured granule neurons. IL-6 levels in cerebellum from WT-naive mice are considerably lower than for the cerebellum in the TG mice (Fig. 1b).
pSTAT3
pSTAT3 levels were increased in cerebellum from the WT-EtOH mice compared to levels in cerebellum from WT-naïve mice, a change that occurred without a change in GFAP levels (Fig. 2). Because pSTAT3 regulates expression of GFAP (Lee et al. 2009; Sanz et al. 2008), this result suggests that astrocytes/Bergman glia were not involved in the alcohol-induced increase in pSTAT3 in the cerebellum from the WT-EtOH mice. Thus, the increased pSTAT3 levels could have occurred in neurons, which do not express GFAP. Both cerebellar granule neurons and Purkinje neurons express STAT3 (Stromberg et al. 2000). Levels of enolase, a neuronal protein, were also reduced in cerebellum from the WT-EtOH mice, consistent with an involvement of neurons in the effects of alcohol in our studies (+ 1).
Regression analysis indicated no predictive relationship between IL-6 levels and pSTAT3 levels in cerebellum from the WT mice, but there was a predictive relationship between BALs and pSTAT3 levels. These results suggest that alcohol activated STAT3 through a pathway that did not involve IL-6 in the cerebellum of WT-EtOH mice. For example, alcohol could activate another pathway that uses STAT3 or directly activate STAT3. Little is known about the effects of alcohol on STAT3 activation in neurons or glia. However, in human monocytes, acute alcohol was shown to directly phosphorylate STAT3 at the tyr705 residue (the site examined in this study) and this action of alcohol prevented IL-6 activation of STAT3 (Norkina et al. 2007, 2008). Thus, the increase in pSTAT3 levels in the cerebellum from WT-EtOH mice could reflect a direct alcohol-induced activation of STAT3 in cerebellar neurons.
In the cerebellum of TG-EtOH mice, alcohol exposure resulted in a decrease in the levels of pSTAT3, pp42/44 MAPK, c/EBP beta, and GFAP. In contrast, an increased in the level of the neuronal protein enolase was observed. Studies by others using immunostaining have shown that pSTAT3 expression in the cerebellum of the TG mice primarily reflects STAT3 activation in glial (astrocytes, Bergman glia, microglia) and endothelial cells (Sanz et al. 2008). Thus, in our studies the decrease in pSTAT3 expression produced by alcohol is likely to involve astrocytes/Bergman glia, consistent with the simultaneous decrease in GFAP, a protein expressed in astrocyte/Bergman glia. GFAP expression is regulated by pSTAT3 (Lee et al. 2009; Sanz et al. 2008). These results are consistent with IL-6 signaling in glial as a primary target of alcohol in the cerebellum of the TG mice.
The reduced level of IL-6 in the cerebellum of TG-EtOH mice is likely to be an important factor in the alcohol-induced decrease in pSTAT3, pp42/44 MAPK, c/EBP beta, and GFAP expression. In previously studies of the hippocampus we also found a decrease in pSTAT3 in the TG-EtOH mice (Gruol et al. 2018). IL-6 levels were not measured in the hippocampus but a decrease could also underlie the decrease in pSTAT3 levels in that brain region. However, the alcohol-induced decrease in pSTAT3 expression could also have involved other mechanisms. Although there is limited information on alcohol effects of IL-6 signal transduction in the CNS, alcohol has been reported to block phosphorylation of JAK or STAT3 in other cell types. For example, alcohol blocked prolactin tyrosine phosphorylation of the JAK/STAT pathway in cultured astrocytes through an action at JAK2 (DeVito and Stone 1999). In hepatocytes, alcohol blocked IL-6 phosphorylation of STAT3 by direct action at STAT3 without affecting basal levels of STAT3 (Chen et al. 1999). Alcohol also blocked IL-6 phosphorylation of STAT3 in human monocytes (Norkina et al. 2008). In cultured human hepatoma cells, alcohol dose-dependently inhibited leptin-induced STAT3 phosphorylation but not leptin-induced JAK phosphorylation (Degawa-Yamauchi et al. 2002). A similar block of IL-6 phosphorylation of STAT3 by alcohol could have played a role in our results.
Regression analysis indicated that the decrease in IL-6 levels predicted a 26% decrease in pSTAT3 levels in the cerebellum of TG mice, whereas regression analysis indicated a predictive value of 47% between BALs and the decrease in pSTAT3 levels. Thus, in addition to a reduction in IL-6 levels, an action of alcohol to prevent IL-6 induced phosphorylation of JAK2 or STAT3 could contribute to the reduction in pSTAT3 levels produced by CIE/withdrawal in cerebellum from TG mice.
pp42/44 MAPK
Alcohol had no effect on pp42/44 MAPK levels in the cerebellum from WT-EtOH mice, results consistent with the low cerebellar levels of IL-6 in the WT-EtOH mice after alcohol exposure. However, regression analysis showed a predictive significant relationship between an increase in pp42MAPK levels and BAL levels in the cerebellum from WT-EtOH mice. Chronic alcohol exposure (BALs ~ 200 mg/dl) has been reported to decrease levels of pp42/44 MAPK in the cerebellum of rats, with a transient increase during withdrawal (7 h post-alcohol) and return to baseline by 24 h (Sanna et al. 2002). Thus, pp42/44 MAPK levels in cerebellum from CIE/withdrawn WT-EtOH mice 24 h after the termination of alcohol exposure are consistent with the studies in rat cerebellum at a similar time point (Sanna et al. 2002), although it is unknown if a transient increase occurred at an earlier timepoint as was reported for rats.
pp42/44 MAPK levels were increased in cerebellum from TG-naive mice compared to alcohol WT-naive mice, consistent with the upregulation of IL-6 expression and IL-6 signal transduction (Fig. 1a). Alcohol reduced pp42/44 MAPK levels in the cerebellum of the TG-EtOH mice, which could reflect the reduced levels of IL-6, and consequently, a down regulation of the JAK-p42/44 MAPK pathway. A prolongation of the depressive effects of alcohol on pp42/44 MAPK levels could also be involved. Results from our previous studies of EEG activity during withdrawal in the TG mice also raised the possibility of a prolongation of the effects of alcohol on EEG activity (Gruol et al. 2018).
c/EBP Beta
IL-6 regulation of c/EBP beta is linked to the JAK/p42/44 MAPK leg of the IL-6 signal transduction pathway (Fig. 1a). Alcohol reduced c/EBP beta levels in cerebellum from both TG-EtOH and WT-EtOH mice. However, unlike results in the cerebellum of TG-EtOH mice, the decrease in c/EBP beta levels in the cerebellum of WT-EtOH mice occurred without a similar change in the levels of glial protein GFAP or the upstream activator pp42/44 MAPK. Thus, neuronal c/EBP beta could be involved in the depressive effects of alcohol in the cerebellum of WT-EtOH mice. Studies of cultured cerebellar granule neurons indicate that neuronal apoptosis is associated with a decrease in c/EBP beta, whereas overexpression of c/EBP beta overcomes the induction of apoptosis (Pena-Altamira et al. 2014). Thus, c/EBP beta production in the granule neurons is protective, and a reduction in c/EBP beta levels is detrimental. The reduction of c/EBP beta levels in the cerebellum of CIE/withdrawn WT-EtOH mice could reflect a detrimental effect alcohol on neurons, which could also explain the alcohol-induced decrease in enolase levels observed in the cerebellum of WT-EtOH mice (Table 1). Neuronal damage results in reduced neuronal levels of enolase due to leakage of enolase from the cytoplasm (Cunningham et al. 1996).
Alcohol reduced levels of c/EBP beta in the cerebellum of TG-EtOH mice, whereas levels of enolase were increased and GFAP levels were decreased. This difference may reflect a glial involvement in the effects of alcohol on c/EBP beta levels in the cerebellum of TG mice. Increased expression of c/EBP beta in glial cells, and particularly microglia, is thought to play a role in the neurotoxic actions of glia (Straccia et al. 2011). Microglia are considered to be an important player in the neurotoxic effects of alcohol (Henriques et al. 2018). Thus, reduced expression of c/EBP beta in glial cells of the cerebellum of TG-EtOH mice could have a positive effect on the cerebellar neurons and contribute to the increased levels of enolase in the cerebellum of these mice. Other mechanisms could also be contributing factors to the depressive effects of alcohol on c/EBP levels. For example, alcohol may have directly acted at c/EBP beta or act through other alcohol-sensitive signaling pathways that partner with c/EBP beta (e.g., BDNF activation of c/EPB beta) (Calella et al. 2007; Logrip et al. 2015; Kumar et al. 2013).
Conclusion
Relatively little is known about the effects of alcohol on IL-6 signal transduction in the CNS. Our studies show that there are multiple targets for alcohol on IL-6 signal transduction in the cerebellum and that these targets differ for cerebellum from TG and WT mice. Many IL-6 targets were also targets of alcohol, thus providing potential sites for interactions as a consequence of alcohol-induced IL-6 production and the resulting neuroadaptive changes. Such interactions could have important consequences relative to the effects of alcohol on behaviors mediated by the cerebellum including those in downstream circuits of other CNS regions that are connected to and influenced by cerebellar function. Although the current studies did not examine the cell type where the levels of signal transduction components were altered by IL-6 and/or alcohol, results suggest that both glial and neuronal IL-6 signal transduction pathways are affected by alcohol. A number of transcription factors involved in the IL-6 signal transduction pathway were affected by alcohol, and these factors regulate gene expression for a number of important cellular proteins. Thus, alcohol-induced IL-6 production could have widespread effects on CNS function.
Acknowledgements
We thank Jasmin Sisouvanthong, Yvette Tan, and Kristine Ly for performing some of the Western blots.
Author Contributions
DLG and AJR conceived of the project and designed the experiments. CM and SHR performed the research. DLG analyzed and interpreted the data with support from AJR, CM, and SHR. All authors contributed to manuscript preparation and approved the final version.
Funding
This work was supported by National Institutes of Health Grants AA024484 and the Integrated Neuroscience Initiative on Alcoholism (INIA)-West grant AA020893, and The Scripps Research Institute’s Mouse Behavioral Assessment Core.
Compliance with Ethical Standards
Conflict of interest
The authors have no conflict of interest to declare.
Informed Consent:
N/A.
Research Involving Human and Animal Rights
This research does not involve human subjects. All animal procedures were performed in accordance with the National Institutes of Health Guideline for the Care and Use of Laboratory Animals. Animal facilities and experimental protocols were in accordance with the Association for the Assessment and Accreditation of Laboratory Animal Care.
Footnotes
Publisher's Note
Springer Nature remains neutral with regard to jurisdictional claims in published maps and institutional affiliations.
References
- Adermark L, Bowers MS (2016) Disentangling the role of astrocytes in alcohol use disorder. Alcohol Clin Exp Res 40(9):1802–1816. 10.1111/acer.13168 [DOI] [PMC free article] [PubMed] [Google Scholar]
- Alfonso-Loeches S, Guerri C (2011) Molecular and behavioral aspects of the actions of alcohol on the adult and developing brain. Crit Rev Clin Lab Sci 48(1):19–47. 10.3109/10408363.2011.580567 [DOI] [PubMed] [Google Scholar]
- Alfonso-Loeches S, Pascual-Lucas M, Blanco AM, Sanchez-Vera I, Guerri C (2010) Pivotal role of TLR4 receptors in alcohol-induced neuroinflammation and brain damage. J Neurosci 30(24):8285–8295. 10.1523/jneurosci.0976-10.2010 [DOI] [PMC free article] [PubMed] [Google Scholar]
- Aroor AR, Shukla SD (2004) MAP kinase signaling in diverse effects of ethanol. Life Sci 74(19):2339–2364. 10.1016/j.lfs.2003.11.001 [DOI] [PubMed] [Google Scholar]
- Baxter-Potter LN, Henricks AM, Berger AL, Bieniasz KV, Lugo JM, McLaughlin RJ (2017) Alcohol vapor exposure differentially impacts mesocorticolimbic cytokine expression in a sex-, region-, and duration-specific manner. Neuroscience 346:238–246. 10.1016/j.neuroscience.2017.01.015 [DOI] [PubMed] [Google Scholar]
- Becker HC, Lopez MF (2004) Increased ethanol drinking after repeated chronic ethanol exposure and withdrawal experience in C57BL/6 mice. Alcohol Clin Exp Res 28(12):1829–1838 [DOI] [PubMed] [Google Scholar]
- Bhave SV, Snell LD, Tabakoff B, Hoffman PL (1999) Ethanol sensitivity of NMDA receptor function in developing cerebellar granule neurons. Eur J Pharmacol 369(2):247–259 [DOI] [PubMed] [Google Scholar]
- Boyadjieva NI, Sarkar DK (2010) Role of microglia in ethanol's apoptotic action on hypothalamic neuronal cells in primary cultures. Alcohol Clin Exp Res 34(11):1835–1842. 10.1111/j.1530-0277.2010.01271.x [DOI] [PMC free article] [PubMed] [Google Scholar]
- Brett FM, Mizisin AP, Powell HC, Campbell IL (1995) Evolution of neuropathologic abnormalities associated with blood-brain barrier breakdown in transgenic mice expressing interleukin-6 in astrocytes. J Neuropathol Exp Neurol 54(6):766–775 [DOI] [PubMed] [Google Scholar]
- Calella AM, Nerlov C, Lopez RG, Sciarretta C, von Bohlen und Halbach O, Bereshchenko O, Minichiello L (2007) Neurotrophin/Trk receptor signaling mediates C/EBPalpha, -beta and NeuroD recruitment to immediate-early gene promoters in neuronal cells and requires C/EBPs to induce immediate-early gene transcription. Neural Dev 2:4. 10.1186/1749-8104-2-4 [DOI] [PMC free article] [PubMed] [Google Scholar]
- Campbell IL, Abraham CR, Masliah E, Kemper P, Inglis JD, Oldstone MB, Mucke L (1993) Neurologic disease induced in transgenic mice by cerebral overexpression of interleukin 6. Proc Natl Acad Sci U S A 90(21):10061–10065 [DOI] [PMC free article] [PubMed] [Google Scholar]
- Campbell IL, Erta M, Lim SL, Frausto R, May U, Rose-John S, Scheller J, Hidalgo J (2014) Trans-signaling is a dominant mechanism for the pathogenic actions of interleukin-6 in the brain. J Neurosci 34(7):2503–2513. 10.1523/JNEUROSCI.2830-13.2014 [DOI] [PMC free article] [PubMed] [Google Scholar]
- Cardinaux JR, Allaman I, Magistretti PJ (2000) Pro-inflammatory cytokines induce the transcription factors C/EBPbeta and C/EBPdelta in astrocytes. Glia 29(1):91–97 [PubMed] [Google Scholar]
- Carta I, Chen CH, Schott A, Dorizan S, Khodakhah K (2019) Cerebellar modulation of the reward circuitry and social behavior. Science 363(6424):eaav0581 [DOI] [PMC free article] [PubMed] [Google Scholar]
- Carta M, Mameli M, Valenzuela CF (2006) Alcohol potently modulates climbing fiber→Purkinje neuron synapses: role of metabotropic glutamate receptors. J Neurosci 26(7):1906–1912. 10.1523/jneurosci.4430-05.2006 [DOI] [PMC free article] [PubMed] [Google Scholar]
- Ceyzeriat K, Abjean L, Carrillo-de Sauvage MA, Ben Haim L, Escartin C (2016) The complex STATes of astrocyte reactivity: how are they controlled by the JAK-STAT3 pathway? Neuroscience 330:205–218. 10.1016/j.neuroscience.2016.05.043 [DOI] [PubMed] [Google Scholar]
- Chandrasekar A, Heuvel FO, Palmer A, Linkus B, Ludolph AC, Boeckers TM, Relja B, Huber-Lang M, Roselli F (2017) Acute ethanol administration results in a protective cytokine and neuroinflammatory profile in traumatic brain injury. Int Immunopharmacol 51:66–75. 10.1016/j.intimp.2017.08.002 [DOI] [PubMed] [Google Scholar]
- Chen J, Kunos G, Gao B (1999) Ethanol rapidly inhibits IL-6-activated STAT3 and C/EBP mRNA expression in freshly isolated rat hepatocytes. FEBS Lett 457(1):162–168 [DOI] [PubMed] [Google Scholar]
- Chiang CS, Stalder A, Samimi A, Campbell IL (1994) Reactive gliosis as a consequence of interleukin-6 expression in the brain: studies in transgenic mice. Dev Neurosci 16(3–4):212–221 [DOI] [PubMed] [Google Scholar]
- Crepaldi L, Lackner C, Corti C, Ferraguti F (2007) Transcriptional activators and repressors for the neuron-specific expression of a metabotropic glutamate receptor. J Biol Chem 282(24):17877–17889. 10.1074/jbc.M700149200 [DOI] [PubMed] [Google Scholar]
- Crews FT, Lawrimore CJ, Walter TJ, Coleman LG Jr (2017) The role of neuroimmune signaling in alcoholism. Neuropharmacology 122:56–73. 10.1016/j.neuropharm.2017.01.031 [DOI] [PMC free article] [PubMed] [Google Scholar]
- Cunningham RT, Watt M, Winder J, McKinstry S, Lawson JT, Johnston CF, Hawkins SA, Buchanan KD (1996) Serum neurone-specific enolase as an indicator of stroke volume. Eur J Clin Invest 26(4):298–303. 10.1046/j.1365-2362.1996.129282.x [DOI] [PubMed] [Google Scholar]
- Dar MS (2015) Ethanol-induced cerebellar ataxia: cellular and molecular mechanisms. Cerebellum (London, England) 14(4):447–465. 10.1007/s12311-014-0638-4 [DOI] [PubMed] [Google Scholar]
- De Zeeuw CI, Hoogland TM (2015) Reappraisal of Bergmann glial cells as modulators of cerebellar circuit function. Front Cell Neurosci 9:246. 10.3389/fncel.2015.00246 [DOI] [PMC free article] [PubMed] [Google Scholar]
- Degawa-Yamauchi M, Uotani S, Yamaguchi Y, Takahashi R, Abe T, Kuwahara H, Yamasaki H, Eguchi K (2002) Ethanol inhibits leptin-induced STAT3 activation in Huh7 cells. FEBS Lett 525(1–3):116–120 [DOI] [PubMed] [Google Scholar]
- DeVito WJ, Stone S (1999) Ethanol inhibits prolactin-induced activation of the JAK/STAT pathway in cultured astrocytes. J Cell Biochem 74(2):278–291 [PubMed] [Google Scholar]
- Doremus-Fitzwater TL, Buck HM, Bordner K, Richey L, Jones ME, Deak T (2014) Intoxication- and withdrawal-dependent expression of central and peripheral cytokines following initial ethanol exposure. Alcohol Clin Exp Res 38(8):2186–2198. 10.1111/acer.12481 [DOI] [PMC free article] [PubMed] [Google Scholar]
- Doremus-Fitzwater TL, Gano A, Paniccia JE, Deak T (2015) Male adolescent rats display blunted cytokine responses in the CNS after acute ethanol or lipopolysaccharide exposure. Physiol Behav 148:131–144. 10.1016/j.physbeh.2015.02.032 [DOI] [PMC free article] [PubMed] [Google Scholar]
- Doremus-Fitzwater TL, Paniccia JE, Gano A, Vore AS, Deak T (2018) Differential effects of acute versus chronic stress on ethanol sensitivity: Evidence for interactions on both behavioral and neuroimmune outcomes. Brain Behav Immun 70:141–156. 10.1016/j.bbi.2018.02.009 [DOI] [PMC free article] [PubMed] [Google Scholar]
- Fitzpatrick LE, Crowe SF (2013) Cognitive and emotional deficits in chronic alcoholics: a role for the cerebellum? Cerebellum (London, England) 12(4):520–533. 10.1007/s12311-013-0461-3 [DOI] [PubMed] [Google Scholar]
- Gano A, Doremus-Fitzwater TL, Deak T (2016) Sustained alterations in neuroimmune gene expression after daily, but not intermittent, alcohol exposure. Brain Res 1646:62–72. 10.1016/j.brainres.2016.05.027 [DOI] [PMC free article] [PubMed] [Google Scholar]
- Gano A, Mondello JE, Doremus-Fitzwater TL, Deak T (2019) Rapid alterations in neuroimmune gene expression after acute ethanol: timecourse, sex differences and sensitivity to cranial surgery. J Neuroimmunol 337:577083. 10.1016/j.jneuroim.2019.577083 [DOI] [PMC free article] [PubMed] [Google Scholar]
- Gano A, Pautassi RM, Doremus-Fitzwater TL, Deak T (2017) Conditioned effects of ethanol on the immune system. Exp Biol Med (Maywood) 242(7):718–730. 10.1177/1535370217694097 [DOI] [PMC free article] [PubMed] [Google Scholar]
- Giralt M, Ramos R, Quintana A, Ferrer B, Erta M, Castro-Freire M, Comes G, Sanz E, Unzeta M, Pifarre P, Garcia A, Campbell IL, Hidalgo J (2013) Induction of atypical EAE mediated by transgenic production of IL-6 in astrocytes in the absence of systemic IL-6. Glia 61(4):587–600. 10.1002/glia.22457 [DOI] [PubMed] [Google Scholar]
- Grifasi IR, McIntosh SE, Thomas RD, Lysle DT, Thiele TE, Marshall SA (2019) Characterization of the hippocampal neuroimmune response to binge-like ethanol consumption in the drinking in the dark model. NeuroImmunoModulation 26(1):19–32. 10.1159/000495210 [DOI] [PMC free article] [PubMed] [Google Scholar]
- Griffin WC 3rd, Lopez MF, Becker HC (2009) Intensity and duration of chronic ethanol exposure is critical for subsequent escalation of voluntary ethanol drinking in mice. Alcohol Clin Exp Res 33(11):1893–1900. 10.1111/j.1530-0277.2009.01027.x [DOI] [PMC free article] [PubMed] [Google Scholar]
- Gruol DL (2013) Neuroimmune regulation of neurophysiology in the cerebellum. Cerebellum (London, England) 12(3):307–309. 10.1007/s12311-012-0445-8 [DOI] [PMC free article] [PubMed] [Google Scholar]
- Gruol DL, Huitron-Resendiz S, Roberts AJ (2018) Altered brain activity during withdrawal from chronic alcohol is associated with changes in IL-6 signal transduction and GABAergic mechanisms in transgenic mice with increased astrocyte expression of IL-6. Neuropharmacology 138:32–46. 10.1016/j.neuropharm.2018.05.024 [DOI] [PMC free article] [PubMed] [Google Scholar]
- Gruol DL, Nelson TE (1997) Physiological and pathological roles of interleukin-6 in the central nervous system. Mol Neurobiol 15(3):307–339. 10.1007/bf02740665 [DOI] [PubMed] [Google Scholar]
- Gruol DL, Nelson TE (2005) Purkinje neuron physiology is altered by the inflammatory factor interleukin-6. Cerebellum (London, England) 4(3):198–205. 10.1080/14734220500199987 [DOI] [PubMed] [Google Scholar]
- Gruol DL, Parsons KL (1996) Chronic alcohol reduces calcium signaling elicited by glutamate receptor stimulation in developing cerebellar neurons. Brain Res 728(2):166–174 [DOI] [PubMed] [Google Scholar]
- Gruol DL, Parsons KL, DiJulio N (1997) Acute ethanol alters calcium signals elicited by glutamate receptor agonists and K+ depolarization in cultured cerebellar Purkinje neurons. Brain Res 773(1–2):82–89 [DOI] [PubMed] [Google Scholar]
- Gruol DL, Puro A, Hao C, Blakely P, Janneke E, Vo K (2011) Neuroadaptive changes in cerebellar neurons induced by chronic exposure to IL-6. J Neuroimmunol 239(1–2):28–36. 10.1016/j.jneuroim.2011.08.009 [DOI] [PMC free article] [PubMed] [Google Scholar]
- Gruol DL, Vo K, Bray JG (2014) Increased astrocyte expression of IL-6 or CCL2 in transgenic mice alters levels of hippocampal and cerebellar proteins. Front Cell Neurosci 8:234. 10.3389/fncel.2014.00234 [DOI] [PMC free article] [PubMed] [Google Scholar]
- Gyengesi E, Rangel A, Ullah F, Liang H, Niedermayer G, Asgarov R, Venigalla M, Gunawardena D, Karl T, Munch G (2019) Chronic microglial activation in the GFAP-IL6 mouse contributes to age-dependent cerebellar volume loss and impairment in motor function. Front Neurosci 13:303. 10.3389/fnins.2019.00303 [DOI] [PMC free article] [PubMed] [Google Scholar]
- Ha BK, King JS (2000) Localization of gp130 in the developing and adult mouse cerebellum. J Chem Neuroanat 19(3):129–141 [DOI] [PubMed] [Google Scholar]
- Heberlein A, Kaser M, Lichtinghagen R, Rhein M, Lenz B, Kornhuber J, Bleich S, Hillemacher T (2014) TNF-alpha and IL-6 serum levels: neurobiological markers of alcohol consumption in alcohol-dependent patients? Alcohol 48(7):671–676. 10.1016/j.alcohol.2014.08.003 [DOI] [PubMed] [Google Scholar]
- Henriques JF, Portugal CC, Canedo T, Relvas JB, Summavielle T, Socodato R (2018) Microglia and alcohol meet at the crossroads: microglia as critical modulators of alcohol neurotoxicity. Toxicol Lett 283:21–31. 10.1016/j.toxlet.2017.11.002 [DOI] [PubMed] [Google Scholar]
- Heyser CJ, Masliah E, Samimi A, Campbell IL, Gold LH (1997) Progressive decline in avoidance learning paralleled by inflammatory neurodegeneration in transgenic mice expressing interleukin 6 in the brain. Proc Natl Acad Sci U S A 94(4):1500–1505 [DOI] [PMC free article] [PubMed] [Google Scholar]
- Holliday J, Parsons K, Curry J, Lee SY, Gruol DL (1995) Cerebellar granule neurons develop elevated calcium responses when treated with interleukin-6 in culture. Brain Res 673(1):141–148 [DOI] [PubMed] [Google Scholar]
- Kane CJ, Phelan KD, Douglas JC, Wagoner G, Johnson JW, Xu J, Drew PD (2013) Effects of ethanol on immune response in the brain: region-specific changes in aged mice. J Neuroinflammation 10:66. 10.1186/1742-2094-10-66 [DOI] [PMC free article] [PubMed] [Google Scholar]
- Kane CJ, Phelan KD, Douglas JC, Wagoner G, Johnson JW, Xu J, Phelan PS, Drew PD (2014) Effects of ethanol on immune response in the brain: region-specific changes in adolescent versus adult mice. Alcohol Clin Exp Res 38(2):384–391. 10.1111/acer.12244 [DOI] [PMC free article] [PubMed] [Google Scholar]
- Kfoury N, Kapatos G (2009) Identification of neuronal target genes for CCAAT/enhancer binding proteins. Mol Cell Neurosci 40(3):313–327. 10.1016/j.mcn.2008.11.004 [DOI] [PMC free article] [PubMed] [Google Scholar]
- Kumar A, LaVoie HA, DiPette DJ, Singh US (2013) Ethanol neurotoxicity in the developing cerebellum: underlying mechanisms and implications. Brain Sci 3(2):941–963. 10.3390/brainsci3020941 [DOI] [PMC free article] [PubMed] [Google Scholar]
- Lee HK, Seo IA, Suh DJ, Hong JI, Yoo YH, Park HT (2009) Interleukin-6 is required for the early induction of glial fibrillary acidic protein in Schwann cells during Wallerian degeneration. J Neurochem 108(3):776–786. 10.1111/j.1471-4159.2008.05826.x [DOI] [PubMed] [Google Scholar]
- Lippai D, Bala S, Csak T, Kurt-Jones EA, Szabo G (2013) Chronic alcohol-induced microRNA-155 contributes to neuroinflammation in a TLR4-dependent manner in mice. PLoS ONE 8(8):e70945. 10.1371/journal.pone.0070945 [DOI] [PMC free article] [PubMed] [Google Scholar]
- Logrip ML, Barak S, Warnault V, Ron D (2015) Corticostriatal BDNF and alcohol addiction. Brain Res 1628(Pt A):60–67. 10.1016/j.brainres.2015.03.025 [DOI] [PMC free article] [PubMed] [Google Scholar]
- Lopez MF, Becker HC (2014) Operant ethanol self-administration in ethanol dependent mice. Alcohol 48(3):295–299. 10.1016/j.alcohol.2014.02.002 [DOI] [PMC free article] [PubMed] [Google Scholar]
- Luo J (2015) Effects of ethanol on the cerebellum: advances and prospects. Cerebellum (London, England) 14(4):383–385. 10.1007/s12311-015-0674-8 [DOI] [PMC free article] [PubMed] [Google Scholar]
- Ma SH, Li B, Huang HW, Peng YP, Qiu YH (2012) Interleukin-6 inhibits L-type calcium channel activity of cultured cerebellar granule neurons. J Physiol Sci 62(5):385–392. 10.1007/s12576-012-0215-x [DOI] [PMC free article] [PubMed] [Google Scholar]
- Marshall SA, McClain JA, Kelso ML, Hopkins DM, Pauly JR, Nixon K (2013) Microglial activation is not equivalent to neuroinflammation in alcohol-induced neurodegeneration: the importance of microglia phenotype. Neurobiol Dis 54:239–251. 10.1016/j.nbd.2012.12.016 [DOI] [PMC free article] [PubMed] [Google Scholar]
- Miguel-Hidalgo JJ (2018) Molecular Neuropathology of Astrocytes and Oligodendrocytes in Alcohol Use Disorders. Front Mol Neurosci 11:78. 10.3389/fnmol.2018.00078 [DOI] [PMC free article] [PubMed] [Google Scholar]
- Molet J, Mauborgne A, Diallo M, Armand V, Geny D, Villanueva L, Boucher Y, Pohl M (2016) Microglial Janus kinase/signal transduction and activator of transcription 3 pathway activity directly impacts astrocyte and spinal neuron characteristics. J Neurochem 136(1):133–147. 10.1111/jnc.13375 [DOI] [PubMed] [Google Scholar]
- Morikawa Y, Tohya K, Tamura S, Ichihara M, Miyajima A, Senba E (2000) Expression of interleukin-6 receptor, leukemia inhibitory factor receptor and glycoprotein 130 in the murine cerebellum and neuropathological effect of leukemia inhibitory factor on cerebellar Purkinje cells. Neuroscience 100(4):841–848 [DOI] [PubMed] [Google Scholar]
- Murata S, Usuda N, Okano A, Kobayashi S, Suzuki T (2000) Occurrence of a transcription factor, signal transducer and activators of transcription 3 (Stat3), in the postsynaptic density of the rat brain. Brain Res Mol Brain Res 78(1–2):80–90 [DOI] [PubMed] [Google Scholar]
- Nelson TE, Campbell IL, Gruol DL (1999) Altered physiology of Purkinje neurons in cerebellar slices from transgenic mice with chronic central nervous system expression of interleukin-6. Neuroscience 89(1):127–136 [DOI] [PubMed] [Google Scholar]
- Nelson TE, Ur CL, Gruol DL (2002) Chronic interleukin-6 exposure alters electrophysiological properties and calcium signaling in developing cerebellar Purkinje neurons in culture. J Neurophysiol 88(1):475–486 [DOI] [PubMed] [Google Scholar]
- Nelson TE, Netzeband JG, Gruol DL (2004) Chronic interleukin-6 exposure alters metabotropic glutamate receptor-activated calcium signalling in cerebellar Purkinje neurons. Eur J Neurosci 20(9):2387–2400. 10.1111/j.1460-9568.2004.03706.x [DOI] [PubMed] [Google Scholar]
- Nelson TE, Olde Engberink A, Hernandez R, Puro A, Huitron-Resendiz S, Hao C, De Graan PN, Gruol DL (2012) Altered synaptic transmission in the hippocampus of transgenic mice with enhanced central nervous systems expression of interleukin-6. Brain Behav Immun 26(6):959–971. 10.1016/j.bbi.2012.05.005 [DOI] [PMC free article] [PubMed] [Google Scholar]
- Netzeband JG, Schneeloch JR, Trotter C, Caguioa-Aquino JN, Gruol DL (2002) Chronic ethanol treatment and withdrawal alter ACPD-evoked calcium signals in developing Purkinje neurons. Alcohol Clin Exp Res 26(3):386–393 [PubMed] [Google Scholar]
- Netzeband JG, Trotter C, Caguioa JN, Gruol DL (1999) Chronic ethanol exposure enhances AMPA-elicited Ca2+ signals in the somatic and dendritic regions of cerebellar Purkinje neurons. Neurochem Int 35(2):163–174 [DOI] [PubMed] [Google Scholar]
- Neupane SP, Lien L, Martinez P, Aukrust P, Ueland T, Mollnes TE, Hestad K, Bramness JG (2014) High frequency and intensity of drinking may attenuate increased inflammatory cytokine levels of major depression in alcohol-use disorders. CNS Neurosci Ther 20(10):898–904. 10.1111/cns.12303 [DOI] [PMC free article] [PubMed] [Google Scholar]
- Nicolaou C, Chatzipanagiotou S, Tzivos D, Tzavellas EO, Boufidou F, Liappas IA (2004) Serum cytokine concentrations in alcohol-dependent individuals without liver disease. Alcohol 32(3):243–247. 10.1016/j.alcohol.2004.02.004 [DOI] [PubMed] [Google Scholar]
- Nicolas CS, Amici M, Bortolotto ZA, Doherty A, Csaba Z, Fafouri A, Dournaud P, Gressens P, Collingridge GL, Peineau S (2013) The role of JAK-STAT signaling within the CNS. JAK-STAT 2(1):e22925. 10.4161/jkst.22925 [DOI] [PMC free article] [PubMed] [Google Scholar]
- Norkina O, Dolganiuc A, Catalano D, Kodys K, Mandrekar P, Syed A, Efros M, Szabo G (2008) Acute alcohol intake induces SOCS1 and SOCS3 and inhibits cytokine-induced STAT1 and STAT3 signaling in human monocytes. Alcohol Clin Exp Res 32(9):1565–1573. 10.1111/j.1530-0277.2008.00726.x [DOI] [PMC free article] [PubMed] [Google Scholar]
- Norkina O, Dolganiuc A, Shapiro T, Kodys K, Mandrekar P, Szabo G (2007) Acute alcohol activates STAT3, AP-1, and Sp-1 transcription factors via the family of Src kinases to promote IL-10 production in human monocytes. J Leukoc Biol 82(3):752–762. 10.1189/jlb.0207099 [DOI] [PubMed] [Google Scholar]
- Nyati KK, Masuda K, Zaman MM, Dubey PK, Millrine D, Chalise JP, Higa M, Li S, Standley DM, Saito K, Hanieh H, Kishimoto T (2017) TLR4-induced NF-kappaB and MAPK signaling regulate the IL-6 mRNA stabilizing protein Arid5a. Nucleic Acids Res 45(5):2687–2703. 10.1093/nar/gkx064 [DOI] [PMC free article] [PubMed] [Google Scholar]
- O'Callaghan JP, Kelly KA, VanGilder RL, Sofroniew MV, Miller DB (2014) Early activation of STAT3 regulates reactive astrogliosis induced by diverse forms of neurotoxicity. PLoS ONE 9(7):e102003. 10.1371/journal.pone.0102003 [DOI] [PMC free article] [PubMed] [Google Scholar]
- Oscar-Berman M, Marinkovic K (2007) Alcohol: effects on neurobehavioral functions and the brain. Neuropsychol Rev 17(3):239–257. 10.1007/s11065-007-9038-6 [DOI] [PMC free article] [PubMed] [Google Scholar]
- Pena-Altamira E, Polazzi E, Moretto E, Lauriola M, Monti B (2014) The transcription factor CCAAT enhancer-binding protein beta protects rat cerebellar granule neurons from apoptosis through its transcription-activating isoforms. Eur J Neurosci 39(2):176–185. 10.1111/ejn.12407 [DOI] [PubMed] [Google Scholar]
- Perez-Capote K, Saura J, Serratosa J, Sola C (2006) Expression of C/EBPalpha and C/EBPbeta in glial cells in vitro after inducing glial activation by different stimuli. Neurosci Lett 410(1):25–30. 10.1016/j.neulet.2006.09.078 [DOI] [PubMed] [Google Scholar]
- Petkovic F, Campbell IL, Gonzalez B, Castellano B (2017) Reduced cuprizone-induced cerebellar demyelination in mice with astrocyte-targeted production of IL-6 is associated with chronically activated, but less responsive microglia. J Neuroimmunol 310:97–102. 10.1016/j.jneuroim.2017.07.003 [DOI] [PubMed] [Google Scholar]
- Phillips JR, Hewedi DH, Eissa AM, Moustafa AA (2015) The cerebellum and psychiatric disorders. Frontiers Public Health 3:66. 10.3389/fpubh.2015.00066 [DOI] [PMC free article] [PubMed] [Google Scholar]
- Planas AM, Berruezo M, Justicia C, Barron S, Ferrer I (1997) Stat3 is present in the developing and adult rat cerebellum and participates in the formation of transcription complexes binding DNA at the sis-inducible element. J Neurochem 68(4):1345–1351 [DOI] [PubMed] [Google Scholar]
- Popp RL, Lickteig RL, Lovinger DM (1999) Factors that enhance ethanol inhibition of N-methyl-D-aspartate receptors in cerebellar granule cells. J Pharmacol Exp Ther 289(3):1564–1574 [PubMed] [Google Scholar]
- Pulido-Salgado M, Vidal-Taboada JM, Saura J (2015) C/EBPbeta and C/EBPdelta transcription factors: basic biology and roles in the CNS. Prog Neurobiol 132:1–33. 10.1016/j.pneurobio.2015.06.003 [DOI] [PubMed] [Google Scholar]
- Qin L, He J, Hanes RN, Pluzarev O, Hong JS, Crews FT (2008) Increased systemic and brain cytokine production and neuroinflammation by endotoxin following ethanol treatment. J Neuroinflammation 5:10. 10.1186/1742-2094-5-10 [DOI] [PMC free article] [PubMed] [Google Scholar]
- Qiu Z, Parsons KL, Gruol DL (1995) Interleukin-6 selectively enhances the intracellular calcium response to NMDA in developing CNS neurons. J Neurosci 15(10):6688–6699 [DOI] [PMC free article] [PubMed] [Google Scholar]
- Qiu Z, Sweeney DD, Netzeband JG, Gruol DL (1998) Chronic interleukin-6 alters NMDA receptor-mediated membrane responses and enhances neurotoxicity in developing CNS neurons. J Neurosci 18(24):10445–10456 [DOI] [PMC free article] [PubMed] [Google Scholar]
- Raike RS, Weisz C, Hoebeek FE, Terzi MC, De Zeeuw CI, van den Maagdenberg AM, Jinnah HA, Hess EJ (2013) Stress, caffeine and ethanol trigger transient neurological dysfunction through shared mechanisms in a mouse calcium channelopathy. Neurobiol Dis 50:151–159. 10.1016/j.nbd.2012.09.005 [DOI] [PMC free article] [PubMed] [Google Scholar]
- Riikonen J, Jaatinen P, Rintala J, Porsti I, Karjala K, Hervonen A (2002) Intermittent ethanol exposure increases the number of cerebellar microglia. Alcohol Alcohol 37(5):421–426 [DOI] [PubMed] [Google Scholar]
- Roberts AJ, Khom S, Bajo M, Vlkolinsky R, Polis I, Cates-Gatto C, Roberto M, Gruol DL (2019) Increased IL-6 expression in astrocytes is associated with emotionality, alterations in central amygdala GABAergic transmission, and excitability during alcohol withdrawal. Brain Behav Immun 82:188–202 [DOI] [PMC free article] [PubMed] [Google Scholar]
- Robinson G, Most D, Ferguson LB, Mayfield J, Harris RA, Blednov YA (2014) Neuroimmune pathways in alcohol consumption: evidence from behavioral and genetic studies in rodents and humans. Int Rev Neurobiol 118:13–39. 10.1016/b978-0-12-801284-0.00002-6 [DOI] [PMC free article] [PubMed] [Google Scholar]
- Ron D, Messing RO (2013) Signaling pathways mediating alcohol effects. Curr Top Behav Neurosci 13:87–126. 10.1007/7854_2011_161 [DOI] [PMC free article] [PubMed] [Google Scholar]
- Rossi DJ, Richardson BD (2018) The cerebellar GABAAR system as a potential target for treating alcohol use disorder. Handb Exp Pharmacol. 10.1007/164_2018_109 [DOI] [PMC free article] [PubMed] [Google Scholar]
- Sanna PP, Simpson C, Lutjens R, Koob G (2002) ERK regulation in chronic ethanol exposure and withdrawal. Brain Res 948(1–2):186–191 [DOI] [PubMed] [Google Scholar]
- Sanz E, Hofer MJ, Unzeta M, Campbell IL (2008) Minimal role for STAT1 in interleukin-6 signaling and actions in the murine brain. Glia 56(2):190–199. 10.1002/glia.20602 [DOI] [PubMed] [Google Scholar]
- Sarc L, Wraber B, Lipnik-Stangelj M (2011) Ethanol and acetaldehyde disturb TNF-alpha and IL-6 production in cultured astrocytes. Hum Exp Toxicol 30(9):1256–1265. 10.1177/0960327110388533 [DOI] [PubMed] [Google Scholar]
- Schobitz B, de Kloet ER, Sutanto W, Holsboer F (1993) Cellular localization of interleukin 6 mRNA and interleukin 6 receptor mRNA in rat brain. Eur J Neurosci 5(11):1426–1435 [DOI] [PubMed] [Google Scholar]
- Silvestroni A, Faull RL, Strand AD, Moller T (2009) Distinct neuroinflammatory profile in post-mortem human Huntington's disease. NeuroReport 20(12):1098–1103. 10.1097/WNR.0b013e32832e34ee [DOI] [PubMed] [Google Scholar]
- Solis-Medina A, Martinez-Magana JJ, Quintanar-Jurado V, Gallegos-Silva I, Juarez-Rojop IE, Tovilla-Zarate CA, Diaz-Zagoya JC, Hernandez-Diaz Y, Gonzalez-Castro TB, Lopez-Narvaez ML, Genis-Mendoza AD, Nicolini H (2018) Astrogliosis and decreased neural viability as consequences of early consumption of aspartame and acesulfame potassium in male Wistar rats. Metab Brain Dis 33(6):2031–2038. 10.1007/s11011-018-0310-7 [DOI] [PubMed] [Google Scholar]
- Straccia M, Gresa-Arribas N, Dentesano G, Ejarque-Ortiz A, Tusell JM, Serratosa J, Sola C, Saura J (2011) Pro-inflammatory gene expression and neurotoxic effects of activated microglia are attenuated by absence of CCAAT/enhancer binding protein beta. J Neuroinflammation 8:156. 10.1186/1742-2094-8-156 [DOI] [PMC free article] [PubMed] [Google Scholar]
- Stromberg H, Svensson SP, Hermanson O (2000) Distribution of the transcription factor signal transducer and activator of transcription 3 in the rat central nervous system and dorsal root ganglia. Brain Res 853(1):105–114 [DOI] [PubMed] [Google Scholar]
- Tomita M, Holman BJ, Williams LS, Pang KC, Santoro TJ (2001) Cerebellar dysfunction is associated with overexpression of proinflammatory cytokine genes in lupus. J Neurosci Res 64(1):26–33 [DOI] [PubMed] [Google Scholar]
- Valenzuela CF, Bhave S, Hoffman P, Harris RA (1998) Acute effects of ethanol on pharmacologically isolated kainate receptors in cerebellar granule neurons: comparison with NMDA and AMPA receptors. J Neurochem 71(4):1777–1780 [DOI] [PubMed] [Google Scholar]
- Valenzuela CF, Jotty K (2015) Mini-review: effects of ethanol on GABAA receptor-mediated neurotransmission in the cerebellar cortex—recent advances. Cerebellum 14(4):438–446 [DOI] [PubMed] [Google Scholar]
- Vallieres L, Campbell IL, Gage FH, Sawchenko PE (2002) Reduced hippocampal neurogenesis in adult transgenic mice with chronic astrocytic production of interleukin-6. J Neurosci 22(2):486–492 [DOI] [PMC free article] [PubMed] [Google Scholar]
- Vetreno RP, Crews FT (2014) Current hypotheses on the mechanisms of alcoholism. Handb Clin Neurol 125:477–497. 10.1016/B978-0-444-62619-6.00027-6 [DOI] [PMC free article] [PubMed] [Google Scholar]
- Wang XC, Qiu YH, Peng YP (2007) Interleukin-6 protects cerebellar granule neurons from NMDA-induced neurotoxicity. Sheng li xue bao [Acta Physiol Sin] 59(2):150–156 [PubMed] [Google Scholar]
- Wei H, Zou H, Sheikh AM, Malik M, Dobkin C, Brown WT, Li X (2011) IL-6 is increased in the cerebellum of autistic brain and alters neural cell adhesion, migration and synaptic formation. J Neuroinflammation 8:52. 10.1186/1742-2094-8-52 [DOI] [PMC free article] [PubMed] [Google Scholar]
- Worst TJ, Vrana KE (2005) Alcohol and gene expression in the central nervous system. Alcohol Alcohol 40(1):63–75. 10.1093/alcalc/agh119 [DOI] [PubMed] [Google Scholar]
- Ye SM, Johnson RW (2001) Regulation of interleukin-6 gene expression in brain of aged mice by nuclear factor kappaB. J Neuroimmunol 117(1–2):87–96 [DOI] [PubMed] [Google Scholar]
- Zhang GJ, Wu MC, Shi JD, Xu YH, Chu CP, Cui SB, Qiu DL (2017) Ethanol modulates the spontaneous complex spike waveform of cerebellar Purkinje cells recorded in vivo in mice. Front Cell Neurosci 11:43. 10.3389/fncel.2017.00043 [DOI] [PMC free article] [PubMed] [Google Scholar]
- Zhang Y, Wei G, Wang Y, Jing L, Zhao Q (2015) Gene expression profile analysis of rat cerebellum under acute alcohol intoxication. Gene 557(2):188–194. 10.1016/j.gene.2014.12.032 [DOI] [PubMed] [Google Scholar]