

Abstract
Mass mortality resulting from bacterial infection poses a major problem in the grouper aquaculture industry. The purpose of this study was to profile the metabolites released in challenged fish and to reconstruct the metabolic pathways of brown marble grouper (Epinephelus fuscoguttatus) in response to Vibrio vulnificus infection. Metabolite profiles from control and challenged treatment groups after feeding were determined using gas chromatography–mass spectrometry (GC–MS). Forty metabolites were identified from the GC–MS analysis. These metabolites comprised of amino acids, fatty acids, organic acids and carbohydrates. The profiles showed the highest percent area (33.1%) for leucine from the amino acid class in infected fish compared to the control treatment group (12.3%). Regarding the fatty acid class, a higher percent area of the metabolite 8,11-eicosadienoic acid (27.04%) was observed in fish infected with V. vulnificus than in the control treatment group (22.5%). Meanwhile, in the carbohydrate class, glucose (47.0%) was the metabolite in the carbohydrate class present at highest percentage in the control treatment group compared to infected fish (30.0%). Our findings highlight the importance of a metabolic analysis for understanding the changes of metabolites in E. fuscoguttatus in response to bacterial infections.
Electronic supplementary material
The online version of this article (10.1007/s13205-020-02543-4) contains supplementary material, which is available to authorized users.
Keyword: Epinephelus fuscoguttatus, Gas chromatography–mass spectrometry (GC–MS), Amino acids, Fatty acids, Vibrio vulnificus
Introduction
Grouper are distributed across the Indo-Pacific, encompassing the Persian Gulf, India and the west-central Pacific Ocean. Although most groupers are wide-ranging species, they face multiple threats, including habitat destruction and overfishing. In tropical and subtropical regions, particularly in Southeast Asia, the brown marble grouper Epinephelus fuscoguttatus is considered the most economically valuable fish species in the aquaculture industry (Baharum and Nurdalila 2011, 2012; Nurdalila et al. 2015). The grouper fish industry may face substantial economic losses because of the increasing mortality trends of E. fuscoguttatus juveniles that are susceptible to Vibrio vulnificus infection (Liu et al. 2004; Sarjito et al. 2009; Pan et al. 2013; Low et al. 2015, 2017; Nurdalila et al. 2019).
In the early larval stage, fish mortality caused by vibriosis is very common in the aquaculture industry. The infection occurs suddenly, which may lead to the death of the whole population. V. vulnificus is among the main bacterial pathogens in numerous marine and freshwater fish species (Thompson et al. 2004). This finding is consistent with the study by Nik-Haiha et al. (2008), who showed that V. vulnificus is one of the major bacteria that causes a high mortality rate in E. fuscoguttatus. An understanding of the mechanism associated with V. vulnificus infection is important to help prevent or at least minimize bacterial infection in fish. This knowledge may be obtained by monitoring changes in cellular networks that include metabolomic pathways to help identify biomarkers for early diagnosis, discover therapeutic targets, or monitor therapeutic responses and disease progression (Trushina and Mielke 2014).
Metabolomics has attracted increasing attention from various researchers, because its application has allowed us to understand the metabolic perturbations that occur during the metabolism of biological cells or tissues in organisms, and the metabolites represent the end products of the metabolic process. By analysing the metabolite profiles, multivariate data patterns can be analysed and studied to observe the differences in the health status of certain species. Low et al. (2017) have analysed the limitations and challenges of the metabolomics approach in studying fish diseases and the possibility of enhancing disease resistance in fish using this omics approach. Current studies focusing on metabolomics analyses of infected and non-infected fishes have identified the pattern of metabolic changes in response to immune mechanisms with important roles in resistance to diseases cause by bacterial pathogens. The use of metabolites or compounds has been of great interest in helping control infectious diseases in fish in the aquaculture industry. Moreover, metabolites or compounds identified in the study might be used to enhance the innate immune system of fish to combat bacterial infections. Currently, some antibiotics are no longer able to be utilized to control pathogen infections due to the emergence of antibiotic-resistant bacterial strains. With the advances in metabolite analyses, the metabolic approach can be employed in aquaculture research to identify and solve emerging issues using the metabolite patterns to describe the complexity of biological systems (Young and Alfaro 2016).
Guo et al. (2014) utilized gas chromatography–mass spectrometry (GC–MS) to establish the metabolic profile of crucian carp challenged with Edwardsiella tarda. D-mannose and palmitic acid were the most crucial metabolites that differentiated the surviving fishes infected with E. tarda. In our previous study, we reported the GC–MS analysis of tiger grouper subjected to starvation and Vibrio infection. The metabolites of fatty acid production were significantly altered in the infected fish. Omega 9 (ω-9) was present at higher levels in fish under the challenged conditions than Omega 3 (ω-3) and Omega 6 (ω-6). The differences in the free fatty acid metabolic pathways between infected fish and non-infected fish were determined. We identified significant differences in fatty acids between challenged and starved treatments (Nurdalila et al. 2019). We also performed a molecular docking study and showed the binding affinity of 4-oxodocosahexaenoic acid (4R8) for LuxP (− 6.0 kcal/mol). These findings may indicate the potential molecular interaction of fatty acids identified in vibriosis-resistant grouper with LuxP (Low et al. 2019).
Changes in these metabolites prompted us to further investigate the differences in the metabolomic profiles in response to V. vulnificus infection with feeding, which were subsequently used to identify the crucial metabolites contributing to the immune response. Among these differentially altered metabolites, potential modulators or biomarkers that are capable increasing the survival of fish infected with bacterial pathogens can be observed and identified. Therefore, we proposed the hypothesis that the metabolomics approach would be useful for monitoring metabolites that are present and absent in infected fishes. The crucial key metabolites and metabolic pathways were identified in infected and non-infected groups. In this study, we will focus on the metabolites present at increased levels in surviving infected fishes and the non-infected fish (control groups) only.
Materials and methods
Animals and treatments
Isolation and culture of bacteria
In the present study, V. vulnificus was primarily isolated from infected kidney, spleen and liver by dissecting infected E. fuscoguttatus (Nurdalila et al. 2019). The bacterium was cultured in tryptic soy broth (TSB) (Sigma-Aldrich, St. Louis, Missouri, USA) enriched with 2% sodium chloride (NaCl) and thiosulfate-citrate-bile salt-agar (TCBS) (Merck, Darmstadt, Germany). All the inoculated bacterial cultures were incubated at 30 °C for 16 h. Subcultures were also performed to continue culturing the bacteria (Burnham 2006).
The colony-forming unit (CFU) is an estimate of the number of viable bacteria (Brugger et al. 2012). V. vulnificus were cultured in tryptic soy agar (TSA) (Sigma-Aldrich, St. Louis, Missouri, USA) supplemented with 2% NaCl at 30 °C. The resulting colonies were then sub-cultured and incubated in 40 mL of fresh medium (TSB and 2% NaCl at 30 °C) for 16 h. Afterwards, the cells were harvested by centrifugation at 10,000 × g for 10 min before being washed and resuspended in PBS to an OD of 600 nm. The bacterial concentrations were approximately 1.8 × 10⁷ CFU/mL and were achieved using the dilution plate method.
The 50% lethal dose (LD50) test was conducted using the immersion method (Nurdalila et al. 2019), with slight modifications. The groupers were infected with 1.8 × 10⁷ CFU/mL, which is the lethal dose (LD50), of V. vulnificus. Three hundred millilitres of culture media were mixed with 20 L of seawater and groupers were immersed in the solution for approximately 30 min. The clinical signs and mortality of the fish were observed and recorded daily. All dead fish were collected for a postmortem examination and evaluation of histopathological changes. The internal organs (spleen and liver) were aseptically streaked on TCBS agar for V. vulnificus reisolation. Molecular identification of the bacteria was conducted using PCR with specific forward and reverse primers for V. vulnificus (VvF: 5′-GTG GTA GTG TTA ATA GCA CT-3′ and VvR: 5′-GCT CAC TTT CGC AAG TTG GCC-3). PCR products were sent for sequencing, and the sequencing results were compared to BLASTn data in the NCBI GenBank database.
Sampling and fish challenges
The experimental design was based on the study published by Nurdalila et al. (2019), with slight modifications. All methods used in the experiments followed the appropriate guidelines and regulations approved by the Fishery Research Institute, Tanjung Demong, Terengganu. The 30-day-old fingerlings were randomly placed in four different 250-L tanks with 50 fingerlings in each tank. Among all the groups, fingerlings from two tanks were infected with median lethal dose (LD50) of V. vulnificus (1.8 × 10⁷ CFU/mL). Additionally, the fingerlings in the other two tanks remained healthy for 21 days (control). Throughout the experiment, fingerlings were fed Love Larva® pellets. Fish in each of the tanks that showed physical signs of an infection were sampled on days 0–5, 6–10, 11–15, 16–20 and 21 (stage 1, stage 2, stage 3, stage 4 and stage 5, respectively) according to the infection stages described by Nurdalila et al. (2019). Physical observation to identify this disease include the reddened of fins, disintegration of fins and tail, skin lesion, popping eye, abdominal swelling and swimming upside-down (Chatterjee and Haldar 2012). A schematic chart of this experimental design is shown in Fig. 1. The sampling process was completed or stopped on day 21 after no further mortality was observed in the exposed group (Solanky et al. 2005).
Fig. 1.

Schematic chart of experimental design for fish challenged with V. vulnificus and sampling period
At 21 days post-challenge, the survival and the fingerlings with physical signs of disease were chosen for a subsequent GC–MS analysis. The signs of diseases included pale gills, a cadaverous appearance, disorientation, lethargy, darkening in colour, abdominal retention, exophthalmos, abdominal swelling, external haemorrhaging in the head, eyes, skin, gills and at the base of the fins, and skin ulcers. In the postmortem analysis, some organs of the challenged fish exhibited changes, including paleness or lesions in the kidneys, an enlarged spleen or kidney, and liquefactive renal necrosis and tubercles in the spleen (Reed and Francis-Floyd 1996; Akayli and Timur 2002). Challenged fish were collected from the Fisheries Research Institute, Tanjung Demong Terengganu. Recently dead or moribund fish were dissected, and V. vulnificus were mainly isolated from the kidney, spleen or liver.
Sample preparation for gas chromatography–mass spectrometry (GC–MS)
According to Ampofo and clerk (2010), pathogens have also been detected in the muscle tissues of fish. Meanwhile, Kim and Lee (2017) also reported that bacteria present in aquaculture waters are also subsequently observed in the fish muscle tissue. Various Vibrio spp. have been identified in randomly sampled filets of aquacultured fish. V. vulnificus accumulated or at least persisted in the fish tissues, and if the Vibrio were active, they might be present at higher levels in the fish tissues. After the fingerlings were caught, the muscle tissues were immediately dissected and flash-frozen in liquid nitrogen (N2). The samples were then stored at − 80 °C prior to extraction. Frozen muscle tissue from E. fuscoguttatus was homogenized using an electric tissue homogenizer (S 50 N—G 45 G Dispersing element, IKA® USA) with a stator diameter of 45 mm and a rotor diameter of 36 mm, both of which were suitable for solvents and abrasive substances. Three solvent extraction techniques were used in this study: methanol: chloroform: water, acetonitrile: water and Soxhlet extraction.
For the acetonitrile: water technique, the extraction was conducted using the method described by Lin et al. (2007), while the methanol: chloroform: water extraction was conducted based on the method reported by Azizan et al. (2012), with slight modifications. The samples were transferred to 2 mL pre-cooled microcentrifuge tubes after homogenization. The samples were then lyophilized for 24 h. After 24 h, samples were vortexed and heated for 6 min at 90 °C and then sonicated for 15 min before centrifugation for 15 min at 1450 × g. The supernatant was removed before the extraction procedure was repeated. The combined supernatants were pipetted into 2 mL, 8 mm top vials (PerkinElmer, USA). Approximately, 3 µL of lactic acid (0.25 mM) were added as an internal reference standard, and the chemical shift axis was calibrated. Trimethylsilyl (TMS) derivatization was conducted to extract non-volatile compounds (Table 1).
Table 1.
Extraction techniques
| Extraction techniques | Sample (mL/g) | Ratio of concentration | Derivatizing reagents | Internal standard | References |
|---|---|---|---|---|---|
| Acetonitrile: water | 5 | 2:1 | BSTFA | Lactic acid (3 µL, 0.25 mM) | Lin et al. (2007) |
| Methanol: chloroform:water | 5 | 2:2:1.8 | BSTFA | Lactic acid (3 µL, 0.25 mM) | Azizan et al. (2012) |
| Soxhlet | 7 | 150 mL of hexane | Methanolic-HCl | FAME mix (10 mg/mL) | Rubio-Rodríguez et al. (2012) |
The Soxhlet extraction method was performed as described by Rubio-Rodríguez et al. (2012), with slight modifications. The extracts were diluted with 150 mL of hexane. After dilution, the hexane was distilled off, and the flask was dried in the oven for two hours at 75 ± 1 °C. A standard containing 37 different fatty acids at concentrations of 10 mg/mL and supplied by Supelco (37 component FAME mix, Supelco, USA) was used. The lipid sample was transferred to a screw-capped vial before 200 mL of anhydrous methanolic-HCl were added. The mixture was heated at 60 °C for 15 min in a water bath. After cooling, 100 mL of water were added, and then FAMEs were extracted with 100 mL of hexane until two layers of solvent emerged from the mixture. The upper layer of the mixture was then transferred to a new vial for further GC–MS analysis (Table 1).
Gas chromatography–mass spectrometry analysis (GC–MS)
The GC–MS analysis was performed using the method reported by Azizan et al. (2012), with some modifications. A GC–MS Turbo Mass Clarus 600 from Perkin Elmer coupled to a quadruple mass selective detector with an electron ionization (EI) source operated at 70 eV was used to perform the GC–MS analysis. An aliquot of approximately 1 μL was injected into an Elite-5 MS capillary column coated with 5% crosslinked diphenyl and 95% dimethylpolysiloxane (30 m × 0.25 μm thickness × 0.25 mm i.d.) in split mode (50:1). The injection temperature was set to 250 °C, with an ion source temperature of 200 °C. The GC temperature was ranged from 70 to 300 °C with a constant helium gas flow rate of 1.1 mL per min. Full scan mode (m/z 45–600) was used to acquire spectra.
GC–MS data processing and normalization
The data from the GC–MS analysis were converted to the network common data form (Net-CDF) format via the data analysis interface of the PE Instrument (PerkinElmer, USA). Peak finding, filtering, and alignment were performed by referring to TurboMass™ GC–MS software (PerkinElmer, USA). The data were then transferred to Microsoft Excel for further analyses. In PCA, the number of components extracted is equal to the number of variables being analysed. One-way analysis of variance (ANOVA) and t test were used to statistically validate the values using significance levels of P ≤ 0.05, P ≤ 0.01 and P ≤ 0.001.
The Statistical Package for Social Sciences (SPSS) v12.0.1 software (Chicago, USA) was used for both analyses. After conducting the PCA, partial least squares discriminant analysis (PLS-DA) was conducted to develop a statistical model for the optimization of the separation between samples. Cross-validation was conducted to ensure that no signal or over fitting occurred during the construction of the PLS-DA model. The maximum theoretical value of Q2 is equal to 1 and is good for a separation model. However, for models with values of Q2 of 0.5 or higher, the separation model is still considered good. Finally, the data matrix was normalized using an internal control and the total peak area.
Bioinformatics analysis
The Lipidomics Gateway Lipid Maps databases (Fahy et al. 2007) were used to classify the group of fatty acid compounds that were detected in each of the treatments. The Lipid Maps databases have developed a comprehensive classification system for lipids (Brown and Marnett 2011). Therefore, specific types of lipids were able to be mapped accordingly. Each fatty acid compound was mapped manually according to the Lipidomics Gateway databases.
The fatty acid locations were assigned to each metabolite in the ω-3 and ω-6 fatty acid pathway maps and ω-9 fatty acid pathways, as specified in the Lipidomic Gateway database generated using VANTED (Junker et al. 2006). VANTED is a tool for the visualization and analysis of networks in the Lipidomic Gateway database. The fatty acids were mapped for localization and relative changes in the concentrations of ω-3, ω-6 and ω-9 fatty acids that occurred during pathological and physiological processes in fish in response to the infections.
Results
LD50 and colony forming units (CFUs)
The mortality of the experimentally infected E. fuscoguttatus was recorded for seven days after immersion bath infection with different concentrations of V. vulnificus: 109 CFU/mL, 108 CFU/mL, 107 CFU/mL and 106 CFU/mL. Fish mortality was observed during the 1st week of the experiment. The LD50 of V. vulnificus for E. fuscoguttatus was 1.8 × 10⁷ CFU/mL. At the end of the observation period (seven days), the mortality rates of the experimentally infected fish reached 80% compared to 0% mortality in the control group (Supplementary Table 1). Here, the calculated LD50 of V. vulnificus (1.8 × 10⁷ CFU/mL) was used in all the fish challenge experiments performed in the study.
The isolation of Vibrio from the freshly dead infected fish revealed the same molecular identification of the bacteria used in the immersion bath and thus confirmed that the challenge methodology had successfully caused Vibrio infections in the grouper. Based on molecular identification using PCR, the DNA nucleotide sequences were compared by performing a BLASTn search in the NCBI GenBank database. The sequences of isolated bacteria showed high homology with V. vulnificus (99%) (Supplementary Fig. 1). None of the fish in the control group died, as the fish remained clinically healthy and did not exhibit any pathological lesions.
Analysis of challenged and control samples
After 21 days of V. vulnificus (LD50) challenge, the surviving E. fuscoguttatus in the challenged and control tanks were collected and changes in their metabolites were analysed. The differences in metabolite profiles were determined based on the different treatments administered to E. fuscoguttatus. The GC–MS-based metabolomics analysis detected groups of metabolite compounds belonging to several major classes: amino acids, organic acids, carbohydrates and fatty acids (Table 2).
Table 2.
Percentage of metabolites involved in challenged and control E. fuscoguttatus
| Amino acids | CH + (%) | C + (%) | Organic acids | CH + (%) | C + (%) | Carbohydrates | CH + (%) | C + (%) | Fatty acid | CH + (%) | C + (%) |
|---|---|---|---|---|---|---|---|---|---|---|---|
| Proline | 4.95 ± 0.03 | 4.88 ± 0.01 | Pentadecanoic acid | 7.38 ± 0.02 | 6 ± 0.12 | Galactopyranose | 12 ± 0.06 | 17.46 ± 0.08 | 6,9-Octadecenoic acid | 26.03 ± 0.04 | 23 ± 0.12 |
| Leucine | 33.1 ± 0.01 | 12.3 ± 0.09 | Tridecanoic acid | 7.71 ± 0.01 | 8.12 ± 0.1 | Mannose | 15 ± 0.09 | 6.22 ± 0.02 | 8,11-Eicosadienoic acid | 27.04 ± 0.01 | 22.5 ± 0.17 |
| Creatinine | 3 ± 0.05 | 3.89 ± 0.03 | Propanoic acid | 8.67 ± 0.05 | 11.09 ± 0.04 | Glycoside | 2.14 ± 0.01 | 2.39 ± 0.01 | Stearidonic acid | 10.45 ± 0.02 | 17 ± 0.04 |
| Threonine | 10 ± 0.13 | 4.7 ± 0.02 | Butanedioic acid | 7.34 ± 0.01 | 8.11 ± 0.17 | Glucose | 30 ± 0.12 | 47 ± 0.16 | Linoleic acid | 26.03 ± 0.07 | 27 ± 0.11 |
| Glycine | 8.38 ± 0.17 | 33.1 ± 0.19 | Pentanedioic acid | 7.34 ± 0.12 | 6.34 ± 0.05 | Galactose | 1.85 ± 0.06 | 1.97 ± 0.01 | 5,8,11-Eicosatetraenoic acid | 10.45 ± 0.09 | 9.99 ± 0.08 |
| Isoleucine | 7.56 ± 0.05 | 3.4 ± 0.01 | Palmitelaidic acid | 6.62 ± 0.05 | 7.11 ± 0.02 | Myo-Inositol | 3.4 ± 0.01 | 2 ± 0.02 | |||
| Alanine | 4.29 ± 0.09 | 3.68 ± 0.01 | Propanedioic acid | 7.15 ± 0.09 | 6.9 ± 0.02 | Mannopyranose | 2 ± 0.02 | 2.07 ± 0.08 | |||
| Valine | 11.49 ± 0.06 | 1.76 ± 0.03 | 1,2,3-Propanetricarboxylic acid | 7.34 ± 0.14 | 6.34 ± 0.05 | Glucopyranose | 19 ± 0.16 | 8.64 ± 0.01 | |||
| Cadaverine | 1.13 ± 0.05 | 3.84 ± 0.01 | Phosphoric acid | 10.25 ± 0.17 | 12.98 ± 0.17 | Glucopyranoside | 7.08 ± 0.04 | 6.7 ± 0.06 | |||
| Glutamine | 16 ± 0.1 | 28.9 ± 0.09 | Malic acid | 7.74 ± 0.04 | 6 ± 0.02 | Xylulose | 3.68 ± 0.06 | 2.52 ± 0.01 | |||
| cis-6-Octadecenoic acid | 7.79 ± 0.08 | 6.12 ± 0.1 | Ribose | 2.79 ± 0.02 | 2.47 ± 0.02 | ||||||
| trans-13-octadecenoic acid | 7.79 ± 0.08 | 6.12 ± 0.1 | Lyxose | 1.03 ± 0.01 | 0.55 ± 0.01 | ||||||
| 9-dodecenoic acid | 7.22 ± 0.09 | 6 ± 0.02 |
*Two treatments were used: Vibrio challenged-fed (CH +) and control-fed (C +)
Amino acid compounds
Analyses of the percentages of amino acids in all treatment groups after the end of the infection (21 days) were performed with GC–MS. One-way analysis of variance (ANOVA) and t tests were used to statistically validate the values using significance levels of P ≤ 0.05, P ≤ 0.01, and P ≤ 0.001 with SPSS v12.0.1 software (Chicago, USA). The challenged and control groups subjected to normal feeding showed decreased production of amino acids beginning at 5 days post-infection (stage 1) and continuing to 21 days post-infection (stage 5) (Fig. 2). (Stage 1, Stage 2, Stage 3, Stage 4 and Stage 5; surviving fish showed signs of an infection and were collected on days 0–5, 6–10, 11–15, 16–20 and 21, respectively).
Fig. 2.

Percentage area of metabolite group extracted using methanol:chloroform:water from stage 1 to stage 5 for challenged-fed and control-fed. a Challenged-fed (CH +) treatment. b Control-fed (C +) treatment. Different colors ***indicate the following: Stage 1 (Filled brown square); Stage 2 (Filled red square); Stage 3 (Filled green square); Stage 4 (Filled violet square); Stage 5 (Filled blue square). Alphabets (a–d) indicate significant differences in a bar chart plot. Same alphabets show no significant difference between the samples. (Stage 1, Stage 2, Stage 3, Stage 4, and Stage 5; survival fish that showed infection signs was sampled on days 0–5, 6–10, 11–15, 16–20,*** and 21, respectively)
Ten amino acids were detected using GC–MS, namely, proline, creatinine, glutamine, alanine, glycine, valine, leucine, isoleucine, cadaverine, and threonine (Table 2). The percentage of each amino acid was calculated based on the percent area and normalized to the peak area of the internal standard lactic acid. Figure 3 shows the precursor relationship of amino acids between the challenged and control treatment groups. Valine and threonine were produced at higher levels in infected fish than in control fish. This difference might be attributed to the infection of the challenged fish.
Fig. 3.
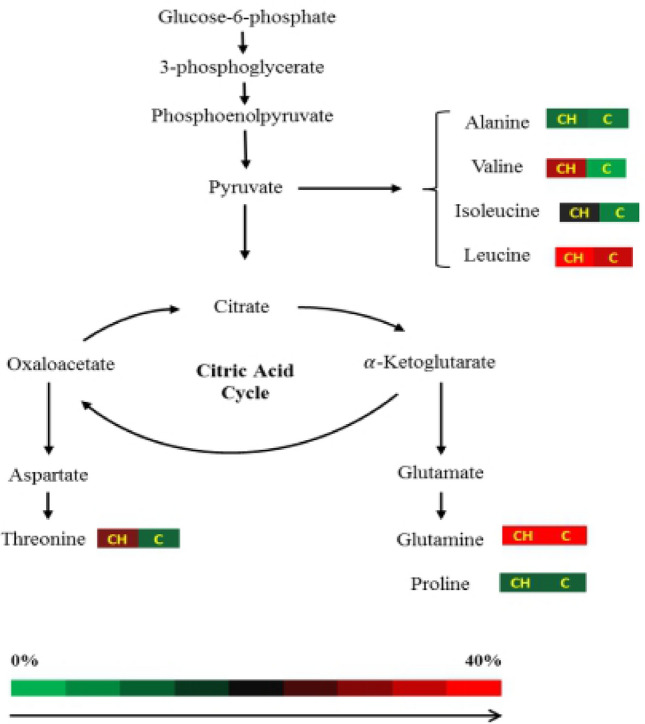
Schematic representation of the precursor relationship between amino acids on the challenged (CH +) and control (C +) treatment groups of E. fuscoguttatus based on the heatmap analysis. Scale up to 40% is due to the maximum detected amount of the percentages of amino acids: alanine, valine, isoleucine, leucine, threonine, glutamine ****and proline
Organic acid and carbohydrate compounds
As shown in Fig. 2, a clear pattern of organic acids and carbohydrates was not observed in challenge-fed and control-fed fish. Based on the GC–MS analysis, 13 organic acids were detected in the challenged and control fish (Table 2), namely, butanedioic acid, cis-6-octadecenoic acid, malic acid, palmitelaidic acid, pentadecanoic acid, propanoic acid, pentanedioic acid, propanedioic acid, phosphoric acid, trans-13-octadecenoic acid, tridecanoic acid, 1,2,3-propanetricarboxylic acid and 9-dodecenoic acid. Figure 3 shows a schematic of the precursor relationship between organic acids in the challenged and control treatment groups.
Regarding the carbohydrate compounds, 12 carbohydrates with different percentages were detected between the challenged and control groups (Table 2). The carbohydrates were galactopyranose, mannose, glycoside, glucose, galactose, myo-inositol, mannopyranose, glucopyranose, glucopyranoside, xylose, ribose, and lyxose. Figure 4 shows the precursor relationship between the carbohydrates of the challenged and control treatment groups. Significant differences in metabolite production were observed between the treatment groups. Glucose was more abundant in control samples than in infected samples. In contrast, mannose was more abundant in infected samples than in control samples.
Fig. 4.

Schematic representation of the precursor relationship between carbohydrates on the challenged (CH +) and control (C +) treatment groups of E. fuscoguttatus based on the heatmap analysis. Scale up to 40% is due to the maximum detected amount of the percentages of carbohydrates: galactose, glucose, xylulose-5-phosphate, ribose-5-phosphate ***and mannose
Fatty acids
The fatty acid group showed the highest percentage of compounds produced compared with the products of the other three main groups (amino acids, organic acids, and carbohydrates). Figure 5 shows the precursor relationship between the fatty acids in the challenged and control treatment groups. Concentrations of numerous ω-9 fatty acids were significantly reduced in the control fish compared with challenged fish. Overall, at 21 days post-challenge, a higher percent area of fatty acids was observed in infected fish than in the control group. During the period from stage 1 until stage 5, the production of fatty acid compounds increased (Fig. 2). When comparing the level of the ω-9 fatty acids in challenge-fed fish to the control-fed fish, challenge-fed fish showed a significantly higher percentage (27%) of 8,11-eicosadienoic acid; however, the percentage of this compound in control-fed fish was only 22% (Table 2).
Fig. 5.

Schematic representation of the precursor relationship between fatty acids on the challenged (CH +) and control (C +) treatment groups of E. fuscoguttatus based on the heatmap analysis. Scale up to 40% is due to the maximum detected amount of the percentages of fatty acids: octadecenoic acid, linoleic acid, stearidonic acid, and eicosatetraenoic acid
Discussion
GC–MS is the analysis method of choice for smaller and volatile molecules. It has been extensively used to profile complex biological metabolites and identify compounds. In the present study, a principal component analysis (PCA) was performed, and the number of components extracted and distributed were analysed. A decrease in the production of amino acids was observed between challenged and control groups from day 5 post-infection (stage 2) to day 21 post-infection (stage 5) (Fig. 2). This change might be attributed to the growth and maturity of fish in the early stage. According to Gómez-Requeni et al. (2003) , fish in the early growing stage require large amounts of amino acids, which are used as an energy source in this stage. According to Buentello and Gatlin (2002), requirements for amino acids and protein decrease when the fish age. Amino acids regulate key metabolic pathways that are required for maintenance, growth, reproduction, and immune responses. Amino acids are required to achieve desirable efficiency of metabolic transformation, growth performance, health, or compositional traits of aquaculture animals at various developmental stages.
In the current study, we compared amino acid production between infected fish and non-infected fish (control group), and infected fish produced greater amounts of amino acids than the control group. Similar results have been reported by Yang et al. (2018) in surviving zebrafish that were infected with Vibrio alginolyticus. Metabolomic profiling showed a higher percentage of amino acids than in the control group. Hence, this finding supported our results shown in Fig. 2. Based on these findings, the production of amino acids increased in response to the bacterial infection. According to studies conducted by other researchers, amino acids have been proposed to be compounds that participate in and regulate key metabolic pathways to improve the survival, health, growth and development of the organisms (Wu 2010, 2013). Another study by Liu et al. (2016), had described important roles for amino acids such as alanine, valine and glycine in the activation of an atypical immune response linked to inflammatory disease. As shown in Table 2, leucine (33.1%) and isoleucine (7.56%) were detected at higher percentages in challenged fish than in the control fish, 12.3% and 3.4%, respectively.
These findings were consistent with the results reported by Etzel (2004) and De Bandt and Cynober (2006), who showed that leucine and isoleucine stimulate the formation of muscle (Charlton 2006) and have important roles in controlling stress conditions, such as sepsis. Among the fishes studied, leucine and isoleucine are present at higher levels in marine fishes, such as Stolephorus waitei, Rastrelliger kanagurta and Oncorhynchus mykiss (Kaushik 1998; Mohanty et al. 2014). In comparison, glycine (8.38%) and glutamine (16%) were present at lower levels in the infected fish than in the control fish, as shown in Table 2 (33.1% and 28.9%, respectively). Similar studies revealed a low amino acid content, including glutamine, in the muscles of infected animals, which decreased by as much as 50% due to major injury or infection (Paauw and Davis 1990; Parry-Billings et al. 1992; Abumrad and Barbul 2004; Zaman et al. 2010). A potential explanation for this finding is that glutamine is used by fish during the activation of the cellular immune response, in which glutamine will be converted to alpha-ketoglutarate to provide the additional energy through the Krebs cycle and sustain the immune response (Azeredo et al. 2017) . Although the requirements for proteins and amino acids might decrease as the fish ages, the increased levels of several amino acids might also be due to the regulation of key metabolic pathways that are crucial for fish maintenance, growth, reproduction, and immune responses (Buentello and Gatlin 2002).
The percent area of the organic acids revealed the presence of organic acids in the challenged and control samples during normal feeding (Table 2). The production of organic acids was slightly altered in the infected fish compared with the control fish. The presence of organic acids in infected samples indicated that the bacterial infection increased the production of some organic acids to help enhance the immune response. Organic acids stimulate the exocrine pancreatic secretion of enzymes and bicarbonate, hence assisting with protein and fat digestion, which is known to improve the growth performance, nutrient consumption and immune response of farmed aquatic animals (Abbasi et al. 2009). The present study revealed some effects of bacteria on organic acids. Overall, organic acids might inhibit bacterial growth by decreasing the intestinal pH, decreasing the cytoplasmic pH by interfering with bacterial metabolism, and inhibiting enzymatic activity or DNA synthesis (Sterzo et al. 2007).
Carbohydrates are necessary component of a diet and are converted to glucose to provide energy to the muscles. According to Alarcon et al. (2001), carbohydrates are deposited in the form of glycogen in tissues such as liver and muscle, where it is a ready source of energy. In fishes, energy is produced by oxidation, which requires a constant supply of sufficient oxygen. However, if the oxygen concentration is insufficient, particularly when fish experience stress caused by pathogen infections, the fish will produce energy within white muscle tissue through glycolysis, where adrenaline stimulates the tissue and causes the conversion of glycogen into glucose for the energy required to initiate the immune mechanisms that allow fish to resist infectious pathogens. However, if the fish are reared in a low-stress environment, free of diseases and supplied with all required nutrients, excess energy can be used for growth and reproduction (Samuelsson and Larsson 2008). In the current study, carbohydrates such as mannose, myo-inositol, glucopyranose, glycopyranoside, xylulose, ribose and lyxose, were present at higher percent areas in infected fish than in the control group (Table 2). Metabolites, such as mannose (Al-Banaw et al. 2010), ribose (Uribe et al. 2011) and myo-inositol (Kim et al. 2003), were reported to be involved in the fish immune response.
In addition, fishes, carbohydrate compounds are present on the bacterial cell wall and function as barriers and receptors for bacteria during the process of bacterial invasion or infection of a certain cell or tissue of host organisms. The carbohydrate moieties on the surface of pathogens will be recognized by the host and ultimately trigger the host immune system. Researchers (Safari et al. 2012) have proposed that the receptors on the bacterial surface can be identified, and the carbohydrate may be mimicked by synthesizing it before the carbohydrate binds to the protein of the bacteria or virus. The protein on the bacteria or the virus would then no longer interact with the receptor of the host system. Based on the metabolomics analysis conducted on V. vulnificus, numerous metabolites of carbohydrates and fatty acids were derived from V. vulnificus (Supplementary Table 2). Hence, similar carbohydrate metabolites are present in both bacteria and fish, such as xylulose, lyxose and ribose. Although the bacteria contained several similar carbohydrates involved in the host defence mechanism, they did not affect the activation of the fish immune system.
In our previous study, we reported significant changes in the fatty acid contents, particularly ω-9 compounds, in fish subjected to infection-starvation treatments (Nurdalila et al. 2019). The difference in the production of fatty acids might be due to the difference in the stress factor to which the fishes were exposed where they were starved and infected with V. vulnificus. Fatty acids are essential components of membranes. Thus, fatty acids are a very important source of metabolic energy in all organisms. In a previous study, the regulation of these pathways was mainly examined in a model prokaryote, Escherichia coli (Cronan and Subrahmanyam 1998; DiRusso and Nyström 1998; Cronan and Waldrop 2002; Zhang et al. 2002). Other prokaryotes, such as Bacillus subtilis (Schujman and deMendoza 2006; Matsuoka et al. 2007) and Streptococcus pneumonia (Lu and Rock 2006), also exhibit this global regulation of fatty acid metabolic pathways. Other lipid metabolism pathways have been studied in gastrointestinal microbes, such as Lactobacillus plantarum. Here, multiple fatty acid species are generated from this microbe, such as trans-fatty acids and conjugated fatty acids, which affect the lipid metabolism of the host. In the colon and intestine, the saturation metabolism of polyunsaturated fatty acids represents the mode of lipid metabolism by gastrointestinal microbes, which detoxify anaerobic microbes, such as lactic acid-producing bacteria. This metabolic process will transform the growth-inhibiting, free polyunsaturated fatty acids into less toxic, free saturated fatty acids, such as linoleic acid, α-linolenic acid, γ-linolenic acid, and 10-oxooctadecanoic acid, which might improve health by controlling intestinal lipid metabolism (Round and Mazmanian 2009; Brouwer et al. 2010; Kim et al. 2012). Solanky et al. (2005) was able to identify biomarkers of Aeromonas salmonicida infection in Atlantic salmon using nuclear magnetic resonance (NMR) spectroscopy. The chemical shift ranges contributed to the clustering of spectra between the survivors of A. salmonicida in either challenged or control groups. Here, the compounds that contributed to the chemical changes were lipids, amino acids, and carbohydrates. However, since the researchers used nuclear magnetic resonance (NMR) spectroscopy, the detailed identification of members of the groups was not feasible. Although this approach is incredibly powerful, it is an inherently insensitive analytical technique. Based on these analyses, exposure to the A. salmonicida pathogen results in substantial modifications to lipid metabolism, along with basic changes in amino acid and carbohydrate metabolism that are associated with the modulation or alteration of muscle activity, energy metabolism, and protein turnover. A positive correlation of fatty acid production and metabolism has been observed when these compounds are metabolized into a large and diverse bioactive lipid mediator, and they may function as pro-inflammatory and anti-inflammatory mediators (Funk 2001). Therefore, these findings may explain the increased production of fatty acids after the fish were exposed to V. vulnificus in the present study. Lipids and fatty acids also contribute significantly to the functions of epidermally derived skin appendages, which produce a lipid-enriched fluid called sebum, reinforce the skin barrier, and exhibit antimicrobial activities (Jia et al. 2007).
Conclusions
At the end of this study, four notable groups of metabolites, namely, carbohydrates, amino acids, organic acids and fatty acids, were identified at 21 days post-infection. Hence, after fish were infected with the LD50 of V. vulnificus, the metabolites present at the highest levels in the surviving fish of the challenged group at 21 days post-infection were leucine and valine from the amino acid class and 8,11-eicosadienoic acid and 6,9-octadecenoic acid from the fatty acid class. The use of GC–MS-based metabolomics to characterize the changes in metabolomes in response to V. vulnificus infection revealed the potential of this metabolic approach to identify biomarkers related to fish disease. Hence, the results highlight the potential of these metabolites, namely, amino acids and fatty acids, as the crucial biomarkers differentiating the surviving infected fish from the control fish after feeding.
Electronic supplementary material
Below is the link to the electronic supplementary material.
Acknowledgements
We also acknowledged Center for Research and Instrumentation Management (CRIM), Universiti Kebangsaan Malaysia (UKM) for the Research Instrumentation Fund (PIP-2010). This work was supported by Research University Grant (GUP-2017-073), Dana Impak Perdana (DIP-2015-024) from Universiti Kebangsaan Malaysia, FRGS/1/2013/SG05/UKM/02/2 from The Ministry of Higher Education, Malaysia (MOHE).
Author contribution
SNB conceived and designed the experiments. AAN performed the experiments and analyzed the data. SNB, AAN and MEN wrote and edited the manuscript. All authors reviewed and approved the final version for submission.
Compliance with ethical standards
Conflict of interest
The authors declare that they have no conflict of interest.
References
- Abbasi PA, Lazarovits G, Jabaji-Hare S. Detection of high concentrations of organic acids in fish emulsion and their role in pathogen or disease suppression. Phytopathology. 2009;99(3):274–281. doi: 10.1094/PHYTO-99-3-0274. [DOI] [PubMed] [Google Scholar]
- Abumrad NN, Barbul A. Metabolic and therapeutic aspects of amino acids in clinical nutrition. Boca Raton, Florida: CRC Press; 2004. The use of arginine in clinical practice; pp. 595–611. [Google Scholar]
- Akayli T, Timur G. Vibriosis in gilthead sea bream (Sparus aurata L.) in farms in the Aegean Sea coast of Turkey. Turk J Fish Aquat Sci. 2002;2:89–91. [Google Scholar]
- Alarcon FJ, Martinez TF, Diaz M, Moyano FJ. Characterization of digestive carbohydrase activity in the gilthead seabream (Sparus aurata) Hydrobiologia. 2001;445:199–204. [Google Scholar]
- Al-Banaw A, Kenngott R, Al-Hassan JM, Mehana N, Sinowatz F. Histochemical analysis of glycoconjugates in the skin of a catfish (Arius tenuispinis, Day) J Vet Med. 2010;39(1):42–50. doi: 10.1111/j.1439-0264.2009.00977.x. [DOI] [PubMed] [Google Scholar]
- Ampofo JA, Clerk GC. Diversity of bacteria contaminants in tissues of fish cultured in organic waste-fertilized ponds: health implications. Open Fish Sci J. 2010;3:142–146. [Google Scholar]
- Azeredo R, Serra CR, Oliva-Teles A, Costas B. Amino acids as modulators of the European seabass, Dicentrarchus labrax, innate immune response: an in vitro approach. Sci Rep. 2017;7:18009. doi: 10.1038/s41598-017-18345-3. [DOI] [PMC free article] [PubMed] [Google Scholar]
- Azizan KA, Baharum SN, Noor NM. Metabolic profiling of Lactococcus lactis under different culture conditions. Molecules. 2012;17:8022–8036. doi: 10.3390/molecules17078022. [DOI] [PMC free article] [PubMed] [Google Scholar]
- Baharum SN, Nurdalila AA. Phylogenetic Relationships of Epinephelus fuscoguttatus and Epinephelus hexagonatus inferred from mitochondrial cytochrome b gene sequences using bioinformatics tools. Int J Biosci Biochem Bioinf. 2011;1(1):47–52. [Google Scholar]
- Baharum SN, Nurdalila AA. Application of 16s rDNA and cytochrome b ribosomal markers in studies of lineage and fish populations structure of aquatic species. Mol Biol Rep. 2012;39(5):5225–5232. doi: 10.1007/s11033-011-1320-2. [DOI] [PubMed] [Google Scholar]
- Brouwer IA, Wanders AJ, Katan MB. Effect of animal and industrial trans fatty acids on HDL and LDL cholesterol levels in humans—a quantitative review. PLoS ONE. 2010;5(3):e9434. doi: 10.1371/journal.pone.0009434. [DOI] [PMC free article] [PubMed] [Google Scholar]
- Brown HA, Marnett LJ. Lipid biochemistry, metabolism, and signaling editorial. Chem Rev. 2011;111:5817–6512. doi: 10.1021/cr200363s. [DOI] [PubMed] [Google Scholar]
- Brugger SD, Baumberger C, Jost M, Jenni W, Brugger U, Mühlemann K. Automated counting of bacterial colony forming units on agar plates. PLoS ONE. 2012;7(3):e33695. doi: 10.1371/journal.pone.0033695. [DOI] [PMC free article] [PubMed] [Google Scholar]
- Buentello JA, Gatlin DM. Preliminary observations on the effects of water hardness on free taurine and other amino acids in plasma and muscle of channel catfish. N Am J Aquacult. 2002;64:95–102. [Google Scholar]
- Burnham VE (2006) Strain to strain differences in the growth, survival and adaptation of Vibrio vulnificus and Vibrio parahaemolyticus in broth. Master of Science Thesis, Louisiana State University, USA
- Charlton M. Branched-chain amino acid enriched supplements as therapy for liver disease. J Nutr. 2006;136(1):295S–298S. doi: 10.1093/jn/136.1.295S. [DOI] [PubMed] [Google Scholar]
- Chatterjee S, Haldar S. Vibrio related diseases in aquaculture and development of rapid and accurate identification methods. J Mar Sci Res Dev. 2012;1:002. [Google Scholar]
- Cronan JE, Jr, Subrahmanyam S. FadR, transcriptional co-ordination of metabolic expediency. Mol Microbiol. 1998;29:937–943. doi: 10.1046/j.1365-2958.1998.00917.x. [DOI] [PubMed] [Google Scholar]
- Cronan JE, Jr, Waldrop GL. Multi-subunit acetyl-CoA carboxylases. Prog Lipid Res. 2002;41:407–435. doi: 10.1016/s0163-7827(02)00007-3. [DOI] [PubMed] [Google Scholar]
- De Bandt JP, Cynober L. Therapeutic use of branchedchain amino acids in burn, trauma, and sepsis. J Nutr. 2006;185(1):308S–313S. doi: 10.1093/jn/136.1.308S. [DOI] [PubMed] [Google Scholar]
- DiRusso CC, Nyström T. The fats of Escherichia coli during infancy and old age: regulation by global regulators, alarm ones and lipid intermediates. Mol Microbiol. 1998;27:1–8. doi: 10.1046/j.1365-2958.1998.00645.x. [DOI] [PubMed] [Google Scholar]
- Etzel MR. Manufacture and use of dairy protein fractions. J Nutr. 2004;134(4):996S–1002S. doi: 10.1093/jn/134.4.996S. [DOI] [PubMed] [Google Scholar]
- Fahy E, Sud M, Cotter D, Subramaniam S. LIPID MAPS online tools for lipid research. Nucleic Acids Res. 2007;35:W606–612. doi: 10.1093/nar/gkm324. [DOI] [PMC free article] [PubMed] [Google Scholar]
- Funk CD. Prostaglandins and leukotrienes: advances in eicosanoid biology. Science. 2001;294:1671–2187. doi: 10.1126/science.294.5548.1871. [DOI] [PubMed] [Google Scholar]
- Gómez-Requeni P, Mingarro M, Kirchner S, Calduch-Giner JA, Médale F, Corraze G, Panserat S, Martin SAM, Houlihan DF, Kaushik SJ, Pérez-Sánchez J. Effects of dietary amino acid profile on growth performance, key metabolic enzymes and somatotropic axis responsiveness of gilthead sea bream (Sparus aurata) Aquaculture. 2003;220(1–4):749–767. [Google Scholar]
- Guo C, Huang XY, Yang MJ, Wang S, Ren ST, Li H, Peng XX. GC/MS-based metabolomics approach to identify biomarkers differentiating survivals from death in crucian carps infected by Edwardsiella tarda. Fish Shellfish Immunol. 2014;39(2):215–222. doi: 10.1016/j.fsi.2014.04.017. [DOI] [PubMed] [Google Scholar]
- Jia Z, Moulson CL, Pei Z, Miner JH, Watkins PA. Fatty acid transport protein 4 is the principal very long chain fatty acyl-CoA synthetase in skin fibroblasts. J Biol Chem. 2007;282:20573–20583. doi: 10.1074/jbc.M700568200. [DOI] [PubMed] [Google Scholar]
- Junker BH, Klukas C, Schreiber S. VANTED: a system for advanced data analysis and visualization in the context of biological networks. BMC Bioinf. 2006;7:109. doi: 10.1186/1471-2105-7-109. [DOI] [PMC free article] [PubMed] [Google Scholar]
- Kaushik SJ. Whole body amino acid composition of European seabass (Dicentrarchus labrax), gilthead seabream (Sparus aurata) and turbot (Psetta maxima) with an estimation of their IAA requirement profiles. Aquat Living Resour. 1998;11(5):355–358. [Google Scholar]
- Kim JY, Lee JL. Correlation of total bacterial and vibrio spp. populations between fish and water in the aquaculture system. Front Mar Sci. 2017;4:1–10. [Google Scholar]
- Kim HW, Kim JH, An HS, Park KK, Kim BK, Park T. Myo-inositol restores the inflammation-induced down-regulation of taurine transport by the murine macrophage cell line, RAW 2647. Life Sci. 2003;73(19):2477–2489. doi: 10.1016/s0024-3205(03)00656-8. [DOI] [PubMed] [Google Scholar]
- Kim YI, Hirai S, Goto T, Ohyane C, Takahashi H, Tsugane T, Konishi C, Fujii F, Inai S, Iijima Y, Aoki K, Shibata D, Takahashi N, Kawada T. Potent PPARa activator derived from tomato juice, 13-oxo-9, 11-octadecadienoic acid, decreases plasma and hepatic triglyceride in obese diabetic mice. PLoS ONE. 2012;7(2):e31317. doi: 10.1371/journal.pone.0031317. [DOI] [PMC free article] [PubMed] [Google Scholar]
- Lin CY, Wu H, Tjeerdema RS, Viant MR. Evaluation of metabolite extraction strategies from tissue samples using NMR metabolomics. Metabolomics. 2007;3:55–67. [Google Scholar]
- Liu PC, Lin JY, Chuang WH, Lee KK. Isolation and characterization of pathogenic Vibrio harveyi (V. carchariae) from the farmed marine cobia fish Rachycentron canadum L. with gastroenteritis syndrome. World J Microbiol Biotechnol. 2004;20:495–499. [Google Scholar]
- Liu P, Du Y, Meng L, Li X, Liu Y. Metabolic profiling in kidneys of Atlantic salmon infected with Aeromonas salmonicida based on 1 H NMR. Fish Shellfish Immun. 2016;58:292–301. doi: 10.1016/j.fsi.2016.08.055. [DOI] [PubMed] [Google Scholar]
- Low CF, Mariana NS, Maha A, Chee HY, Fatimah MY. Non-immune-related genes and signaling pathways in spleen of Vibrio parahaemolyticus infected Epinephelus fuscoguttatus (Forskal) J Fish Dis. 2015;38:761–764. doi: 10.1111/jfd.12283. [DOI] [PubMed] [Google Scholar]
- Low CF, Rozaini MZH, Musa N, Baharum SN. Current knowledge of metabolomic approach in infectious fish disease studies. J Fish Dis. 2017;40:1267–1277. doi: 10.1111/jfd.12610. [DOI] [PubMed] [Google Scholar]
- Low CF, Shamsir MS, Mohd-Hussien ZA, Baharum SN. Evaluation of potential molecular interaction between quorum sensing receptor, LuxP and grouper fatty acids: In-silico screening and simulation. PeerJ. 2019;7:e6568. doi: 10.7717/peerj.6568. [DOI] [PMC free article] [PubMed] [Google Scholar]
- Lu YJ, Rock CO. Transcriptional regulation of fatty acid biosynthesis in Streptococcus pneumoniae. Mol Microbiol. 2006;59:551–566. doi: 10.1111/j.1365-2958.2005.04951.x. [DOI] [PubMed] [Google Scholar]
- Matsuoka H, Hirooka K, Fujita Y. Organization and function of the YsiA regulon of Bacillus subtilis involved in fatty acid degradation. J Biol Chem. 2007;282:5180–5194. doi: 10.1074/jbc.M606831200. [DOI] [PubMed] [Google Scholar]
- Mohanty B, Mahanty A, Ganguly S, Sankar TV, Chakraborty K, Rangasamy A, Paul B, Sarma D, Mathew S, Asha KK, Behera B, Aftabuddin M, Debnath D, Vijayagopal P, Sridhar N, Akhtar MS, Sahi N, Mitra T, Banerjee S, Paria P, Das D, Das P, Vijayan KK, Laxmanan PT, Sharma AP. Amino acid compositions of 27 food fishes and their importance in clinical nutrition. J Amino Acids. 2014;2014:269797. doi: 10.1155/2014/269797. [DOI] [PMC free article] [PubMed] [Google Scholar]
- Nik-Haiha NY, Mohd-Zaidi M, Ali HM, Zin RM (2008) The antimicrobial potential of the crude extracts from leaves of some local herbs on fish pathogenic bacteria. http://www.seafdec.org.my/v13/images/stories/pdf/ NaFis2008. Accessed 14 Aug 2019
- Nurdalila AA, Bunawan H, Kumar SV, Rodrigues KF, Baharum SN. Homogeneous nature of Malaysian marine fish Epinephelus fuscoguttatus (perciformes; serranidae): evidence based on molecular markers, morphology and fourier transform infrared analysis. Int J Mol Sci. 2015;16:14884–14900. doi: 10.3390/ijms160714884. [DOI] [PMC free article] [PubMed] [Google Scholar]
- Nurdalila AA, Mayalvanan Y, Baharum SN. Metabolite profiling of Epinephelus fuscoguttatus infected with vibriosis reveal omega 9 as potential metabolite biomarker. Fish Physiol Biochem. 2019;45(3):1203–1215. doi: 10.1007/s10695-019-00633-6. [DOI] [PubMed] [Google Scholar]
- Paauw JD, Davis AT. Taurine concentrations in serum of critically injured patients and age- and sex-matched healthy control subjects. Am J Clin Nutr. 1990;52:657–660. doi: 10.1093/ajcn/52.4.657. [DOI] [PubMed] [Google Scholar]
- Pan CY, Wang YD, Chen JY. Immunomodulatory effects of dietary Bacillus coagulans in grouper (Epinephelus coioides) and zebrafish (Danio rerio) infected with Vibrio vulnificus. Aquacult Int. 2013;21:1155–1168. [Google Scholar]
- Parry-Billings M, Baigrie RJ, Lamont PM, Morris PJ, Newsholme EA. Effects of major and minor surgery on plasma glutamine and cytokine levels. Arch Surg. 1992;127:1237–1240. doi: 10.1001/archsurg.1992.01420100099017. [DOI] [PubMed] [Google Scholar]
- Reed PA, Francis-Floyd R. Vibrio Infections of Fish. Florida: University of Florida; 1996. p. 31. [Google Scholar]
- Round JL, Mazmanian SK. The gut microbiota shapes intestinal immune responses during health and disease. Nat Rev Immunol. 2009;9:313–323. doi: 10.1038/nri2515. [DOI] [PMC free article] [PubMed] [Google Scholar]
- Rubio-Rodríguez N, de Diego SM, Beltrán S, Jaime I, Sanz MT, Rovira J. Supercritical fluid extraction of fish oil from fish by-products: a comparison with other extraction methods. J Food Eng. 2012;109:238–248. [Google Scholar]
- Safari D, Marradi M, Chiodo F, Dekker HA, Shan Y, Adamo R, Oscarson S, Rijkers GT, Lahmann M, Kamerling JP, Penadés S, Snippe H. Gold nanoparticles as carriers for a synthetic Streptococcus pneumoniae type 14 conjugate vaccine. Nanomedicine. 2012;7(5):651–662. doi: 10.2217/nnm.11.151. [DOI] [PubMed] [Google Scholar]
- Samuelsson LM, Larsson DG. Contributions from metabolomics to fish research. Mol Bio Syst. 2008;4(10):974–979. doi: 10.1039/b804196b. [DOI] [PubMed] [Google Scholar]
- Sarjito S, Radjasa OK, Sabdono A, Prayitno SB, Hutabarat S. Phylogenetic diversity of the causative agents of Vibriosis associated with grouper fish from Karimunjawa Islands, Indonesia. Curr Res Bacteriol. 2009;2:14–21. [Google Scholar]
- Schujman GE, deMendoza D. Solving an old puzzle in phospholipid biosynthesis. Nat Chem Biol. 2006;2:573–574. doi: 10.1038/nchembio1106-573. [DOI] [PubMed] [Google Scholar]
- Solanky KS, Burton IW, MacKinnon SL, Walter JA, Dacanay A. Metabolic changes in Atlantic salmon exposed to Aeromonas salmonicida detected by 1H nuclear magnetic resonance spectroscopy of plasma. Dis Aquat Organ. 2005;65:107–114. doi: 10.3354/dao065107. [DOI] [PubMed] [Google Scholar]
- Sterzo EV, Paiva JB, Mesquita AL, Freitas NOC, Berchieri A., Jr Organic acids and/or compound with defined microorganisms to control Salmonella enterica serovar Enteritidis experimental infection in chickens. Rev Bras Cienc Avic. 2007;9:69–73. [Google Scholar]
- Thompson FL, Iida T, Swings J. Biodiversity of Vibrios. Microbiol Mol Biol Rev. 2004;68:403–431. doi: 10.1128/MMBR.68.3.403-431.2004. [DOI] [PMC free article] [PubMed] [Google Scholar]
- Trushina E, Mielke MM. Recent advances in the application of metabolomics to Alzheimer’s disease. Biochem Biophys Acta. 2014;1842:1232–1239. doi: 10.1016/j.bbadis.2013.06.014. [DOI] [PMC free article] [PubMed] [Google Scholar]
- Uribe C, Folch H, Enriquez R, Moran G. Innate and adaptive immunity in teleost fish: a review. Vet Med. 2011;56(10):486–503. [Google Scholar]
- Wu G. Functional amino acids in growth, reproduction, and health. Adv Nutr. 2010;1(1):31–37. doi: 10.3945/an.110.1008. [DOI] [PMC free article] [PubMed] [Google Scholar]
- Wu G. Functional amino acids in nutrition and health. Amino Acids. 2013;45(3):407–411. doi: 10.1007/s00726-013-1500-6. [DOI] [PubMed] [Google Scholar]
- Yang MJ, Cheng ZX, Jiang M, Zeng ZH, Peng B, Li H. Boosted TCA cycle enhances survival of zebrafish to Vibrio alginolyticus infection. Virulence. 2018;9(1):634–644. doi: 10.1080/21505594.2017.1423188. [DOI] [PMC free article] [PubMed] [Google Scholar]
- Young T, Alfaro AC. Metabolomic strategies for aquaculture research: a primer. Rev Aquacult. 2016;10(1):26–56. [Google Scholar]
- Zaman C, Lin K, O’Neill W (2010) The significance and relationships of amino acids and protein in chronic disease and general wellness. Immune Systems Management Inc: 1–15
- Zhang YM, Marrakchi H, Rock CO. The FabR (YijC) transcription factor regulates unsaturated fatty acid biosynthesis in Escherichia coli. J Biol Chem. 2002;77:15558–15565. doi: 10.1074/jbc.M201399200. [DOI] [PubMed] [Google Scholar]
Associated Data
This section collects any data citations, data availability statements, or supplementary materials included in this article.