

Abstract
A docking study of a set of several 1,5-disubstituted tetrazoles compounds has been performed to predict the poses of some potential inhibitors of the Abelson tyrosine-protein kinase and the mutated Abelson tyrosine-protein kinase T315I. The study was conducted through Lamarckian genetic algorithms in Autodock4 package. Bayesian calculations were performed; specificity and sensitivity values as well as positive predicted values, and negative predicted values were calculated using a set of 99 known experimentally active ligands and 385 decoys for the Abelson tyrosine-protein kinase from the Directory of Useful Decoys database. Root mean square deviation values were calculated though the X-ray crystallographic data of the bioactive pose of imatinib as reference, and the pose obtained with the above methods. The obtained results show the importance of the protein interactions with the halogens present in some of these 1,5-disubstituted tetrazoles ligands, as well as the presence of some hydrophobic fragments, obtained via the pharmacophoric model, concluding that the eight novels 1,5-disubstituted tetrazoles compounds herein identified, could be effective inhibitors of Abelson tyrosine-protein kinase, using a docking calculations.
Keywords: Docking; Pharmacophore-model; 1,5-DS-T; ABL kinase; Mutant T315I; Anticancer
Introduction
Chronic myelogenous leukemia (CML) is a human disease characterized by a translocation between chromosomes 9 and 22 into the c-abl locus of chromosome 9 and the bcr region of chromosome 22 (Ben-Neriah et al. 1986). Its incidence is 2 per 100,000 people each year and the common age of diagnosis of the disease is 50–55 (Von Bubnoff and Duyster 2010). Moreover, ABL tyrosine kinases constitute a family of proteins with the best-conserved branches of the tyrosine kinases. There are two types of ABL tyrosine kinases: ABL1, which is involved in repairing damage to nuclear DNA, and ABL2, is present in cytoskeletal remodeling (Colicelli 2011). ABL genes have been observed in a tumor gene in the Abelson murine lymphosarcoma virus (Abelson and Rabstein 1970). Patients with CML, express a BCR-ABL1 oncoprotein that enhances the tyrosine kinase activity of the cells, leading to down-regulation of cell growth and the replication-associated pathways such as those that use JAK/STAT, MAPK, RAS, RAF, JUNK and MYC (Kumar et al. 2015). The catalytic domains of ABL tyrosine kinases are highly conserved in sequence and structure. The kinase domain has a bilobular structure where the N-lobe contains a β-sheet and one conserved α-helix (helix C). The interface between the two lobes, form the ATP-binding pocket and the catalytic site (Glu286, Thr315, Met318, Ile360, His361 and Asp381) (Hantschel and Superti-Furga 2004). Small molecule inhibitors of protein kinases that have been discovered to date almost invariably bind to the kinase domain at this interfacial cleft between the both lobes, displacing ATP (Wu et al. 2016). Treatments for CML have included allogenic stem cell transplantation and the use of recombinant interferon-alpha, but the most effective treatments have involved the administration of tyrosine kinase inhibitors (TKIs) (Baccarani et al. 2013). Indeed, Imatinib mesylate was the first TKI drug found to function against CML and to be well tolerated. Administration of this drug led to a complete cytogenetic response in 60% of cases and resulted in adverse events in less than 6% of patients, whereas the complete cytogenetic response rate for recombinant-interferon has been reported to be only 41% (Kantarjian et al. 2002).
The structure of imatinib is depicted in Fig. 1, which contains with a phenyl amino derivative as the core structure (and shown in black in the figure). The addition of a 3-pyridyl group (depicted in blue in Fig. 1) to the 3′-position of the pyrimidine enhanced the activity. Also, the amide group (in red color) conferred activity against tyrosine kinases and the addition of a methyl group (in pink color) abolished the undesirable protein-kinase-C inhibitory activity. Finally, inclusion of N-methyl piperazine (in green colour) increased the solubility and oral bioavailability (Capdeville et al. 2002).
Fig. 1.
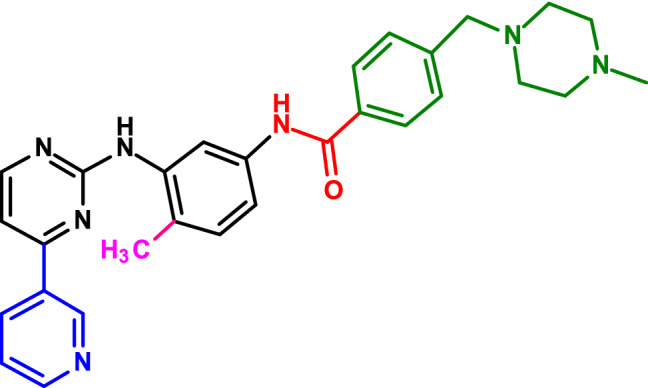
Schematic representation of the moieties in imatinib. The black lines indicate the core structure
Type I, II and IV TKIs, including imatinib, nilotinib, dasatinib, bosutinib and ponatinib, have shown activity against Bcr-Abl and have been approved by the FDA (see, Fig. 2). Additionally, about 36 compounds have been patented during the last 8 years (Desogus et al. 2015). Nevertheless, imatinib has been shown to lose its effectiveness against CML in up to 30% of patients during their first 5 years on therapy (O’Hare et al. 2009), since some mutations in the kinase domain of the Bcr-Abl protein (between kinase domains) appear. Thus, the ineffectiveness of imatinib is caused by the interference of the interaction between the protein and the drug. The mutations that most interfere with the drug activity are those at residues 255 and 315, specifically with a mutation at residue 255 countering the inhibitory activity of nilotinib as well as of imatinib, and the T315I mutation (resulting in BCR-ABLT315I) interfering with the inhibitory activities of all TKIs (Pemovska et al. 2015).
Fig. 2.

FDA approved inhibitors of ABL kinase
Many efforts are being expended to find more inhibitors of ABL kinase that remain active even toward resistant mutations in T315I which adopts an active conformation and is the result of two strictly conserved side chains, Lys271 of strand β3 and Glu286 of helix αC as the key residues. Computer aided drug design has played an important role in the discovery of new TKI’s, especially for the T315I ABL kinase through structure and ligand-based approaches (Zhou et al. 2007). One good example is the compound PPY-A, which Zhou et al. (Pemovska et al. 2015) have shown to have favorable interactions and be a potential inhibitor of the T315I ABL kinase.
Computer aided drug discovery is an important tool nowadays to start in the looking for novel drugs. Molecular docking has become a useful and easy tool to predict the possible mode of possess of a ligand into the active site of the target. This approach has been widely used to screen small molecules in organic synthesis, producing libraries and reducing the experimental cost and time in the field of drug discovery (Vardhan 2020).
The resistance shown to the ABL kinase is a sufficient reason to explore the behavior of new compounds with different scaffolds and to find therapeutic molecules effective against BCR-ABL T315I. Moreover, in the present work the interactions and affinities, using molecular docking studies, of some novel 1,5-disubstituted-1H-tetrazoles previously synthesized by Cortes-García et al. (2016) have been predicted. These novel compounds are used since they include a fragment of imatinib and a 1,5-disubstituted tetrazole (1,5-DS-T) which is present in several bioactive compounds including anticancer (Zhang et al. 2019; Neochoritis et al. 2019) (see Scheme 1).
Scheme 1.

Overview of the synthesis of the new 1,5-DS-T compounds (Cortés-García et al. 2016)
Materials and methods
Data set selection
To assess the docking protocol performance, the Bayesian theorem to 99 compounds known to be active against ABL kinase and 385 decoys for this kinase was applied. Both sets of compounds were retrieved from the Directory of Useful Decoys (DUD) (Huang et al. 2006) (http://www.dud.docking.org). Also, thirty-eight variants of 1,5-DS-T, previously synthesized by Cortés-Garcia et al. were used as an exploration set of compounds, these structures are listed in Table 1. The structures of ligands AXI and JIN, which were retrieved from PDB codes, served as the crystallographic reference used in this research (4TWP and 2HZI respectively) in order to compare RMSD values.
Table 1.
Novel 1,5-DS-T compounds (Cortés-García et al. 2016)
| Entry | Compound code | R1 | R2 |
|---|---|---|---|
| 1 | 1a | H | Cy |
| 2 | 1b | H | t-Bu |
| 3 | 2a | 4-F | Cy |
| 4 | 2b | 4-F | t-Bu |
| 5 | 3a | 2-F | Cy |
| 6 | 3b | 2-F | t-Bu |
| 7 | 4a | 2,3-di-F | Cy |
| 8 | 4b | 2,3-di-F | t-Bu |
| 9 | 5a | 2,4-di-F | Cy |
| 10 | 5b | 2,4-di-F | t-Bu |
| 11 | 6a | 2,5-di-F | Cy |
| 12 | 6b | 2,5-di-F | t-Bu |
| 13 | 7a | 3,4-di-F | Cy |
| 14 | 7b | 3,4-di-F | t-Bu |
| 15 | 8a | 2,3,4,5,6-Penta-F | Cy |
| 16 | 8b | 2,3,4,5,6-Penta-F | t-Bu |
| 17 | 9a | 2-Cl | Cy |
| 18 | 9c | 2-Cl | t-Bu |
| 19 | 10a | 4-Cl | Cy |
| 20 | 10b | 4-Cl | t-Bu |
| 21 | 11a | 2-Br | Cy |
| 22 | 11b | 2-Br | t-Bu |
| 23 | 12a | 4-Br | Cy |
| 24 | 12b | 4-Br | t-Bu |
| 25 | 13a | 4-OMe | Cy |
| 26 | 13b | 4-OMe | t-Bu |
| 27 | 14a | 3,4-di-OMe | Cy |
| 28 | 14b | 3,4-di-OMe | t-Bu |
| 29 | 15a | 2,3,4-tri-OMe | Cy |
| 30 | 15b | 2,3,4-tri-OMe | t-Bu |
| 31 | 16a | 2,4,5-tri-OMe | Cy |
| 32 | 16b | 2,4,5-tri-OMe | t-Bu |
| 33 | 17a | 3,4,5-tri-OMe | Cy |
| 34 | 17b | 3,4,5-tri-OMe | t-Bu |
| 35 | 18a | 2,4,5-tri-Me | Cy |
| 36 | 18b | 2,4,5-tri-Me | t-Bu |
| 37 | 19a | 4-(pyridin-2-yl) | Cy |
| 38 | 19b | 4-(pyridin-2-yl) | t-Bu |
Ligand modeling
The 1,5-DS-T compounds were modeled as 2D structures with the software ChemBio Draw Ultra 12.0 (Cousins 2011) and converted into 3D structures in MDL format. Their protonated states were then computed using Chemicalize (Swain 2012) (http://www.chemicalize.org).
Furthermore, the active and inactive structures from the DUD database were optimized by carrying out molecular mechanics using the UFF force field (Casewit et al. 1992) in the Gaussian 3.9 software package (Cioslowski 2009).
Finally, using Autodock Tools (Sanner 1999), the ligands were prepared by adding polar hydrogens and Gasteiger charges. Rotatable (i.e., single) bonds were assigned by default, and a. pdbqt file was generated, to follow using the tool Raccon (Forli et al. 2016) that allows many structures to be prepared in. pdbqt file at the same time.
Receptor preparation
Two X-ray structures for the ABL kinase were downloaded from the PDB database (Rose et al. 2015): PDB i.d. 2HZI, which contains the ligand JIN, and PDB i.d. 4TWP, which contains the ligand AXI (Cowan-Jacob et al. 2007). The first ligand showed good interactions in the active site of ABL kinase and the second one for the T315I ABL kinase. After the preparation of the ligands in Autodock Tools, these X-ray structures were analyzed and validated using Swiss PDB viewer (Kaplan and Littlejohn 2001) to generate the fine structures. The missing residues (273 and 503 for 4TWP and 221–232 for 2HZI) were found in the crystal structures. Their minimal states were then calculated using the AMBER force field in GROMACS, adding polar hydrogens throughout the structures. Lastly, Kollman charges were added using Autodock Tools.
Docking calculations
Autodock4 was used for the rigid docking calculations, using the Lamarckian genetic algorithm (Morris et al. 1998). 1,5-DS-T ligands were set in a 126 Å × 126 Å × 126 Å grid box. A value of 0.37 was used for spacing calculations for the active and inactive ligands from the DUD database and these ligands were centered in each receptor. AD4.dat parameters were applied to all the ligands. The conditions for the docking calculations were in general 100 runs, a population size of 150, a total of 1,000,000 generations, a default value of 0.8 for the crossover rate, a mutant rate of 0.2, and 100 individuals in each run (Gallardo et al. 2014).
Moreover, in our study, decoys for ABL kinase, i.e., the compounds in the DUD database that were not active towards the kinase, were used to assess the docking performance of the active compounds, and then specificity and sensitivity values were obtained. The pKi values predicted from the negative and positive docking results were used as markers to distinguish active from inactive compounds (Triballeau et al. 2005). Also, the original ligands from each receptor (JIN and AXI) were docked with the same conditions used for all other ligands in order to assess the performance of the docking study using the RMSD value between the original coordinates and the predicted ones resulting from our docking protocol.
All the results for each ligand were analyzed in Autodock Tools. The best free energies and Ki values were kept and afterwards, the Ki values were converted in pKi values using Eq. 1. All the information was processed in order to obtain the representative graphics comparing the free energy and pKi values. The analysis of hydrogen bonds was carried out for the complexed ligands and the docked ones, each with their respective receptor, using HBAT software (Iwari and Panigrahi 2007), in order to determine the principal and important interactions. PyMol software was used to visualize the interactions.
Moreover, an analysis of the hydrophobic surface was performed for each obtained possess and both the hydrogen bond and the electrostatic interactions was evaluated for the modeled compounds, using the Molegro Virtual Docker package (MVD) (Yang and Chen 2004).
Pharmacophoric modeling
By using the results obtained in the docking study, specifically the hydrophobic surfaces, the hydrogen bond and electrostatic interaction between the selected target and the best predicted ligands, a pharmacophoric model has been performed through the online server Zinc Pharmer (Koes and Camacho 2012).
In silico ADMET properties and drug likeness
To predict the probable pharmacokinetics of the best dock scored compounds in this study, we carried out an in silico assay of the absorption, distribution, metabolism, elimination and toxicity using the online tool http://biosig.unimelb.edu.au/pkcsm/prediction (Pires et al. 2015). The computed the ADMET properties included absorption: water solubility, Caco2 permeability, intestinal human absorption, skin permeability, probable substrate and type I and II inhibitors for P-glycoprotein; steady state volume of distribution (VDss), fraction unbound, brain blood barrier (BBB) permeability, central nervous system (CNS) permeability; metabolism: substrate (CYP2D6 and CYP3A4 enzymatic complexes), excretion (renal OCT2 substrate, drug total clearance), toxicity (maximum tolerated dose, oral rat acute and chronic toxicity, T. pyriformis toxicity and minnow toxicity).
For the drug likeness predictions, we used the online server https://www.molinspiration.com/cgi-bin/properties (https://www.molinspiration.com) that includes hydrophobicity (LogP), topological polar surface area (TPSA), molecular weight (MW), number of hydrogen acceptors and donors (nON and nOHNH respectively) number of violations to the Lipinski´s rules, number of rotatable bonds and total volume.
Results and discussion
Computation of pKi and free energies
For all the 584 tested compounds used in the docking studies, their free energies and the Ki values were predicted. A compilation was then made for a statistical analysis. Each ligand was analyzed using the graphical interface of Autodock Tools to determine the pose and whether the ligand was bound in the active site. Two plots (for active compounds and decoys) were made to reveal the general behavior of the pKi, computed via Eq. 1 and the free energy (Figs. 3 and 4) that show the prediction of the type of interaction and the predicted relative affinity between compounds and the crystallographic structures. Consequently, the evaluation of the docking protocol using known active compounds for ABL tyrosine kinase and decoys for the same receptor could be performed:
| 1 |
Fig. 3.

pKi and free energy values of the active set of ligands from the DUD database for the 2HZI receptor
Fig. 4.

pKi and free energy values of the decoy (inactive) set of ligands from the DUD database for the 2HZI receptor
Statistical results
The statistical results were obtained using the Bayesian theorem (Lavecchia 2014) with Eqs. 2a–2c, and the results are presented in Table 2.
Table 2.
Statistical results obtained through the Bayesian theorem
| N = 584 | |||||
|---|---|---|---|---|---|
| Active compounds = 99 | Inactive compounds = 385 | ||||
| True positives | False negatives | True negatives | False positives | Cutoff | |
| 85 | 14 | 123 | 262 | 10% (58) | |
| Sensitivity (Se) | 0.85 | ||||
| Specificity (Sp) | 0.31 | ||||
| Enrichment Factor (EF) | 10.79 | ||||
| Positive Predicted Value (PPV) | 0.24 | ||||
| Negative Predicted Value (NPV) | 1.12 | ||||
| (LR) | 1.26 | ||||
The positive predicted and negative predicted values are the probabilities of finding as positive or negative event (Ghaaliq and McCluskey 2008). In this case, the results of the evaluation of the conditions in the docking protocol helped determine how the genetic algorithm works with the chemical environment of the receptor as well as the chemical structures that are active and inactive to the ABL kinase compounds:
| 2a |
| 2b |
| 2c |
| 2d |
where: Se = sensitivity; Sp = specificity; TP = true positives; FN = false negatives; PPV = positive predicted value; NPV = negative predicted value
These results (see Table 2) seem to be counterintuitive, since decoys turn out to be false positives (262 compounds). The values used as cutoff to calculate the Se, Sp, PPV and NPV were also used with the pKi values. A range from 6.03 to 9.24 (− 8.2 to − 12.6 kcal/mol) was deemed as actives (positive compounds) while pKi values below 6.02 (− 8.18 kcal/mol) as inactives (negative compounds). This was based in the docking results of active compounds considered as active ones in the DUD data base. The results derived of the Bayesian calculations show that there were more false positives than false negatives: Se = 0.85 and Sp = 0.31. It means that, the protocol of the docking study could better predict positive ligands as the active compounds than it could predict the negative ligands as the inactive ones. Nevertheless, the PPV and the NPV show us how the protocol has the possibility of detecting the negative or inactive ligands well; thus, the conditions of the docking experiment were considered for the docking validation calculations, using the structural information for the 2HZI and 4TWP complexes as well the same conditions with the 38 novel 1,5-DS-T compounds.
Docking validation
The X-ray structures of proteins and the ligands were prepared as described above, treating the ligands and receptors separately. The ligand in the 2HZI structure was identified as JIN and in the 4TWP structure as AXI. After the calculations, the.dlg files were visualized using Autodock tools and the best free energy, affinity constant, and pose coordinate results were kept. Figure 5 shows a comparison of the original conformations of the ligands and those obtained through the proposed method. The RMSDs were calculated using PyMol, between the heavy atoms in both, native and docked structures and were found to be 1.754 and 1.827 Å for the 2HZI_JIN and 4TWP_AXI complexes, respectively; where a value below 2.00 Å is considered to be the upper limit for validation of docking poses.
Fig. 5.

Superposition of complexed ligands and the predicted docking poses a: AXI from 4TWP, b: JIN from 2HZI
Evaluation of the novel 1,5-DS-T compounds with the selected docking protocol
The RMSD values resulting from the docking validation studies indicates that the conditions of the search method and the placement of coordinates in the grid box are appropriate for the 1,5-DS-T docking calculations. The 1,5-DS-T compounds were then prepared as were all of the ligands, and docking results of each compound were analyzed manually. The free energy, Ki values and the coordinates of the best pose were kept. The results are shown in the Table 3.
Table 3.
Docking results of the 1,5-DS-T compounds with 2HZI and 4TP receptors
| Entry | Ligand | ΔG (kcal/mol) | Ki (nM) | pKi (nM) | ΔG (kcal/mol) | Ki (nM) | pKi (nM) |
|---|---|---|---|---|---|---|---|
| 2HZI | 4TWP | ||||||
| 1 | 1a | − 11.93 | 1.79 | 8.75 | − 12.89 | 1.79 | 9.45 |
| 2 | 1b | − 11.28 | 5.40 | 8.27 | − 11.77 | 2.36 | 8.63 |
| 3 | 2a | − 11.64 | 2.95 | 8.53 | − 13.04 | 2.95 | 9.56 |
| 4 | 2b | − 10.98 | 8.88 | 8.05 | − 11.34 | 4.87 | 8.31 |
| 5 | 3a | − 12.6 | 1.04 | 8.98 | − 12.58 | 1.04 | 9.22 |
| 6 | 3b | − 11.36 | 0.101 | 8.33 | − 11.74 | 2.47 | 8.61 |
| 7 | 4a | − 11.31 | 5.14 | 8.29 | − 12.23 | 1.09 | 8.96 |
| 8 | 4b | − 10.99 | 8.86 | 8.05 | − 11.31 | 5.16 | 8.29 |
| 9 | 5a | − 11.59 | 3.2 | 8.49 | − 12.82 | 3.2 | 9.4 |
| 10 | 5b | − 11 | 8.61 | 8.06 | − 11.7 | 2.64 | 8.58 |
| 11 | 6a | − 11.45 | 4.02 | 8.4 | − 11.57 | 3.32 | 8.48 |
| 12 | 6b | − 11.14 | 6.8 | 8.17 | − 11.65 | 2.9 | 8.54 |
| 13 | 7a | − 11.06 | 7.83 | 8.11 | − 12.16 | 1.22 | 8.91 |
| 14 | 7b | − 10.95 | 9.45 | 8.02 | − 11.56 | 3.38 | 8.47 |
| 15 | 8a | − 11.08 | 7.57 | 8.12 | − 11.76 | 2.41 | 8.62 |
| 16 | 8b | − 10.89 | 10.45 | 7.98 | − 11.38 | 4.57 | 8.34 |
| 17 | 9a | − 12.54 | 0.64 | 9.19 | − 11.49 | 3.81 | 8.42 |
| 18 | 9b | − 11.8 | 2.25 | 8.65 | − 11.74 | 2.5 | 8.6 |
| 19 | 10a | − 11.96 | 2.02 | 8.69 | − 13.73 | 2.02 | 10.06 |
| 20 | 10b | − 11.34 | 4.84 | 8.32 | − 12.19 | 1.15 | 8.94 |
| 21 | 11a | − 12.19 | 1.16 | 8.94 | − 12.22 | 1.1 | 8.96 |
| 22 | 11b | − 12.39 | 0.82 | 9.08 | − 12.39 | 0.824 | 9.08 |
| 23 | 12a | − 12.12 | 1.31 | 8.88 | − 13.24 | 1.31 | 9.71 |
| 24 | 12b | − 11.44 | 4.1 | 8.39 | − 11.91 | 1.85 | 8.73 |
| 25 | 13a | − 11.75 | 2.42 | 8.62 | − 13.8 | 2.42 | 10.11 |
| 26 | 13b | − 11.07 | 7.65 | 8.12 | − 11.71 | 2.63 | 8.58 |
| 27 | 14a | − 12.18 | 1.18 | 8.93 | − 12.26 | 1.04 | 8.98 |
| 28 | 14b | − 11.08 | 7.55 | 8.12 | − 12.62 | 1.07 | 9.25 |
| 29 | 15a | − 11.00 | 8.46 | 8.07 | − 12.81 | 8.46 | 8.07 |
| 30 | 15b | − 10.54 | 18.87 | 7.72 | − 10.7 | 14.44 | 7.84 |
| 31 | 16a | − 11.38 | 4.59 | 8.34 | − 11.69 | 2.68 | 8.57 |
| 32 | 16b | − 10.95 | 17.28 | 7.76 | − 10.33 | 26.9 | 7.57 |
| 33 | 17a | − 11.19 | 6.26 | 8.2 | − 11.69 | 2.72 | 8.57 |
| 34 | 17b | − 10.78 | 12.52 | 7.9 | − 11.78 | 2.31 | 8.64 |
| 35 | 18a | − 12.03 | 1.51 | 8.82 | − 11.51 | 3.68 | 8.43 |
| 36 | 18b | − 11.5 | 3.7 | 8.43 | − 12.24 | 1.07 | 8.97 |
| 37 | 19a | − 12.34 | 0.89 | 9.05 | − 13.7 | 0.89 | 10.05 |
| 38 | 19b | − 11.91 | 1.85 | 8.73 | − 12.67 | 1.85 | 9.28 |
The obtained results show compounds 3a, 9a, 11a and 11b to be the best ligands for the 2HZI receptor and compounds 1a, 5a, 10a and 13a to be the best for the 4TWP receptor. The binding energies and the Ki values of the best ligands for the 2HZI receptor are very different from those for the 4TWP receptor. At the same time, it is important to remember that the 4TWP receptor is a mutated ABL kinase and these ligands, according to the docking results, could be tested in vitro to experimentally determine their activities against this protein.
Almost all the ligands interact with the residue Lys 219 of the 2HZI protein and with the residue Met 316 of the 4TWP protein. To obtain all of the hydrogen bond interactions between the protein and the ligands, HBAT software was used to calculate the chemical properties of these bonds, and the results are shown in Table 3. The above interactions are shown in Fig. 7, and the results of the HBAT package analysis using as starting structures the coordinates with the best-docked ligands, are presented in Table 4. Interestingly, the bests predicted affinities came from ligands that contain halogens. Such interactions are well known in biological structures (Auffinger et al. 2004; Regier et al. 2009; Lu et al. 2010; Sirimulla et al. 2013; Kortagere et al. 2008; Cavallo et al. 2016) and could correspond to the sigma hole halogen bonding (except for fluorine which is not a halogen-bond donor). Unfortunately, the scoring function used in our methodology is not capable to predict accurately these kinds of interactions. At the same time, comparing the structures of pairs of ligands as well as comparing their binding and Ki values revealed big differences between the results when the R2 moiety is cyclohexane and when it is a less hydrophobic group. Specifically, comparing the ligands that have best interaction modes with their respective receptors led us to conclude that a more hydrophobic R2 moiety displays higher binding energies (Fig. 6).
Fig. 7.

Poses of the best ligands predicted for the 2HZI receptor (a) with ligands: 3a, 9a, 11a, and 11a. And for the 4TWP receptor (b) with ligands: ligands 13a, 10a, 1a, and 5a
Table 4.
HB interactions computed with the HBAT package
| 2HZI | 9a | NH–N | Gly249 | 112h | 2.146 | 3.124 |
| NH–N | Lys271 | 112h | 2.818 | 3.150 | ||
| NH–O | 112h | Met318 | 2.129 | 2.956 | ||
| 11b | NH–N | Lys271 | 144dd | 2.794 | 3.514 | |
| NH–N | Lys271 | 144dd | 2.302 | 3.020 | ||
| OH–N | Thr315 | 144dd | 2.526 | 3.050 | ||
| NH–O | 144dd | Thr315 | 2.195 | 3.050 | ||
| 3a | NH–N | Gly249 | 96bb | 1.963 | 2.951 | |
| NH––N | Lys271 | 96bb | 2.911 | 3.386 | ||
| NH–N | Lys271 | 96bb | 2.657 | 2.946 | ||
| NH–O | 96bb | Met318 | 2.106 | 2.847 | ||
| 11a | NH–N | Gly249 | 143cc | 2.948 | 3.165 | |
| NH–N | Asp 381 | 143cc | 2.048 | 2.984 | ||
| NH–N | Asp381 | 143cc | 1.997 | 2.829 | ||
| NH–N | Phe382 | 143cc | 2.991 | 3.452 | ||
| 4TWP | 13a | NH–N | Met316 | 126p | 1.948 | 2.904 |
| NH–N | Met316 | 126p | 2.380 | 3.113 | ||
| NH–O | Asp379 | 126p | 2.085 | 2.886 | ||
| NH–O | Phe380 | 126p | 2.959 | 3.824 | ||
| 10a | NH–N | Met316 | 100a | 1.974 | 2.970 | |
| NH–N | Met316 | 100a | 2.260 | 3.054 | ||
| 1a | NH–N | Met316 | 106d | 2.073 | 3.093 | |
| NH–N | Met316 | 106d | 2.118 | 2.997 | ||
| 5a | NH–N | Met316 | 137w | 1.911 | 2.931 | |
| NH–N | Met316 | 137w | 2.081 | 2.959 |
Fig. 6.

pKi values of the 1,5-DS-T ligands docked to the 2HZI and 4TWP receptors
Based on the pose analysis of the docking results for each of the 1,5-DS-T ligands, we selected those that interacted with the active site of the proteins. The docking predictions indicated the 1,5-DS-T ligands to have more affinity for the 4TWP receptor (i.e., the T315I mutant) than for the 2HZI receptor. Thus, the proposed ligands may be good inhibitors for the specific ABL kinase that is resistant to imatinib.
The ligands that showed the same set of predicted interactions for the 2HZI receptor are 3a, 9a, 11a and 11b. For the 4WTP receptor, 1a, 5a, 10a and 13a displayed common interactions. The poses of the best ligands were analyzed to find the common interactions in order to establish the principal chemical moieties or features that contribute to the free energy and Ki results. The results of this analysis are shown in Fig. 7. Analyzing the poses between the best 1,5-DS-T ligands for the 2HZI receptor, reveals that it formed similar interactions with the halogens of three ligands, specifically with halogens attached to position 2 of the R1 substituent. The ligand with chlorine shown a good predicted Ki and free energy nevertheless, the fluorine substituted ligand had the best free energy and Ki values. As Cortes-García et al. noted in their publication of the synthesis of these novel 1,5-DS-T compounds, including halogens in the synthesis was the highest priority in the effort to make compounds which display a higher specificity and affinity for the ABL kinase. Another interesting chemical feature was that the 1,5-DS-T ligands with the Cy substituent (R2) showed the best interactions, perhaps because this moiety interacted with a hydrophobic region in the binding site of the receptor. We chose the collection of ligands, so that each one had a structural homologue as shown in Figs. 7 and 8 to help relate the results to specific chemical features. At the same time, a feature that is very beneficial for our work is that the best ligands for 4TWP have almost the same pose in the binding site, as shown in Fig. 8b (Table 5).
Fig. 8.

Hydrophobic interactions between a) 10a and b)13a with the ABL receptor (PDB code 4tWP). Blue surfaces represent the hydrophobic zones and red color the hydrophilic zones
Table 5.
Comparison of the chemical structures of the best ligands predicted for the 4TWP receptor and the respective analogues of these ligands

From the results resumed in Table 6, it is seen that the Ki values could improve the therapeutic effect, due to a modification in the hydrophobic tetrazole region. In this way, docking calculations were carried out with hypothetical structures modified in this region, using the same protocol that was used for the 38 1,5-DS-T and PBD code 2HZI as a receptor. The chemical structures and their docking results are presented at the Tables 7 and 8. It is noteworthy to mention that ligands 9a-6, containing the adamantly moiety, resulted with a free energy of − 12.48 and a Ki of 0.705 nM (0.000705 µM) which were the lowest Ki values.
Table 6.
Comparison of the chemical structures of the best ligands predicted for the 2HZI PDB code receptor and the respective analogues of these ligands

Table 7.
Docking results derived from 9a 1,5-DS-T ligand, with a chemical modification in R2 (Scheme 1)

Note that the Ki values obtained are predicted in a nM concentration
Table 8.
Docking results derived from 112h 1,5-DS-T ligand, with a chemical modification in R2 (Scheme 1)

Note that the Ki values obtained are predicted in a nM concentration
Hydrophobic, hydrogen bond and electrostatic interactions
Using the above results, the analysis of the hydrophobic, hydrogen bond and electrostatic interactions between the modeled ligand and the selected targets were performed.
The results for the 4TWP PDB code receptor interacting with their better ligands (10a and 13a) are shown below. Figure 8 shows the hydrophobic surface for the selected target, interacting with 10a and 13a ligands, is clear that the right site of the target presents a hydrophobic behavior and the left site a hydrophilic behavior, for this reason both, 10a and 13a, position their central aromatic rings on the blue surface and their tetrazole moiety near of the red zone. Note that, the 13a ligand, see Fig. 8b, promotes the formation of sharper angles, due the ring accommodation on the blue surfaces, generating stacking interactions intra and inter molecular.
On the other hand, the hydrogen bond and electrostatic interactions between the ABL receptor (PDB code: 4TWP) and the 10a and 14a ligands are shown in the Fig. 9. In the case of 10a, the hydrogen bond interaction is weakly than the presented by 13a, the same behavior for electrostatic interactions is denoted.
Fig. 9.

Hydrogen bond and electrostatic interactions between a 10a and b 13a with the ABL receptor (PDB code 4TWP). Blue dotted lines represent the hydrogen bond interactions, red doted lines show the repulsion electrostatic interactions and the green dotted lines represent the attraction electrostatic interactions
Figure 10 shows that the Asp381 interacts with both, 10a and 13a, in a similar site of the molecule. In Fig. 10b, can be observe that Phe382 interacts one of the rings of the right site, despite the hydrogen bond interaction is present, the stacking interaction with these rings can be some more important interactions, between the ring of Phe382 and the rings of 13a.
Fig. 10.

a Hydrophobic interactions between 9a ligand and the ABL receptor (PDB code 2HZI). b Hydrogen bond and electrostatic interactions between 9a ligand and the ABL receptor (PDB code 2HZI). Blue surfaces represent the hydrophobic zones and red color the hydrophilic zones. Blue dotted lines represent the hydrogen bond interactions, red doted lines show the repulsion electrostatic interactions and the green dotted lines represent the attraction electrostatic interactions
The results for the 2HZI PDB code receptor are shown below. Figure 10a shows the hydrophobic interactions between the mentioned receptor and the 9a ligand, which is the ligand with a better interaction with the selected target. Is clear that, the hydrophobic surface predominates into the target cavity, depicted in blue color, and for these reasons, the hydrophobic moieties place on these blue zones.
Furthermore, the hydrogen bond and electrostatic interactions are shown in Fig. 10b, which the attraction interactions, depicted in green dotted lines, predominate. The principal interaction resides are the Glu258, Met318 and the Asp 325, with rings of the molecule.
Pharmacophoric modeling
Finally, with the obtained results across the present study, was made a pharmacophoric model for each receptor. For the ABL receptor with the 4TWP PDC code, the performed model shows two hydrophobic and aromatic (Hy-Ar, depicted in purple color) segments and the center, see Fig. 11a, at the same time at the left site a hydrogen donor segment (HD, in gray color) is necessary in the pharmacophoric model; this segment is surrounded with another HD in the below site, other Hy-Ar at the left site and on the top, site a hydrophobic segment (Hy, depicted in green color).
Fig. 11.

Pharmacophoric models for the ABL receptor with a PDB code 4TWP and b PDB code 2HZI. The purple spheres represent the aromatic and hydrophobic behavior, the green spheres represent hydrophobic behavior and the yellow and gray spheres depict the hydrogen acceptor and hydrogen donor behaviors, respectively
Moreover, note that to obtain molecules with a better interaction with the 4TWP receptor, these molecules require also a hydrogen acceptor segment (HA, depicted in Fig. 11a in yellow color).
In the case of the pharmacophoric model for the ABL receptor with PDB code 2HZI, see Fig. 11b, predominated the hydrophobic fragments (green and purple spheres), but in the central site these hydrophobic segments need to be also aromatic (purple spheres). At the same time, this model presents two HA fragments around the Hy-Ar fragments and only one HD fragment.
In silico ADMET and drug-likeness results
According with the predicted drug likeness and ADMET properties, compounds 9a, 10a, 13a and 11b compounds (Table 9) satisfies the limitations for the intestinal epithelial barrier (Caco2 > 0.90). The intestinal absorption is > 30%, the steady state volume of distribution (VDss) is low (0.71–2.81) and corresponds to their low unbounded fraction. Therefore, these compounds could be bounded to the plasma transporter proteins. The BBB and the CNS permeability indicate that these compounds have a poorly distribution in these compartments. The predicted toxicity for Tetrahymena pyriformis is higher than the limit value (− 0.5 µg/L) but not for the minnow predicted toxicity that is < − 0.3.
Table 9.
In silico ADMET properties of 9a, 10a, 13a and 11b
| Compound | Water solubility (log mol/L) | Caco2 permeability (log Papp in 10–6 cm/s) | Intestinal absorption (human) (% absorbed) | Skin permeability (log Kp) | P-glycoprotein substrate (yes/no) | P-glycoprotein I inhibitor (yes/no) | P-glycoprotein II inhibitor (yes/no) | VDss (human) (log L/kg) | Fraction unbound (human) (Fu) | BBB permeability (log BB) |
|---|---|---|---|---|---|---|---|---|---|---|
| 9a | − 3.158 | 1.03 | 100 | − 2.735 | Yes | Yes | Yes | 0.269 | 0.127 | − 0.75 |
| 10a | − 3.166 | 1.044 | 100 | − 2.735 | Yes | Yes | Yes | 0.271 | 0.122 | − 0.744 |
| 13a | − 3.162 | 1.072 | 100 | − 2.735 | Yes | Yes | Yes | 0.156 | 0.114 | − 0.792 |
| 11b | − 3.577 | 0.944 | 99.565 | − 2.735 | Yes | Yes | Yes | − 0.403 | 0.089 | − 0.497 |
| Compound | CNS permeability (log PS) | CYP2D6 substrate (yes/no) | CYP3A4 substrate (yes/no) | Total clearance (log ml/min/kg) | Max. tolerated dose (human) (log mg/kg/day) | Oral rat acute toxicity (LD50) (mol/kg) | Oral rat chronic toxicity (LOAEL) (log mg/kg_bw/day) | T. pyriformis toxicity (log μg/L) | Minnow toxicity (log mM) |
|---|---|---|---|---|---|---|---|---|---|
| 9a | − 2.938 | No | Yes | − 0.253 | 0.497 | 3.301 | 1.058 | 0.285 | 0.561 |
| 10a | − 2.938 | No | Yes | − 0.371 | 0.495 | 3.299 | 1.073 | 0.285 | 0.275 |
| 13a | − 3.237 | No | Yes | − 0.057 | 0.486 | 3.31 | 1.138 | 0.285 | 0.96 |
| 11b | − 2.878 | No | Yes | − 0.507 | 0.433 | 3.185 | 1.118 | 0.285 | − 3.493 |
The drug-likeness predictions (Table 10) show two violations to the Lipinski´s rules (miLogP and MW), but these results must be investigated in in vitro studies.
Table 10.
Drug likeness predictions of compounds 9a, 10a, 13a and 11b
| Compound | miLogP | TPSA | MW | nON | nOHNH | Violations (Lipinski’s rules) | No. of rotatable bonds | Volume |
|---|---|---|---|---|---|---|---|---|
| 9a | 6.36 | 106.34 | 552.09 | 9 | 2 | 2 | 8 | 491.83 |
| 10a | 6.41 | 106.34 | 552.09 | 9 | 2 | 2 | 8 | 491.83 |
| 13a | 5.79 | 115.57 | 547.67 | 10 | 2 | 2 | 9 | 503.84 |
| 11b | 5.77 | 106.34 | 570.50 | 9 | 2 | 2 | 8 | 472.37 |
Conclusions
Based on the performed docking study, the principal conclusion is that the halogen interaction is important for the binding mode of these 1,5-DS-T ligands. Moreover, some compounds such as 13a, 10a, 9a and 11b, can be proposed as anticancer molecules, being suitable candidates to perform an in vitro study. Although two possible interactions would arise from hydrogen bonding or sigma hold interactions, the present methods cannot be used to corroborate this. Thus, a DFT study on the active site of the protein is necessary (Koebel et al. 2016; Kurczab 2017). However, with the information obtained in the present study has been proposed a pharmacophoric model for each receptor, concluding that a plausible anticancer drug with ABL as receptor need some hydrophobic fragments to promote the interaction with the target surfaces, as well as a possible stacking interactions with them.
Acknowledgements
We thank to CONACyT for the fellowship 305150.
Funding
Carlos, C.-G. is grateful for financial support from CIC-UMSNH (14646).
Compliance with ethical standards
Conflict of interest
The authors declare no conflict of interest.
Footnotes
Publisher's Note
Springer Nature remains neutral with regard to jurisdictional claims in published maps and institutional affiliations.
Contributor Information
Carlos J. Cortés-García, Email: ccortes@umich.mx
Abel Suárez-Castro, Email: abel.suarez@umich.mx.
References
- Abelson HT, Rabstein LS. Lymphosarcoma: virus-induced thymic-independent disease in mice. Cancer Res. 1970;30:2213–2222. [PubMed] [Google Scholar]
- Auffinger P, Hays FA, Westhof E, Shing Ho P. Halogen bonds in biological molecules. Proc Natl Acad Sci USA. 2004;101:16789–16794. doi: 10.1073/pnas.0407607101. [DOI] [PMC free article] [PubMed] [Google Scholar]
- Baccarani M, Deininger MW, Rosti G, Hochhaus A, Soverini S, Apperley JF, Cervantes F, Clark RE, Cortes JE, Guilhot F, Hjorth-Hansen H, Hughes TP, Kantarjian HM, Kim DW, Larson RA, Lipton JH, Mahon FX, Martinelli G, Mayer J, Muller MC, Niederwieser D, Pane F, Radich JP, Rousselot P, Saglio G, Sabele S, Schiffer C, Silver R, Simonsson B, Steegmann JL, Goldman JM, Hehlmann R. European Leukemia Recommendations for the management of chronic myeloid leukemia. Blood. 2013;122:872–884. doi: 10.1182/blood-2013-05-501569. [DOI] [PMC free article] [PubMed] [Google Scholar]
- Ben-Neriah YQ, Daley G, Mes-Masson AN, Witte O, Baltimore D. The chronic myelogenous leukemia-specific P210 protein is the product of the bcr/abl hybrid gene. Science. 1986;233:212–214. doi: 10.1126/science.3460176. [DOI] [PubMed] [Google Scholar]
- Capdeville R, Buchdunger E, Zimmermann J, Matter A. Glivec (STI571, imatinib), a rationally developed, targeted anticancer drug. Nat Rev Drug Discov. 2002;1:403–502. doi: 10.1038/nrd839. [DOI] [PubMed] [Google Scholar]
- Casewit CJ, Colwell KS, Rappé AK. Application of a universal force field to organic molecules. J Am Chem Soc. 1992;114:10035–10046. doi: 10.1021/ja00051a041. [DOI] [Google Scholar]
- Cavallo G, Metrangolo P, Milani R, Pilati T, Priimagi A, Resnati G, Terraneo G (2016) The halogen bond. Chem Rev 116:2478–2601. https://doi.org/acs.chemrev.5b00484 [DOI] [PMC free article] [PubMed]
- Colicelli J (2011) ABL tyrosine kinases: evolution of function, regulation, and specificity. Science Signal 3:139 re6. 10.1126/scisignal.3139re6 [DOI] [PMC free article] [PubMed]
- Cortes-García CJ, Jácome A, Rentería A, Gámez R. Synthesis of 1,5-disubstituted tetrazoles containing a fragment of the anticancer drug imatinib via a microwave-assisted Ugi-azide reaction. Monat Chem. 2016;147:1277–1290. doi: 10.1007/s0070. [DOI] [Google Scholar]
- Cousins KR. Computer review of ChemDraw ultra 12.0. J Am Chem Soc. 2011;133:8388. doi: 10.1021/ja204075s. [DOI] [PubMed] [Google Scholar]
- Cowan-Jacob SW, Fendrich G, Floersheimer A, Furet P, Liebetanz J, Rummel G, Rheinberger P, Centeleghe M, Fabbro D, Manley PW. Structural biology contributions to the discovery of drugs to treat chronic myelogenous leukaemia. Biol Cryst. 2007;63:80–93. doi: 10.1107/S0907444906047287. [DOI] [PMC free article] [PubMed] [Google Scholar]
- Desogus A, Schenone S, Brullo C, Tintori C, Musumeci F. Bcr-Abl tyrosine kinase inhibitors: a patent review. Exp Opin Ther Pat. 2015;25:1–16. doi: 10.1517/13543776.2015.11012155. [DOI] [PubMed] [Google Scholar]
- Forli S, Huey R, Pique ME, Sanner MF, Goodsell DS, Olson AJ. Computational protein–ligand docking and virtual drug screening with the AutoDock suite. Nat Protoc. 2016;11:905–919. doi: 10.1038/nprot.2016.051. [DOI] [PMC free article] [PubMed] [Google Scholar]
- Frisch MJ, Trucks GW, Schlegel HB, Scuseria GE, Robb MA, Cheeseman JR, Scalmani G, Barone V, Mennucci B, Petersson GA, Nakatsuji H, Caricato M, Li X, Hratchian HP, Izmaylov AF, Bloino J, Zheng GJL, Hada M, Ehara MKR, Fukuda J, Hasegawa M, Ishida T, Nakajima Y, Honda O, Kitao H, Nakai T Vreven JA, Montgomery Jr. JE, Peralta F, Ogliaro M, Bearpark JJ, Heyd E, Brothers KN, Kudin VN, Staroverov R, Kobayashi J, Normand K, Raghavachari A, Rendell JC, Burant SS, Iyengar J, Tomasi M, Cossi N, Rega JM, Millam M, Klene JE, Knox JB, Cross V, Bakken C, Adamo J, Jaramillo R, Gomperts RE, Stratmann O, Yazyev AJ, Austin R, Cammi C, Pomelli JW, Ochterski RL, Martin K, Morokuma VG, Zakrzewski GA, Voth P Salvador JJ, Dannenberg S, Dapprich AD, Daniels Ö, Farkas JB, Foresman JV, Ortiz J, Cioslowski, Fox DJ (2009) Gaussian 09, revision E.01. Gaussian, Inc., Wallingford
- Gallardo S, Ocampo AL, Contreras CA, Chacón L. Synthesis and docking studies of the novel N-(2,2-di(1H-pyrrol-2-yl)ethyl)adamantane-1-carboxamide, a potential 11β-HSD1 inhibitor. J Chem Hindawi. 2014 doi: 10.1155/2014/294246. [DOI] [Google Scholar]
- Ghaaliq A, McCluskey A. Clinical tests: sensitivity and specificity. Continuing education in anaesthesia. Criti Care Pain. 2008;8:221–223. doi: 10.1093/bjaceaccp/mkn041. [DOI] [Google Scholar]
- Hantschel O, Superti-Furga G. Regulation of the C-ABL and BCR-ABL tyrosine kinases. Nat Rev Mol Cell Biol. 2004;5:33–44. doi: 10.1038/nrm1280. [DOI] [PubMed] [Google Scholar]
- Huang N, Schoichet BK, Irwing JJ. Benchmarking sets for molecular docking. J Med Chem. 2006;49:6789–6801. doi: 10.1021/jm0608356. [DOI] [PMC free article] [PubMed] [Google Scholar]
- Iwari A, Panigrahi SK (2007) HBAT: a complete package for analysing strong and weak hydrogen bonds in macromolecular crystal structures. In Silico Biol 6:651–661. https://content.iospress.com/articles/insilico-biology/isb00337 [PubMed]
- Kantarjian H, Sawyers C, Hochhaus A, Guilhot F, Schiffer C, Gambacorti-Passerini C, Neiderwieser D, Resta D, Capdeville R, Zoellner U, Talpaz M, Druker B. Hematologic and cytogenetic responses to imatinib mesylate in chronic myelogenous leukemia. N Engl J Med. 2002;346:645–652. doi: 10.1056/NEJMoa011573. [DOI] [PubMed] [Google Scholar]
- Kaplan W, Littlejohn TG. Swiss-PDB viewer (deep view) Brief Bioinform. 2001;2:195–197. doi: 10.1093/bib/2.2.195. [DOI] [PubMed] [Google Scholar]
- Koebel MR, Schmadeke G, Posner RG, Sirimulla S. AutoDock VinaXB: implementation of XBSF, new empirical halogen bond scoring function, into AutoDock Vina. J Cheminform. 2016 doi: 10.1186/s13321-016-0139-1. [DOI] [PMC free article] [PubMed] [Google Scholar]
- Koes, Camacho CJ. ZINCPharmer: pharmacophore search of the ZINC database. Nucl Acid Res. 2012;40:W409–W414. doi: 10.1093/nar/gks378. [DOI] [PMC free article] [PubMed] [Google Scholar]
- Kortagere S, Ekins S, Welsh WJ. Halogenated ligands and their interactions with amino acids: implications for structure-activity and structure-toxicity relationships. J Mol Graph Model. 2008;27:170–177. doi: 10.1016/j.jmgm.2008.04001. [DOI] [PubMed] [Google Scholar]
- Kumar H, Raj U, Gupta S, Tripathi R, Kumar P. Systemic review on chronic myeloid leukemia: therapeutic targets, pathways and inhibitors. J Nucl Med Radiat Ther. 2015;6:1–7. doi: 10.4172/2155-9619.1000257. [DOI] [Google Scholar]
- Kurczab R. The evaluation of QM/MM-driven molecular docking combined with MM/GBSA calculations as a halogen-bond scoring strategy. Act Crystallograph. 2017;B73:188–194. doi: 10.1107/S205252061700138X. [DOI] [PubMed] [Google Scholar]
- Lavecchia A. Machine-learning approaches in drug discovery: methods and applications. Drug Discov Today. 2014;20:318–331. doi: 10.1016/j.drudis.2014.10.012. [DOI] [PubMed] [Google Scholar]
- Lu X, Wang Y, Zhu W. Nonbonding interactions of organic halogens in biological systems: implications for drug discovery and biomolecular design. Phys Chem Chem Phys. 2010;12:4543–04551. doi: 10.1039/B926326H. [DOI] [PubMed] [Google Scholar]
- Morris GM, Goodsell DS, Halliday RS, Huey R, Hart WE, Belew RK, Olson AJ. Automated docking using a Lamarckian genetic algorithm and an empirical binding free energy function. J Comput Chem. 1998;19:1639–1662. doi: 10.1002/(SICI)1096-987X(19981115)19:14<1639::AID-JCC10>3.0.CO;2-B. [DOI] [Google Scholar]
- Neochoritis CG, Zhao T, Dömling A. Tetrazoles via multicomponent reactions. Chem Rev. 2019;119:1970–2024. doi: 10.1021/acs.chemrev.8b00564. [DOI] [PMC free article] [PubMed] [Google Scholar]
- O’Hare T, Shakespeare WC, et al. AP24534, a pan-BCR-ABL inhibitor for chronic myeloid leukemia, potently inhibits the T315I mutant and overcomes mutation-based resistance. Cancer Cell. 2009;16:401–412. doi: 10.1016/j.ccr.2009.09.028. [DOI] [PMC free article] [PubMed] [Google Scholar]
- Pemovska T, Johnson E, Kontro M, Repasky GA, Chen J, Wells P, Cronin CN, McTigue M, Kallioniemi O, Porkka K, Murray BW, Wennerberg K. Axitinib effectively inhibits BCR-ABL1 (T315I) with a distinct binding conformation. Nature. 2015;5:102–105. doi: 10.1038/NATURE14119. [DOI] [PubMed] [Google Scholar]
- Pires DEV, Blundell TL, Ascher DB. pKCSM: predicting small-molecule pharmacokinetic properties using graph-based signatures. J Med Chem. 2015;58:4066–4072. doi: 10.1021/acs.jmedchem.5b00104. [DOI] [PMC free article] [PubMed] [Google Scholar]
- Regier A, Khuu P, Oishi K, Shing Ho P. Halogen bonds as orthogonal molecular interactions to hydrogen bonds. Nat Chem. 2009;1:74–79. doi: 10.1038/nchem.112. [DOI] [PubMed] [Google Scholar]
- Rose PW, Prlic A, Bi C, Bluhm WF, et al. The RCSB protein Data Bank: views of structural biology for basic and applied research and education. Nucl Acids Res. 2015;43:345–356. doi: 10.1093/nar/gku1214. [DOI] [PMC free article] [PubMed] [Google Scholar]
- Sanner MF. Python: a programming language for software integration and development. J Mol Graph Model. 1999;17:57–61. doi: 10.1016/S1093-3263(99)99999-0. [DOI] [PubMed] [Google Scholar]
- Sirimulla S, Bailey JB, Vegesna R, Narayan M. Halogen interactions in protein-ligand complexes: implications of halogen bonding for rational drug design. J Chem Inf Model. 2013;53:2781–2791. doi: 10.1021/ci400257k. [DOI] [PubMed] [Google Scholar]
- Swain M. Chemicalize.org. J Chem Inf Model. 2012;52:613–615. doi: 10.1021/ci300046g. [DOI] [Google Scholar]
- Triballeau N, Acher F, Brabet I, Pin JP, Bertrand HO. Virtual screening workflow development guided by the “receiver operating characteristic” curve approach. Application to high-throughput docking on metabotropic glutamate receptor subtype 4. J Med Chem. 2005;48:2534–2547. doi: 10.1021/jm049092j. [DOI] [PubMed] [Google Scholar]
- Vardhan S, Sahoo SK. In silico ADMET and molecular docking study on searching potential inhibitors from limonoids and triterpenoids for COVID-19. Comput Biol Med. 2020;124:103936. doi: 10.1016/j.compbiomed.2020.103936. [DOI] [PMC free article] [PubMed] [Google Scholar]
- Von Bubnoff N, Duyster J. Chronic myelogenous leukemia: treatment and monitoring. Dtsch Arztebl Int. 2010;107:114–121. doi: 10.3238/arztebl.2010.0114. [DOI] [PMC free article] [PubMed] [Google Scholar]
- Wu P, Nielsen TE, Clausen M. Small-molecule kinase inhibitors: an analysis of FDA-approved drugs. Drug Discov Today. 2016;21:5–10. doi: 10.1016/j.drudis.2015.07.008. [DOI] [PubMed] [Google Scholar]
- Yang JM, Chen CCJ. GEMDOCK: a generic evolutionary method for molecular docking. Proteins. 2004;55:288–304. doi: 10.1002/prot.20035. [DOI] [PubMed] [Google Scholar]
- Zhang J, Wang S, Ba Y, Xu Z. Tetrazole hybrids with potential anticancer activity. Eur J Med Chem. 2019;178:341–351. doi: 10.1016/j.ejmech.2019.05.071. [DOI] [PubMed] [Google Scholar]
- Zhou T, Parillon L, Li F, Wang Y, Keats J, Lamore S, Xu Q, Shakespeare W, Dalgarno D, Zhu X. Crystal structure of the T315I mutant of Abl kinase. Chem Biol Drug Des. 2007;70:171–181. doi: 10.1111/j.1747-0285.2007.00556.x. [DOI] [PubMed] [Google Scholar]