

Abstract
As the Watson–Crick faces of nucleobases are protected in dsDNA, it is commonly assumed that deleterious alkylation damage to the Watson–Crick faces of nucleobases predominantly occurs when DNA becomes single-stranded during replication and transcription. However, damage to the Watson–Crick faces of nucleobases has been reported in dsDNA in vitro through mechanisms that are not understood. In addition, the extent of protection from methylation damage conferred by dsDNA relative to ssDNA has not been quantified. Watson–Crick base pairs in dsDNA exist in dynamic equilibrium with Hoogsteen base pairs that expose the Watson–Crick faces of purine nucleobases to solvent. Whether this can influence the damage susceptibility of dsDNA remains unknown. Using dot-blot and primer extension assays, we measured the susceptibility of adenine-N1 to methylation by dimethyl sulfate (DMS) when in an A-T Watson–Crick versus Hoogsteen conformation. Relative to unpaired adenines in a bulge, Watson–Crick A-T base pairs in dsDNA only conferred ∼130-fold protection against adenine-N1 methylation, and this protection was reduced to ∼40-fold for A(syn)-T Hoogsteen base pairs embedded in a DNA-drug complex. Our results indicate that Watson–Crick faces of nucleobases are accessible to alkylating agents in canonical dsDNA and that Hoogsteen base pairs increase this accessibility. Given the higher abundance of dsDNA relative to ssDNA, these results suggest that dsDNA could be a substantial source of cytotoxic damage. The work establishes DMS probing as a method for characterizing A(syn)-T Hoogsteen base pairs in vitro and also lays the foundation for a sequencing approach to map A(syn)-T Hoogsteen and unpaired adenines genome-wide in vivo.
Keywords: . DNA dynamics, sequencing, m1A, AlkB, echinomycin, DNA damage, DNA methylation, DNA repair, DNA structure, DNA sequencing, alkB, DNA dynamics, echinomycin, N1-methylated adenine
The Watson–Crick faces of nucleobases are tucked in the interior of the DNA double helix, where they are largely inaccessible to solvent, shielded by Watson–Crick hydrogen bonding, and protected from endogenous and environmental agents that may cause various deleterious forms of alkylation damage (1–3). Yet alkylation damage to the Watson–Crick faces of nucleobases does occur in nature (4–9) and can result in base modifications (Fig. 1A) that prevent Watson–Crick pairing and block or interfere with DNA replication. A variety of damage repair enzymes have evolved to address these lesions (7, 10), which, if left unrepaired, can be highly cytotoxic and/or mutagenic (4, 11).
Figure 1.
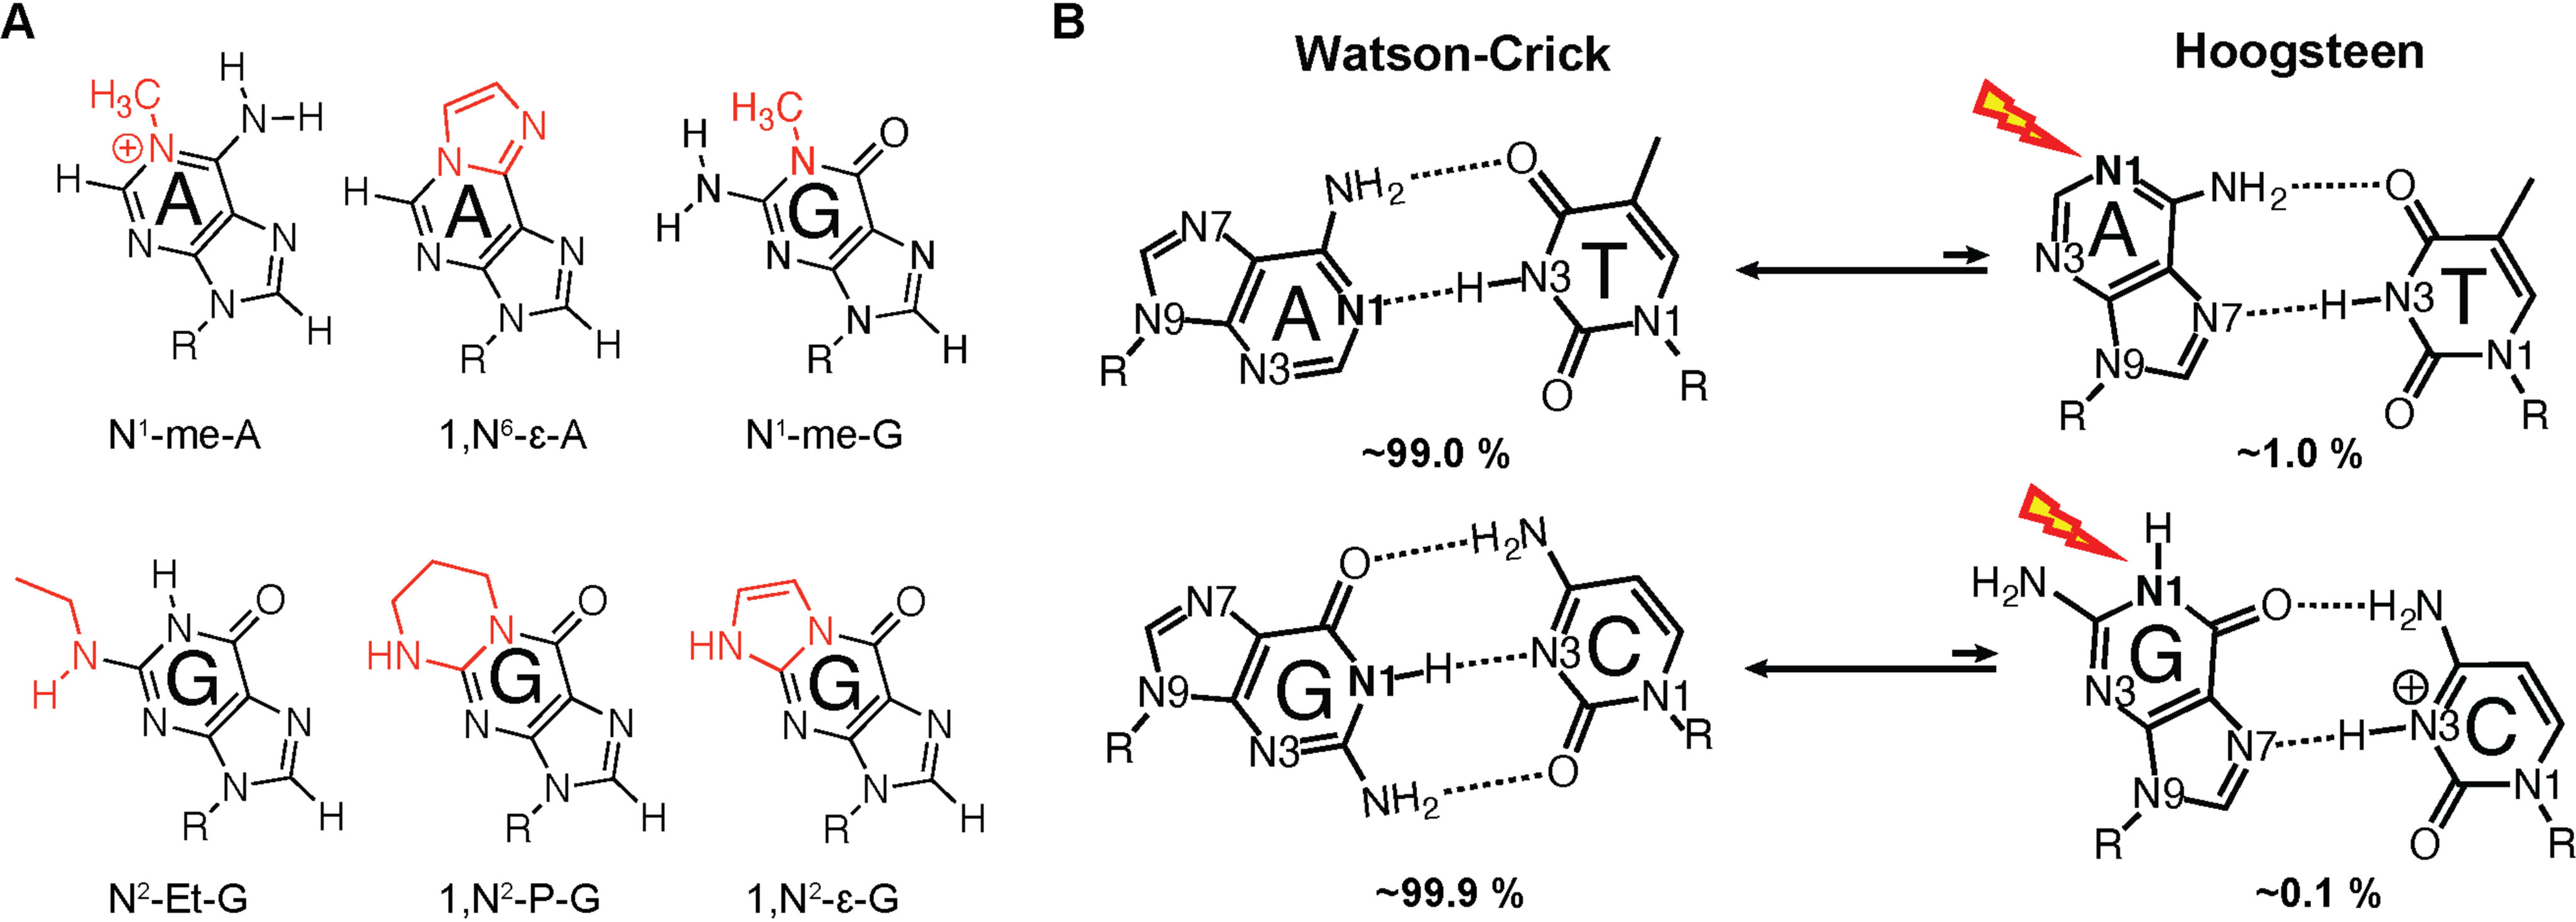
Proposed Hoogsteen-mediated alkylation damage to the Watson–Crick face of nucleotide bases. A, DNA adducts targeting Watson–Crick faces of purine bases: N1-methyladenine, 1,N6-ethenoadenine,N1-methylguanine, N2-ethylguanine, 1,N2-propanoguanine, and 1,N2-ethenoguanine. B, exchange between Watson–Crick and Hoogsteen bps and proposed Hoogsteen-mediated alkylation damage to Watson–Crick face of purines.
It is generally accepted that alkylation damage to the Watson–Crick faces of nucleobases by endogenous and environmental agents as well as anti-cancer therapies (5, 6, 12) occurs primarily during replication and transcription, when the DNA is transiently single-stranded (4). In vitro studies have shown that Watson–Crick hydrogen bonding causes differences in the reactivity profiles of ssDNA and dsDNA such that alkylation products at nitrogen functional groups involved in hydrogen bonding (e.g. adenine-N1 and cytosine-N3) are diminished in dsDNA relative to ssDNA, making guanine-N7 and adenine-N3 the most reactive sites in dsDNA (9, 13, 14). Moreover, in prokaryotes, the activities of enzymes that repair alkylation damage have been linked to the process of DNA replication (4, 15, 16). However, no clear correlation between human ABH2 and ABH3 expression and cell proliferation has been established (4, 17). In addition, certain enzymes can repair alkylation damage to the Watson–Crick faces of nucleotide bases in the context of dsDNA (18, 19). Thus, it remains plausible that alkylation products targeting the Watson–Crick faces accumulate and are repaired in a DNA replication–independent manner.
Based on prior studies, it is also clear that the Watson–Crick faces of nucleobases in dsDNA are indeed accessible to alkylation damage by reagents such as dimethyl sulfate (DMS) (13), methyl methanesulfonate (14), ethylnitrosourea (9), and formaldehyde (20) in vitro. However, the mechanisms that underlie this phenomenon are poorly understood. Furthermore, the degree to which dsDNA protects Watson–Crick faces of nucleobases from alkylation damage relative to ssDNA has not been rigorously quantified. This is important, given that the dsDNA is the dominant form of DNA in vivo, and that even if the reactivity were 1000-fold lower for dsDNA versus ssDNA, damage to dsDNA could still be a substantial source of alkylation damage as the abundance of the dsDNA exceeds that of ssDNA by an even greater amount.
In addition to becoming single-stranded, accessibility to the Watson–Crick face in duplex DNA has also been proposed to arise from alternative short-lived low-abundance conformational states that transiently expose nucleobases to solvent (9). It has long been established that in duplex DNA, Watson–Crick base pairs can spontaneously open and form conformations in which the otherwise buried and hydrogen-bonded imino protons can exchange with solvent (21). Based on hydrogen exchange measurements in vitro in naked duplexes, the abundance of the base-opened state is exceptionally low, on the order of 10−5. A potentially more abundant conformational state that can increase the susceptibility of dsDNA to Watson–Crick face damage even further is the Hoogsteen conformation (22–25). A(syn)-T and G(syn)-C+ Hoogsteen bps form spontaneously in canonical dsDNA by flipping the purine bases 180° from an anti to syn conformation, leaving the Watson–Crick faces of the purine base exposed to solvent (Fig. 1B).
Hoogsteen-mediated alkylation damage to dsDNA could be substantial when considering that they form robustly across different DNA sequence and structural contexts with an abundance (0.1–5%) that exceeds the base open conformation by at least 2 orders of magnitude (21). Based on in vitro measurements, there are millions of transient Hoogsteen bps in the human genome at any given time (24). Moreover, Hoogsteen bps can become the dominant conformation in DNA-protein and DNA-drug complexes (26–31). However, little is known regarding the vulnerability of dsDNA to damage when in the Hoogsteen conformation.
Here, we tested the hypothesis that adenine-N1 in the A(syn)-T Hoogsteen bp in dsDNA is more reactive to methylation by DMS as compared with A(anti)-T Watson–Crick bps. In ssDNA, adenine-N1 is 10-fold more reactive than adenine-N3, and the major adenine DMS methylation product is m1A (32). In contrast, because adenine-N1 is protected in Watson–Crick bps in dsDNA, the major adenine DMS methylation product is m3A (14, 32). Therefore, we hypothesized that A-T Hoogsteen bps in dsDNA would shift the reactivity from adenine-N3, which is exposed in both the Watson–Crick and Hoogsteen bps, to the more reactive adenine-N1, which is only exposed in the Hoogsteen conformation. In addition to providing insights into the potential role of Hoogsteen bps in DNA damage, this unique reactivity signature could also provide a means by which to discriminate Hoogsteen versus Watson–Crick bps in vitro and possibly in vivo using sequencing-based approaches. Using DMS as the methylating agent allowed us to investigate the alkylation susceptibility of Hoogsteen bps and also to develop a methodology for detecting Hoogsteen bps, given the well-established utility of DMS in mapping nucleic acid structure in vitro and in vivo (33–37).
Given that N1-me-A (m1A) (Fig. 1A), the product of N1-methylation of adenine, is a highly toxic lesion that blocks Watson–Crick pairing and DNA replication (4–6, 12), a variety of repair enzymes have evolved to address this lesion. m1A is repaired by α-ketoglutarate–dependent dioxygenase (AlkB) (10, 38, 39), and its human analogs ABH2 and ABH3 (17, 40) via oxidative demethylation. Our methodology for detecting m1A takes advantage of AlkB-mediated repair to enhance the specificity of m1A detection.
Our results reveal a mechanism for damaging Watson–Crick faces of DNA via A-T Hoogsteen bps without the need for melting dsDNA and also establish the utility of DMS probing in characterizing A(syn)-T Hoogsteen base pairs in addition to unpaired adenines in dsDNA in vitro. This work also lays the foundation for a new sequencing approach to map Hoogsteen and unpaired nucleotides genome-wide in vivo.
Results
Assaying the specificity of the m1A antibody
We developed an antibody-based rescue-coupled dot-blot assay to specifically detect and quantify m1A following treatment of DNA oligonucleotides with DMS. Our assay integrates aspects of the m1A-MaP strategy used previously to map the m1A RNA methylome (41). It uses the anti-m1A mAb (anti-m1A mAb, MBL International) (42) to specifically detect m1A. This antibody has previously been shown to specifically bind m1A and to discriminate against noncognate nucleosides and nucleobases, including m6A, m1G, m2G, m7G, and unmethylated nucleosides, which bind with >1000-fold weaker affinity (42, 43). The antibody has been shown to cross-react with the m7G-ppp-A extended cap structure in mRNA (44). However, this is of no consequence for our studies, which are focused on DNA oligonucleotides lacking this cap structure.
Prior studies have not tested the antibody specificity against m3A, which is a major adenine DMS methylation product in dsDNA. Due to its chemical instability, it is currently infeasible to obtain oligonucleotide containing m3A. We therefore used the m3A nucleobase in competition-based dot-blot assays to test the binding specificity of the antibody against the m3A. The same assay was also used to verify binding specificity against m7G, which is another major DMS product of dsDNA. In agreement with prior studies (42, 43), the antibody discriminates against m7G to which it binds with >625-fold weaker affinity relative to m1A (Fig. 2A). Although to a smaller degree, the antibody also discriminated against m3A to which it binds with >25-fold weaker affinity relative to m1A.
Figure 2.

Sensitive detection of m1A using a dot-blot assay coupled to specific rescue. A, competition-based dot-blot assay for assessing m1A antibody specificity. Shown are the dsDNA oligonucleotides used in the competition-based dot-blot assay along with the raw dot-blot data. m1A is highlighted in red. 50 pmol of the dsDNA was blotted on the membrane followed by incubation with the m1A antibody premixed with the indicated amount of the competitor nucleobases. B, specific DMS-induced m1A detection using a rescue-coupled dot-blot assay. Shown are the ssDNA oligonucleotides with (ss+) and without (ss−) a single adenine residue (highlighted in red) along with the raw dot-blot data following 15-min DMS (75 mm) treatment pre- and post-AlkB repair and Dimroth reaction, along with their respective methylene blue loading controls (in gray). C, DNA secondary structure–independent detection of m1A. Shown are the DNA oligonucleotide containing m1A (highlighted in red) and the corresponding raw dot-blot data for ssDNA and dsDNA. D, specific DMS-induced m1A detection at Watson–Crick A-T bps and unpaired bulge adenines. Shown are the DNA oligonucleotides containing two adenines in bulge conformation (hpbulge) (highlighted in red) or in an A-T Watson–Crick (hpTA) along with the raw dot-blot data following 15-min DMS (75 mm) treatment pre- and post-AlkB repair and Dimroth reaction. Also shown are their respective methylene blue loading controls (shaded gray).
To further test whether the anti-m1A mAb can discriminate m1A from other DMS products of ssDNA, including the major products m7G and m3C and the minor products m3G, O6-methylguanine, m3T, and O2-methylthymine (32, 45), we subjected (see “Experimental procedures”) ssDNA with (ss+) or without (ss−) a single adenine nucleotide to DMS treatment (Fig. 2B). As expected, ss+ showed a clear dot-blot signal following DMS treatment, whereas ss− showed no detectable signal (Fig. 2B).
To further verify that the signal observed in ss+ is predominantly due to m1A and not m3A, we subjected the DMS-treated ss+ oligonucleotides to AlkB treatment. AlkB repairs m1A in both ssDNA and dsDNA but does not repair m3A (10, 15, 46). As expected, we did not observe any detectable signal from ss+ following AlkB treatment (Fig. 2B). As a final confirmation, we incubated the DMS-treated ss+ in a buffer and temperature condition that favors the Dimroth rearrangement (47, 48), which specifically converts m1A, but not m3A, into m6A and observed no m1A signal in the dot-blot assay (Fig. 2B).
These results indicate that DMS methylates adenine-N1 in ssDNA, that the antibody enables detection of m1A with undetectable cross-reactivity to m3A or other DMS products under these conditions, and that AlkB treatment and the Dimroth rearrangement can be used to assess the specificity of m1A detection.
The anti-m1A mAb antibody binds m1A in dsDNA
A prior study showed that an m6A antibody bound to m6A in dsRNA with >10-fold weaker affinity as compared with m6A in single-stranded RNA (49). We therefore compared the ability of the anti-m1A mAb antibody to recognize and bind m1A in dsDNA versus ssDNA. Unlike for m6A, we found that the m1A antibody binds to m1A in dsDNA with only ∼2-fold lower affinity relative to m1A in ssDNA (Fig. 2C). However, it should be noted that the relative affinity to ssDNA and dsDNA does vary with sequence context, with the affinity apparently becoming weaker for dsDNA when surrounding the m1A with stable G-C bps (data not shown).
m1A detection following DMS treatment of bulge adenines
We benchmarked the AlkB rescue-coupled dot-blot assay by quantifying the m1A adduct following DMS treatment of two DNA duplexes containing two adenine residues (Fig. 2D) that are either exposed in a bulge (hpbulge) or protected by forming two canonical Watson–Crick A-T bps (hpTA). Hairpin constructs were used to increase duplex stability and minimize any reactivity from ssDNA due to melting or from having one strand in excess when using duplexes. A thymine-rich apical loop was used to enhance the DNA cross-linking efficiency to the nylon membrane in the dot-blot assay (see “Experimental procedures”).
For these experiments, we sought to work under conditions of single-hit kinetics in which a given DNA molecule reacts no more than once with DMS (50–52). This was important for two reasons. First, this is necessary to ensure that the observed reactivity arises from the parent oligonucleotide and not from secondary methylation of singly methylated DNA. For example, production of m7G could destabilize a neighboring A-T bp, increasing its susceptibility to form m1A and resulting in a spurious m1A signal. Second, duplexes with variable degrees of methylation may have different stabilities, and this could also bias their ability to bind the antibody in the dot-blot assay. Having said that, any differences in reactivity due to either primary or secondary methylation seen for our highly controlled Watson–Crick versus Hoogsteen dsDNAs (see below) would have to originate from intrinsic differences in damage susceptibility between the Watson–Crick and Hoogsteen conformation.
Experiments were performed using 75 mm DMS for two reaction times (5 and 15 min), and the methylation stoichiometry was assessed using MALDI MS (53). Based on the MALDI analysis of all DMS-treated samples, the major product for the 5-min reaction was singly methylated DNA, whereas for the 15-min reaction, peaks corresponding to doubly methylated DNA were also observed (Fig. S1). We present results from both reaction conditions because the 15-min reaction time gave a stronger signal/noise ratio and because using the two data sets allows for more robust quantification of any differences in reactivity due to primary or secondary methylation between the Watson–Crick and Hoogsteen conformations. As will be detailed below, similar trends were observed for both reaction conditions.
In the dot-blot assay, a strong signal was observed for the DMS-treated hpbulge, indicating that the dinucleotide adenine bulge is accessible to DMS methylation (Fig. 2D). Moreover, no signal was detected post Dimroth reaction and following AlkB treatment, confirming that the signal primarily reflects the m1A product (Fig. 2D). Similar results were obtained for a different DNA sequence (Fig. S2). We also verified that the diminishment in m1A signal observed upon AlkB treatment results from the specific demethylation of m1A by performing the AlkB reaction in the absence of co-factors essential for catalytic activity and observed no detectable decrease in m1A signal (Fig. S2).
DMS-treated dsDNA produces m1A likely through an alternative DNA conformation
Relative to the unpaired adenine bulge, the m1A signal was reduced substantially by as much as 130-fold for the Watson–Crick hpTA duplex (Fig. 2D and Fig. S5). This residual signal is unlikely to arise from cross-reactivity with m3A or unmodified adenine, given that no signal was detected following AlkB treatment (Fig. 2D and Fig. S5), or from cross-reactivity with other bases and/or their DMS methylation adducts, given that no signal was detectable in the DMS-treated ss− negative control (Fig. 2B).
Alternatively, the residual signal could correspond to m1A arising from methylating dsDNA, which has been reported previously (13). Here, our quantification of the signal allows us to consider alternative conformational states that could be susceptible to damage. The m1A signal was reduced by up to 130-fold for the hpTA duplex relative to hpbulge. However, we would have expected ∼100,000-fold reduction if m1A arose from methylating the base open state, which has an abundance of ∼10−5 (21). Likewise, the signal is unlikely to arise from methylating the melted hairpin, which is estimated to have an abundance of 10−7 to 10−6 (Table S1). The residual reactivity could arise from transient A-T Hoogsteen bps, which have an abundance of ∼1%, assuming that the DMS reactivity of the adenine-N1 is similar in the Hoogsteen and bulge conformations. There could also be other hitherto poorly characterized conformational states in dsDNA that increase the susceptibility of adenine-N1 to methylation damage. Finally, whereas the residual signal was observed under single-hit kinetics conditions, we cannot entirely rule out that at least some of the signal reflects a minority of secondary methylated species that form in low abundance under these reaction conditions and that fall outside the detection limit of MALDI.
Echinomycin-DNA complexes as models for Watson–Crick and Hoogsteen base pairs
Assessing the reactivity of adenine-N1 in an A-T Hoogsteen bp requires the preparation of dsDNA samples containing the A-T Hoogsteen bp as the dominant conformation. To this end, we prepared complexes between dsDNA and echinomycin, an antibiotic with anti-tumor activity (54, 55) that binds to CpG steps (CG) in dsDNA. Prior studies have shown that when two echinomycin molecules (or its close analog triostin A) bind to DNA sequences containing a TpA step sandwiched between two CpG-binding sites (d(CGTACG)), the TpA step forms two tandem A-T Hoogsteen bps (29, 56–60). Based on the crystal structure of the echinomycin-DNA complex (59) (see Fig. 7), adenine-N1 in the A-T Hoogsteen bps is solvent-accessible and not blocked by the bound echinomycin molecules and, therefore, should be accessible to DMS methylation. Although the complex only allows us to assess the reactivity of tandem A-T Hoogsteen bps, and not the Hoogsteen bps flanked by Watson–Crick bps that occur transiently in naked DNA duplexes, tandem Hoogsteen bps are common in DNA-protein and DNA-drug complexes (reviewed in Ref. 26). As a negative control, we also examined a complex in which the TpA step is replaced by an ApT step, which retains two A-T Watson–Crick bps even following echinomycin binding (61).
Figure 7.

Solvent accessibility of purine-N1 in A-T and G-C Hoogsteen bps in crystal structures of DNA-protein and DNA-drug complexes. Shown are the crystal structures of DNA-echinomycin complex (PDB code 1XVN) (59), DNA-p53 tumor suppressor protein complex (3IGL) (31), DNA-TATA box–binding protein complex (1QN3) (30), DNA-dcm-Vsr endonuclease complex (1ODG) (72), DNA-MATα2 homeodomain complex (1K61) (28), DNA-TnpA transposase complex (2A6O) (74), and nucleosome core particle (5AV8) (76). The surfaces of DNA and protein/drug are shown in gray and cyan, respectively. The adenine-N1 for A-T Hoogsteen or guanine-N1 for G-C+ Hoogsteen is shown in red and highlighted in a red circle. In the nucleosome core particle structure (PDB code 5AV8), residue DA-18 at chain I was manually flipped to a syn conformation using PyMOL and then subjected to the AMBER MD package (91) for energy minimization using AMBER ff99 force fields (92) as described previously (85).
We designed self-complementary hairpins (Fig. 3A) suitable for the dot-blot assay by elongating the core sequences of d(CGTACG) and d(CGATCG) previously shown to form Hoogsteen (29) and Watson–Crick (61) A-T bps, respectively, upon echinomycin or triostin A binding. Again, a thymine-rich apical loop was used to enhance the cross-linking efficiency to the nylon membrane (Fig. 3A).
Figure 3.

NMR experiments verifying formation of Hoogsteen and Watson–Crick bps upon drug binding. A, dsDNA oligonucleotides used in the NMR experiments. Shown are the reference dsDNA containing Watson–Crick (ds(s)AT) or Hoogsteen (ds(s)TA) bps as well as hairpin (hpAT and hpTA) and duplex (dsAT and dsTA) dsDNA used in the dot-blot assays. Dark blue sticks represent the echinomycin molecule and its binding site at the CpG step. A-T bps adopting the Hoogsteen or Watson–Crick conformation in the DNA-echinomycin complexes are highlighted in red and cyan, respectively. B, overlay comparing 2D [13C, 1H] HSQC NMR spectra of the aromatic region of DNA-echinomycin complexes for the reference dsDNA and the dsDNA used in the dot-blot assays. All spectra correspond to DNA-echinomycin complexes. For the AT-step DNA complexes, which contain Watson–Crick AT bps, resonances are only observed in the Watson–Crick region, not in the Hoogsteen region. In contrast, for the TA-step DNA complexes, which contain AT Hoogsteen bps, resonances were observed only in the Hoogsteen region and not in the Watson–Crick region.
Using NMR spectroscopy, we verified that the duplexes (Fig. 3A) do indeed bind to echinomycin, as suggested by marked chemical shift perturbations in free DNA resonances upon intercalative binding of echinomycin (Fig. S3). To verify the A-T bp geometry in the TpA and ApT step complexes, we first prepared shortened versions of the duplexes (ds(s)TA and ds(s)AT) previously shown by NMR (60, 61) to form Hoogsteen and Watson–Crick bps, respectively, upon echinomycin binding, in which only the TpA or ApT step was selectively labeled with uniformly 13C/15N nucleotides (Fig. 3A). We observed the expected chemical shift signatures unique to A-T Hoogsteen bps (62, 63) in the TpA but not ApT step (Fig. 3B), including the downfield-shifted adenine-C8 (144.3 ppm) accompanying the flip of the adenine into a syn conformation. Using these spectra as reference for the Hoogsteen and Watson–Crick conformations, we were able to verify formation of the Hoogsteen and Watson–Crick bps in the hpTA, hpAT, dsTA, and dsAT sequences used in our dot-blot assay based on the presence or absence of Hoogsteen chemical shift signatures (Fig. 3B).
DMS-treated A-T Hoogsteen base pairs show enrichment in m1A relative to Watson–Crick base pairs
Next, we subjected the dsDNA oligonucleotides (Fig. 4A) to our dot-blot assay in the absence and presence of echinomycin. Following DMS treatment and quenching, the free DNA and DNA-echinomycin complexes were purified to remove residual 2-mercaptoethanol (β-ME), salt, and echinomycin. The methylated DNA was then divided into three aliquots; one aliquot was subjected to AlkB rescue and another to the Dimroth reaction, and a third aliquot was used for m1A quantification.
Figure 4.

Dot-blot assay showing m1A enhancement in echinomycin-induced A-T Hoogsteen bps. A, dsDNA oligonucleotides used in the dot-blot assay. The CG echinomycin-binding sites are underlined. The unpaired adenines in the bulge and the A-T bps that convert into the Hoogsteen conformation upon echinomycin binding are shown in red. B, a set of representative dot blots of free and echinomycin bound DNA under 15-min DMS (75 mm) treatment with and without AlkB repair and Dimroth reaction along with their respective methylene blue loading controls (shaded gray). C, quantification of dot-blot data for hpbulge, hpTA, and hpAT under 5-min DMS (75 mm) treatment. D, quantification of dot-blot data for three sets of DNA sequences under 15-min DMS (75 mm) treatment. The bar plots in C and D show the enhancement of the m1A signal between the DNA-echinomycin complexes and their free DNA counterparts. For hpbulge, the m1A enhancement is calculated with respect to free hpTA DNA. Shown are the average m1A enhancement from three independent DMS treatment replicates. Error bars, S.D. Statistical significance is calculated using the unpaired two-tailed parametric Student's t test with 95% confidence interval. *, p < 0.05; **, p < 0.01; ***, p < 0.001.
Once again, the unbound hpTA and hpAT Watson–Crick DNA duplexes showed a small but detectable m1A signal (Fig. 4B). The DNA-echinomycin complexes showed markedly different m1A signal intensity than the unbound DNA (Fig. 4B). To assess the impact of echinomycin binding on reactivity, we computed echinomycin-induced m1A enhancement as the ratio between the m1A signal of the dsDNA-echinomycin complex and its unbound dsDNA counterpart.
For the Watson–Crick hpAT dsDNA, echinomycin binding reduced the m1A signal ∼2–4-fold relative to the unbound hpAT DNA (Fig. 4, C and D). This could reflect quenching of transient Hoogsteen bps at these sites in the naked hpAT duplex upon echinomycin binding. It was previously proposed (64) that the dipole interaction between the quinoxaline group of echinomycin and its adjacent A-T bp does not favor a Hoogsteen bp when an ApT step is sandwiched between echinomycin-binding sites. Alternatively, the bound echinomycin may protect the bps neighboring the A-T and reduce secondary methylation of the A-T bps or even protect the A-T bps directly through nonspecific binding, thereby reducing m1A relative to the free duplex. Any secondary methylation would have to be sufficiently low in abundance to remain undetected by MALDI.
In contrast, for the Hoogsteen hpTA DNA, we observed ∼4-fold echinomycin-induced m1A enhancement (Fig. 4, C and D). Moreover, the enhancements were robustly observed across varying sequence contexts, in duplex and hairpin contexts, and for varying DMS incubation times (Fig. 4 (C and D) and Figs. S4 and S5). In all cases, the signal was severely attenuated following AlkB treatment or the Dimroth reaction, confirming that the signal mainly corresponds to the m1A product. These results show that at least for the DNA-echinomycin complexes studied here, adenine-N1 is more susceptible to DMS methylation in the Hoogsteen versus Watson–Crick conformation. However, these differences in reactivity may vary with ionic strength, sequence contexts, length of duplex, and different DNA-small molecule and DNA-protein complexes.
Relative to Watson–Crick bps, the m1A enhancement in the echinomycin-induced A-T Hoogsteen bps under single-hit kinetic conditions was ∼40-fold lower relative to the corresponding enhancement seen for unpaired bulge adenines in hpbulge (Fig. 4C, compare hpbulge with hpTA). This implies that adenine-N1 in an echinomycin-induced A-T Hoogsteen bp is 40-fold less reactive than unpaired adenine-N1. It is possible that the more constrained Hoogsteen conformation diminishes reactivity relative to unpaired adenines by sterically hindering the SN2 geometry required for DMS attack (13, 65). If this were the case, the reactivity observed for naked Watson–Crick duplexes (see Fig. 2D, hpTA) could not be explained by the transient Hoogsteen bps. As described above, it is also possible that echinomycin protects the DNA from primary or secondary methylation in the drug complex and therefore results in reduction of m1A relative to the free duplex, in which case the Hoogsteen reactivity in the complex underestimates its reactivity in naked DNA. If we assume that the reactivity of adenine-N1 in Hoogsteen is underestimated by 4-fold, given that echinomycin binding confers 2–4-fold protection to the Watson–Crick hpAT DNA (Fig. 4C), then the Hoogsteen reactivity would only be 10-fold lower than the unpaired adenine. At this level of reactivity, it is possible that some of the m1A signal seen in the naked DNA duplexes reflects transient A-T Hoogsteen bps.
AlkB-coupled primer extension reveals enrichment of m1A at Hoogsteen base pairs
To further confirm that the enhanced DMS reactivity seen in the echinomycin-hpTA complex arises from methylation of adenine-N1 specifically at the A-T Hoogsteen bps, and to set the foundation for a new sequencing strategy to detect adenine nucleotides in unpaired and Hoogsteen conformations, we performed primer extension on DMS-treated duplexes that form either Watson–Crick or Hoogsteen bps upon echinomycin binding, pre- and post-AlkB repair.
For Watson–Crick bps in the unbound DNA duplexes and in the dsAT-L-echinomycin complex, the main DMS methylation products (m3A and m7G) are expected to induce AlkB-insensitive stops in the primer extension assay. m3A is a highly toxic lesion that blocks DNA replication (5), and although m7G generally does not affect DNA replication, it is prone to spontaneous depurination to form an abasic site that blocks DNA replication (66), and consequently, it is typical to observe stops at unprotected guanines in primer extension assays (5, 67). In contrast, for the tandem Hoogsteen A-T bps in the dsTA-L-echinomycin complex, the DMS methylation product m1A is expected to induce AlkB-sensitive stops.
Because of the lower sensitivity relative to the dot-blot assay, a higher DMS concentration (150 mm) and longer reaction time (15 min) needed to be used in the primer extension assay (37, 68). Whereas these conditions likely fall outside the single-hit kinetics regime, the results from the dot-blot assay indicate that the relative trends in reactivity for the Hoogsteen and Watson–Crick bp are preserved between single-hit and multihit kinetics conditions.
As a positive control, we first verified that m1A efficiently terminates the Q5 High Fidelity DNA Polymerase (New England Biolabs Inc.) by subjecting two chemically synthesized dsDNA oligonucleotides with (dsm1A) or without (dsunmod) a single m1A to the primer extension stop assay. As expected, whereas the major product for dsunmod was full-length DNA, for dsm1A, the major product was DNA truncated immediately upstream of m1A (Fig. 5A). Furthermore, primer extension with AlkB-treated dsm1A resulted in full-length DNA as the main product. Thus, m1A can efficiently terminate the primer extension of this DNA polymerase, producing DNA products truncated one nucleotide before the m1A site.
Figure 5.

Primer extension stop assay on dsDNA containing m1A. A, dsDNA oligonucleotides with (dsm1A) and without (dsunmod) a chemically modified m1A (highlighted in red) and the corresponding 10% urea polyacrylamide gel showing the primer extension products with and without AlkB repair. The dashed line indicates the splicing of the gel. B, DNA oligonucleotides containing either two unpaired adenines (dsbulge-L) (highlighted in red) or two A-T Watson–Crick bps (dsTA-L) (highlighted in blue) and the corresponding gel showing primer extension products of these DNA duplexes after 15-min DMS (150 mm) treatment with and without AlkB repair. The methylated site of interest was identified by using both Sanger sequencing and a length marker (Fig. S6B). The results shown above were reproducible in three independent replicates.
To verify that the AlkB-coupled DMS primer extension assay can pinpoint unpaired adenines within the context of a dsDNA based on their unique adenine-N1 reactivity, we tested DNA duplexes similar to those used in the dot-blot assay containing either a dinucleotide adenine bulge (dsbulge-L, positive control) or two A-T Watson–Crick bps (dsTA-L, negative control) (Fig. 5B). For DMS-treated dsTA-L, the major primer extension product was the full-length DNA (Fig. 5B). Bands corresponding to products truncated at guanines and adenines could be observed when increasing exposure time during gel imaging. This is consistent with DMS-induced damage to Watson–Crick bps producing DNA replication–blocking lesions m7G and m3A (67, 69, 70). As expected, these bands were insensitive to the AlkB treatment. DMS-treated dsbulge-L showed a similar primer extension pattern as dsTA-L. However, two bands with 3–5-fold higher intensity as compared with dsTA-L were observed, corresponding to products truncated immediately before each of the two bulge adenines (Fig. 5B). These two bands were rescued following AlkB treatment, indicating that the polymerase stop can be attributed to m1A (Fig. 5B). These results establish the efficacy and robustness of the AlkB-coupled primer extension stop assay for detection of exposed adenine residues in duplex DNA at single-nucleotide resolution.
Finally, we performed the primer extension assay on DMS-treated echinomycin-dsDNA complexes. The dsDNA sequences used in these studies were elongated (dsTA-L and dsAT-L; see Fig. 6A) relative to those used in the dot-blot assay to allow for primer binding. For the unbound dsTA-L and dsAT-L duplexes, we observed the expected AlkB-insensitive products truncated immediately upstream of guanines and adenines (Fig. 6B). A similar pattern was also observed for the dsAT-L-echinomycin complex (Fig. 6B). In contrast, the band corresponding to the Hoogsteen site in the dsTA-L-echinomycin complex was highly sensitive to AlkB treatment (Fig. 6B, red box), indicating enrichment in m1A product at this site.
Figure 6.

Primer extension stop assay on DMS-treated free and echinomycin bound DNA. A, dsDNA oligonucleotides used in the primer extension assay. The CG echinomycin binding site is underlined. The unpaired adenines in the bulge and the A-T bps that convert into the Hoogsteen conformation upon echinomycin binding are shown in red. B, a representative 10% urea polyacrylamide gel showing the products of primer extension for DMS-treated and AlkB-repaired free and echinomycin bound DNA. Bands corresponding to adenine of interest are highlighted with rectangles. Nucleotides at which the methylation causes the polymerase stop and thus giving the signal for a given band are indicated on the side of the gel. The full gel is shown in Fig. S6A. The methylated site of interest (Hoogsteen site) was identified by using both Sanger sequencing and a 37-mer length marker (Fig. S6B). C, quantification of the m1A-induced polymerase stop frequency fm1A (fm1A = fm3A+m1A – fm3A) at the adenine of interest. D, quantification of the fraction of total stops attributable to m1A (m1A % = 1 − fm3A/fm3A+m1A) at the adenine of interest. C and D, the data represent the average of three independent DMS treatment replicates, and the uncertainty is reported as the S.D. (error bars). Statistical significance is calculated using the unpaired two-tailed parametric Student's t test with 95% confidence interval. ns, p > 0.05; *, p < 0.05; **, p < 0.01; ***, p < 0.001.
To quantify the m1A level in Hoogsteen versus Watson–Crick bps and compare band intensity across different samples, we quantified and normalized the data as follows. For each sample, the band intensity of the truncation product at the adenine of interest was normalized relative to the band intensity of the full-length product. This normalized value represents the polymerase stop frequency at the adenine of interest. For the DMS-treated (without AlkB repair) sample, polymerase stops can be induced by both m1A and m3A, so we define this normalized value in the DMS-treated sample as the polymerase stop frequency due to m1A and m3A (fm1A+m3A). In contrast, for the DMS-treated AlkB-repaired sample, the polymerase stop is induced by m3A, so we define the normalized value in the AlkB-repaired sample as the polymerase stop frequency due to m3A (fm3A). By subtracting these two quantities, we obtain the m1A-induced polymerase stop frequency (fm1A = fm3A+m1A – fm3A).
As shown in Fig. 6C, the unbound free DNA (dsTA-L and dsAT-L) showed some residual m1A signal, which is consistent with the results from the dot-blot assay (Fig. 4B and Fig. S4A). The fm1A value for the unpaired adenine in dsbulge-L was 7-fold higher relative to the Watson–Crick A-T bp in unbound DNA, indicating that the unpaired adenine-N1 is 7-fold more reactive toward DMS as compared with adenine-N1 in a Watson–Crick bp under these reaction conditions. The 7-fold enhancement is in reasonable agreement with the ∼30-fold (see Fig. 4D, hpbulge) enhancement observed in the dot-blot assay for the 15-min DMS reaction, especially when considering that a higher DMS concentration was used in the primer extension assay, which could disproportionately increase the apparent reactivity of the Watson–Crick duplex due to secondary methylation.
For the Hoogsteen A-T bp in the dsTA-L-echinomycin complex, the fm1A was ∼3-fold higher than the Watson–Crick A-T bp in its free DNA control (Fig. 6C), which is consistent with the dot-blot results for the 15-min DMS reaction (Fig. 4D). This provides additional evidence that the reactivity of adenine-N1 in the Hoogsteen versus Watson–Crick conformation does not vary considerably between single-hit and multihit kinetic conditions. In contrast, the dsAT-L-echinomycin complex did not show significant enhancement in m1A signal relative to the free DNA. Due to the low signal/noise ratio, it was not possible to ascertain whether echinomycin binding confers a small degree of protection, as observed in the dot-blot assay (Fig. 6C). These results further confirm the higher reactivity of adenine-N1 in Hoogsteen versus Watson–Crick A-T conformations.
To compare the relative reactivity of adenine-N1 versus adenine-N3 in Watson–Crick versus Hoogsteen bps, we calculated the proportion of total stops attributable to m1A at the adenine of interest (m1A % = 1 − fm3A/fm3A+m1A). As mentioned above, fm3A+m1A and fm3A were obtained from the DMS-treated and AlkB-repaired samples, respectively. As expected, for the naked DNA duplexes (dsTA-L and dsAT-L), the majority (80–90%) of the product was m3A, whereas for the unpaired adenine bulge, the methylation reactivity shifted from adenine-N3 to adenine-N1, with ∼60% of the product corresponding to m1A (Fig. 6D). This is consistent with the DMS methylation pattern observed in the canonical dsDNA (14) and the ssDNA (32), respectively. Relative to the Watson–Crick bps, the echinomycin–induced Hoogsteen in dsTA-L-echinomycin complex also shifted reactivity toward m1A, which accounted for 50% of the total adenine product, similar to that seen for unpaired adenines. In contrast, no statistically significant changes in reactivity were observed upon binding of echinomycin to dsAT-L. Thus, Hoogsteen bps shift the adenine DMS methylation patterns from m3A to m1A.
Taken together, these results show that Hoogsteen A-T bps increase the susceptibility of dsDNA to m1A damage, and the Hoogsteen sites can be identified as m1A sites in the AlkB-coupled primer extension stop assay at single nucleotide resolution.
Discussion
Our results show that dsDNA is particularly vulnerable to damage when bps form the Hoogsteen conformation. For the echinomycin-induced tandem A-T Hoogsteen bps, the susceptibility of adenine-N1 to methylation was only 10–40-fold lower than unpaired adenine residues. The enhanced adenine-N1 reactivity in Hoogsteen bps relative to Watson–Crick observed in vitro using our model oligonucleotides may differ in the intracellular environment, where the ionic strength is higher and where the DNA is subject to supercoiling and torsional stress. Further in vivo studies are necessary to quantify the enhanced reactivity of adenine-N1 for Hoogsteen bps in cells and to assess whether Hoogsteen bps provide alternative states for damaging DNA in vivo.
Based on available crystal structures, solvent-exposed A-T and G-C+ Hoogsteen bps can also be found in protein-DNA complexes, such as the tumor suppressor protein p53 (31) and the general transcription factor TBP (30, 71), which induce the A-T or G-C+ Hoogsteen bps, respectively, as the dominant conformation at specific sites (27, 28, 30, 31, 72–75) (Fig. 7). Some of these Hoogsteen bps have been verified under solution conditions (27, 75). Structure modeling also reveals that a hypothetical A-T Hoogsteen bp forming in the context of the nucleosome core particle (76) would also expose adenine-N1 to solvent. Further studies are needed to investigate whether such Hoogsteen bps in protein-DNA complexes (77, 78) are also vulnerable to Hoogsteen-mediated alkylation damage.
The primer extension approach presented in this work provides a method for robustly identifying adenine nucleotides in an A-T Hoogsteen or unpaired conformation in protein-DNA complexes in vitro under solution conditions that can otherwise be difficult to visualize using other solution-state methods, such as NMR (71). When combined with high-throughput sequencing, this approach could potentially be extended to map these structures genome-wide in vivo at single-nucleotide resolution. In this regard, it is important to note that there have been many failed attempts to detect Hoogsteen bps in DNA-echinomycin complexes based on enhanced reactivity with a variety of reagents (69, 79–81). However, none of these studies employed DNA sequences that were independently verified to contain Hoogsteen bps using techniques such as solution NMR. In addition, some of the chemical reagents used did not target sites that would be uniquely reactive in the Hoogsteen conformation (69, 79, 80). One study (82) showed that binding of echinomycin to DNA induced hyperreactivity to diethyl pyrocarbonate both at the echinomycin-binding sites and at a distal region containing alternating A-T bps. It was proposed that the hyperreactivity could result from A-T Hoogsteen bps, which would expose adenine-N3 in the major groove and potentially cause enhanced reactivity to diethyl pyrocarbonate. It remains plausible that the reactivity seen by Mendel and Dervan (82) did arise in part from enhanced transient Hoogsteen bps, especially in light of recent NMR studies showing enhanced Hoogsteen breathing in an A-T–rich region in a DNA-echinomycin complex (60). The DMS approach presented here could be applied to confirm the existence of enhanced transient Hoogsteen bps in these sequence contexts as well.
The high reactivity of adenine-N1 in the A-T Hoogsteen bp also has important implications for a growing number of studies that employ DMS to probe the secondary structure of RNA in vitro and in vivo (36, 68, 83, 84). Whereas it is typically assumed that high DMS reactivity corresponds to unpaired nucleotides, in RNA, Hoogsteen G-A and G-G mismatches with syn purine bases are common (71, 85) and could be an additional source of high DMS reactivity in addition to unpaired nucleotides.
Whereas we have focused on A-T Hoogsteen bps, G-C+ Hoogsteen bps could similarly provide mechanisms for inflicting damage to the Watson–Crick face of the guanosine base to produce many known forms of damage (Fig. 1A), including m1G, which occurs in vivo albeit in lower abundance than m1A and is highly mutagenic (18). It is interesting to note that the G-C+ Hoogsteen bp also occurs with ∼10-fold lower abundance relative to the A-T Hoogsteen bp (24, 25). Whereas we have focused on alkylation of purine bases, Hoogsteen bps could also play roles in other forms of damage. For example, Hoogsteen bps have already been proposed to grant formaldehyde access to neighboring G-C Watson–Crick bps, resulting in the hydroxymethylation of the cytosine amino nitrogen in dsDNA (86). Beyond Hoogsteen bps in dsDNA, other non-B DNA motifs have also been linked to mutagenesis that could expose Watson–Crick faces of nucleotide bases (87). Further studies are needed to understand how sequence-specific DNA dynamics may contribute to damage.
Finally, it has been known for many decades that in vitro, the Watson–Crick faces of nucleobases in dsDNA are accessible to damage by alkylating reagents (9, 13, 14, 20). Yet surprisingly, the extent of reactivity relative to ssDNA has not been quantitatively measured. Our results suggest that dsDNA only confers ∼130-fold protection relative to unpaired nucleotides in a bulge. The origin of the residual reactivity is unknown and could reflect formation of reactive transient Hoogsteen bps or some other unidentified conformational states. It could also arise as secondary methylation of dsDNA with the doubly methylated species falling below detection limits of MALDI. It could be that damage to solvent-exposed Hoogsteen faces of nucleobases to produce modifications such as m7G could also increase the damage susceptibility of the Watson–Crick faces of nearby A-T bps, by promoting either Hoogsteen or other conformations. Further studies are needed to understand the origins of this dsDNA reactivity.
In conclusion, our results indicate that Watson–Crick faces of purine nucleobases in dsDNA are accessible to methylation by DMS and that Hoogsteen conformations increase this reactivity further. The unique reactivity of adenine-N1 in Hoogsteen and unpaired conformations provides a method to detect these conformations in vitro and possibly in vivo.
Experimental procedures
Reagents
DMS, β-ME, echinomycin, m3A, and m7G nucleobases were purchased from Sigma–Aldrich. m1A mAb (mouse) was purchased from MBL. The m1A nucleobase was purchased from Acros Organics. Horseradish peroxidase–conjugated secondary antibody (anti-mouse IgG) was purchased from Thermo Fisher Scientific. The AlkB enzyme was a gift from Dr. Patrick O'Brien (University of Michigan). Unmodified DNA oligonucleotides were purchased from IDT with HPLC purification for primer extension assays and using standard desalting for other experiments. 5′-IR700–labeled DNA oligonucleotides were purchased from IDT with HPLC purification. DNA oligonucleotides containing m1A or m6A were purchased from Yale Keck Biotechnology.
DNA sample preparation
Duplex or hairpin dsDNA samples were prepared by dissolving oligonucleotides (1 mm for duplex, 20–100 μm for hairpin) in annealing buffer (15 mm sodium phosphate, 25 mm NaCl, 0.1 mm EDTA, pH 6.8). For nonpalindromic duplexes used in the primer extension assay, 1× template strand was mixed with 1.5× complementary strand to eliminate any residual ss template strand. Samples were then heated at 95 °C for 10 min, followed by slowly cooling to room temperature for duplexes and rapid cooling on ice for hairpins. Samples were then buffer-exchanged at least three times using a centrifugal concentrator (EMD Millipore, 3-kDa cutoff) into the annealing buffer. Sample purity was then assessed based on the absorption ratios (A260/A230 and A260/A280) measured on a NanoDrop 2000C spectrophotometer (Thermo Fisher Scientific). The concentration of oligonucleotides was quantified using a Qubit fluorometer (high-sensitivity 1xdsDNA kit). DNA-echinomycin complexes were prepared by mixing the DNA in annealing buffer with 10× and 3× echinomycin dissolved in methanol for long (dsTA-L and dsAT-L) and short (hpTA, hpAT, dsAT, dsTA, E24TA, and E24TA) oligonucleotides, respectively, maintaining the annealing buffer/MeOH ratio at 2:1 (v/v). The complex solutions were incubated at room temperature for 45 min, followed by slow solvent evaporation under an air stream (58). The dried samples were redissolved in water, ensuring that the final salt concentration was identical to the annealing buffer.
UV thermal denaturation
UV thermal denaturation experiments were performed on a PerkinElmer Lambda 25 UV/VIS spectrometer with an RTP 6 Peltier Temperature Programmer and a PCB 1500 Water Peltier System. DNA oligonucleotide stocks prepared in annealing buffer were diluted in annealing buffer to generate 3 μm 400-μl solutions. The samples were denatured at 1 °C/min with the absorbance at 260 nm (A260) being recorded every 0.5 °C. Three independent readings were recorded for each sample. Melting temperature (Tm) and enthalpy change (ΔH0) for the melting transition were obtained by fitting the absorbance data to Equations 1 and 2 using an in-house Mathematica script:
| (Eq. 1) |
| (Eq. 2) |
where mds and bds and mss and bss are pairs of coefficients representing the temperature dependence of the extinction coefficients of the hairpin and single strand, respectively; T is the temperature (units Kelvin); f is the fraction of the folded hairpin at a given temperature; Tm is the melting temperature (units Kelvin); ΔH0 is the enthalpy of the melting transition (units kcal/mol); and R is the universal gas constant (units kcal/K·mol). The entropy (ΔS0) and free energy (ΔG0) changes were computed from Tm and ΔH0 using Equations 3 and 4.
| (Eq. 3) |
| (Eq. 4) |
DMS treatment
DNA samples (1000 and 100 pmol for the dot-blot and primer extension assays, respectively) in annealing buffer were treated with DMS (75 and 150 mm for the dot-blot and primer extension assays, respectively) at room temperature for 5 or 15 min. A 2× volume of 66% ice-cold β-ME in DNA-annealing buffer was added to quench the reaction. The DNA was immediately purified using a DNA cleanup column (the Monarch PCR & DNA cleanup kit from New England Biolabs) and eluted with water. The samples were stored at −20 °C until required for the next step in the protocol. Single-hit kinetics with respect to the DMS reaction was verified using MS. Lack of overmethylation under the DMS treatment conditions used was further confirmed by monitoring the bands corresponding to the full-length product in the primer extension stop assays, which were much stronger than those of the truncated products (Fig. S6).
MALDI–TOF–MS
DMS-treated DNA oligonucleotides were desalted using a C18 Ziptip (Millipore). Briefly, the tip was primed with 50:50 H2O/MeCN with 0.1% TFA and rinsed with 0.1% TFA in H2O. 1 μl of sample was then loaded on the tip and desalted with 3 × 1 μl of 100 mm ammonium acetate. The procedure was repeated two more times, and the DNA oligonucleotide was finally eluted in 10:90 H2O/MeCN with 0.1% TFA. The MALDI matrix consisted of 30 mg/ml 3-hydroxypicolinic acid and 10 mg/ml diammonium citrate dissolved in 50:50 water/acetonitrile with 0.1% TFA. 1 μl of matrix was first dried on the polished steel plate, and then 1 μl of the desalted DNA oligonucleotide was dried over the top. Mass spectra were obtained using a Bruker Autoflex Speed LRF MALDI-TOF mass spectrometer equipped with a Nd:YAG laser (355 nm). Samples were analyzed in positive ion reflector mode using insulin/apomyoglobin as external calibration standards. Each spectrum was obtained using 500–1500 laser shots. The MALDI data of untreated hpTA and hpAT showed peaks corresponding to nucleobase losses that likely occur during MALDI sample preparation and/or desorption and ionization (88, 89), as the number of resonances in the [13C,1H] 2D HSQC NMR spectrum (Fig. S3) is consistent with the base composition of the DNA duplex.
AlkB repair
DMS-treated DNA samples (∼300 pmol, 10 μl) were added to (90 μl of) AlkB reaction buffer (25 mm HEPES, 100 mm NaCl, 2 mm sodium ascorbate, 1 mm 2-oxoglutarate, 40 μm (NH4)2Fe(SO4)2, 1 mm tris(2-carboxyethyl)phosphine, and 0.1 mg/ml BSA, pH 7.3). AlkB enzyme was then added to a final concentration of 2 μm. The reaction was allowed to proceed at 37 °C for 2 h. Samples were then purified using the DNA cleanup column kit (the Monarch PCR & DNA cleanup kit from New England Biolabs). The specificity of AlkB repair reaction was confirmed using an inactive AlkB control reaction in which Fe2+, ascorbate, and 2-oxoglutarate co-factors required for the demethylation reaction were not added (Fig. S2).
Dimroth reaction
DMS-treated DNA samples (10 μl) were added to 1 ml of 0.1 m Na2CO3/NaHCO3 buffer (pH 10.2) and incubated at 65 °C for 3 h. Samples were then purified using the DNA cleanup column kit (the Monarch PCR & DNA cleanup kit from New England Biolabs).
Dot-blot assay
A chemically synthesized oligonucleotide containing a single m1A was used to calibrate the m1A concentration range over which the m1A antibody signal intensity varies linearly with m1A concentration (Fig. S7). Based on this m1A standard curve, for the subsequent dot-blot assays, 100 pmol of DNA samples were blotted on a positively charged nylon membrane (Amersham Biosciences Hybond-N+, GE Healthcare). The DNA was then UV-cross-linked to the membrane (254 nm, 15 min). The membrane was incubated in 0.03% methylene blue (in 0.5 m acetate) for 30 min, followed by a brief wash with PBST buffer (0.1% Tween 20 in 1× PBS, pH 7.4) and was then imaged to quantify the amount of DNA loaded on the membrane (loading controls). Methylene blue destaining was performed by washing with ethanol for 5 min. The membrane was blocked with 5% nonfat dry milk (in PBST buffer) at room temperature for 1 h and then incubated with anti-m1A mAb (1:5000 dilution in PBST buffer) at 4 °C overnight followed by three 10-min PBST washes. The membrane was then incubated with horseradish peroxidase–conjugated secondary antibody (1:2500 dilution in PBST buffer) at room temperature for 1 h followed by three 10-min PBST washes. The membrane was developed using enhanced chemiluminescent substrate (GE Healthcare) on Bio-Rad Chemi-Doc imager. The signal intensity was quantified using Image Laboratory software. For nucleobase-based competition assays, the anti-m1A mAb (1:5000 in PBST buffer) was premixed with a series of concentrations of nucleobases (m1A, m3A, or m7G) prior to incubation with the membrane containing m1A-incorporated dsDNA.
Primer extension stop assay
Primer extension reactions were performed by mixing DNA oligonucleotide samples (0.1 μm × 2 μl in H2O) with the 5′-IR700 labeled primer (5′-ATCAGAATCCCGGTGCCGAGGC-3′) (1.5 μm × 2.5 μl in H2O) followed by the addition of 4.5 μl of NEBNext Ultra II Pol master mix (New England Biolabs). The reaction mixture was denatured at 98 °C for 1 min and then annealed and extended at 72 °C for 6 min and finally cooled to room temperature in a PCR machine (Eppendorf AG). 8.5 μl of stop solution (0.05% orange G and 20 mm EDTA in formamide) was then added. Samples were denatured at 98 °C for 3 min and loaded immediately (7.5 μl) on a denaturing polyacrylamide gel (10% polyacrylamine, 8 m urea). The gel was run at 45 °C and 45 watts for 50 min and visualized using the LI-COR Odyssey Clx imaging system at 700 nm.
Gel quantification
The band intensities were quantified using Image Studio software (LI-COR). Briefly, the “Draw Rectangle” mode was used to select bands. Rectangles around the bands of interest were drawn manually, and the band intensities were quantified using the software. The size of the rectangle was chosen to be just sufficiently large to completely encompass the band. To allow comparison across different samples, a similar sized rectangle was used to quantify bands on the same gel. Fig. S6C shows an example for the gel quantification.
Sanger sequencing
A Sanger sequencing assay was performed using the Sequenase 2.0 DNA Sanger sequencing kit (Thermo Fisher Scientific). The assay was performed following the protocol provided by the sequencing kit. Briefly, to prepare the annealing mixture, the template strand (5 μm × 1 μl in water) of one single strand of dsTA-L DNA (5′-GCAACATGCGTACGCACTGTCTTCCAGGCCTCGGCACCGGGATTCTGAT-3') was combined with the same IR700-labeled primer (5 μm × 1 μl in water) used in the primer extension assay and 6 μl of double-distilled H2O and 2 μl of 5× Seq buffer (provided in the kit). The annealing mixture (10 μl in total) was then heated at 70 °C for 5 min, annealed at room temperature for 5 min, and then chilled on ice for 1 min. 1.5 μl of Mn2+ buffer (provided in the kit), 1 μl of DTT solution (provided in the kit), and 1 μl of water were then added to the annealing mixture. 3 μl of annealing mixture was then added to each of the four termination tubes containing 2.5 μl of ddA, ddC, ddG, and ddT, respectively (provided in the kit. Note that these four tubes were prewarmed at 37 °C for 5 min prior to the addition of the annealing mixture). 0.5 μl of prediluted Sequenase 2.0 enzyme (the enzyme and the dilution protocol are provided in the kit) was quickly added to each termination tube. Termination tubes were then incubated at 37 °C for 3 min. 4 μl of stop solution (95% formamide, 20 mm EDTA and 0.05% orange G) was then added to each tube, and the tubes were heated at 95 °C for 5 min. 3.5 μl of sample from each tube was immediately loaded to the 10% polyacrylamide denaturing gel.
NMR experiments
One-dimensional and 2D NMR spectra were collected on a 700-MHz Bruker Avance III spectrometer equipped with a triple-resonance HCN cryogenic probe. Data were processed and analyzed with NMRpipe (90) and SPARKY (T. D. Goddard and D. G. Kneller, SPARKY 3, University of California, San Francisco), respectively.
Data availability
All data presented are available upon request from Hashim M. Al-Hashimi (hashim.al.hashimi@duke.edu).
Supplementary Material
Acknowledgments
We thank Dr. Patrick O'Brien for kindly providing the AlkB enzyme. We thank the Duke Magnetic Resonance Spectroscopy Center for technical support and resources. We thank Dr. Peter Silinski (Duke Chemistry Shared Instrument Facility) for performing the MALDI experiments (funded by North Carolina Biotechnology Center Grant 2017-IDG-1018).We also thank Atul K. Rangadurai and Megan Kelly for critical input.
This article contains supporting information.
Author contributions—Y. X. conceptualization; Y. X., A. M., U. P., and A. L. data curation; Y. X. and H. M. A. funding acquisition; Y. X. visualization; Y. X., A. M., B. L., and U. P. methodology; Y. X., A. M., and H. M. A. writing-original draft; Y. X. and H. M. A. project administration; Y. X., A. M., and H. M. A. writing-review and editing; A. M. formal analysis; H. S. software; H. M. A. resources; H. M. A. supervision.
Funding and additional information—This work was supported by a Mathers Foundation grant (to H. M. A.).
Conflict of interest—The authors declare that they have no conflict of interest with the contents of this article.
- DMS
- dimethyl sulfate
- β-ME
- 2-mercaptoethanol
- 2D
- two-dimensional
- PDB
- Protein Data Bank.
References
- 1. Lindahl T. (1993) Instability and decay of the primary structure of DNA. Nature 362, 709–715 10.1038/362709a0 [DOI] [PubMed] [Google Scholar]
- 2. Dulbecco R. (1949) Reactivation of ultra-violet-inactivated bacteriophage by visible light. Nature 163, 949 10.1038/163949b0 [DOI] [PubMed] [Google Scholar]
- 3. Kelner A. (1949) Effect of visible light on the recovery of Streptomyces griseus conidia from ultra-violet irradiation injury. Proc. Natl. Acad. Sci. U. S. A. 35, 73–79 10.1073/pnas.35.2.73 [DOI] [PMC free article] [PubMed] [Google Scholar]
- 4. Sedgwick B. (2004) Repairing DNA-methylation damage. Nat. Rev. Mol. Cell Biol. 5, 148–157 10.1038/nrm1312 [DOI] [PubMed] [Google Scholar]
- 5. Fu D., Calvo J. A., and Samson L. D. (2012) Balancing repair and tolerance of DNA damage caused by alkylating agents. Nat. Rev. Cancer 12, 104–120 10.1038/nrc3185 [DOI] [PMC free article] [PubMed] [Google Scholar]
- 6. De Bont R., and van Larebeke N. (2004) Endogenous DNA damage in humans: a review of quantitative data. Mutagenesis 19, 169–185 10.1093/mutage/geh025 [DOI] [PubMed] [Google Scholar]
- 7. Sedgwick B., Bates P. A., Paik J., Jacobs S. C., and Lindahl T. (2007) Repair of alkylated DNA: recent advances. DNA Repair (Amst.) 6, 429–442 10.1016/j.dnarep.2006.10.005 [DOI] [PubMed] [Google Scholar]
- 8. Shrivastav N., Li D., and Essigmann J. M. (2010) Chemical biology of mutagenesis and DNA repair: cellular responses to DNA alkylation. Carcinogenesis 31, 59–70 10.1093/carcin/bgp262 [DOI] [PMC free article] [PubMed] [Google Scholar]
- 9. Bodell W. J., and Singer B. (1979) Influence of hydrogen bonding in DNA and polynucleotides on reaction of nitrogens and oxygens toward ethylnitrosourea. Biochemistry 18, 2860–2863 10.1021/bi00580a029 [DOI] [PubMed] [Google Scholar]
- 10. Fedeles B. I., Singh V., Delaney J. C., Li D., and Essigmann J. M. (2015) The AlkB family of Fe(II)/α-ketoglutarate-dependent dioxygenases: repairing nucleic acid alkylation damage and beyond. J. Biol. Chem. 290, 20734–20742 10.1074/jbc.R115.656462 [DOI] [PMC free article] [PubMed] [Google Scholar]
- 11. Wyatt M. D., and Pittman D. L. (2006) Methylating agents and DNA repair responses: methylated bases and sources of strand breaks. Chem. Res. Toxicol. 19, 1580–1594 10.1021/tx060164e [DOI] [PMC free article] [PubMed] [Google Scholar]
- 12. Srinivas U. S., Tan B. W. Q., Vellayappan B. A., and Jeyasekharan A. D. (2019) ROS and the DNA damage response in cancer. Redox Biol. 25, 101084 10.1016/j.redox.2018.101084 [DOI] [PMC free article] [PubMed] [Google Scholar]
- 13. Beranek D. T. (1990) Distribution of methyl and ethyl adducts following alkylation with monofunctional alkylating agents. Mutat. Res. 231, 11–30 10.1016/0027-5107(90)90173-2 [DOI] [PubMed] [Google Scholar]
- 14. Drabløs F., Feyzi E., Aas P. A., Vaagbø C. B., Kavli B., Bratlie M. S., Peña-Diaz J., Otterlei M., Slupphaug G., and Krokan H. E. (2004) Alkylation damage in DNA and RNA–repair mechanisms and medical significance. DNA Repair (Amst.) 3, 1389–1407 10.1016/j.dnarep.2004.05.004 [DOI] [PubMed] [Google Scholar]
- 15. Dinglay S., Gold B., and Sedgwick B. (1998) Repair in Escherichia coli alkB mutants of abasic sites and 3-methyladenine residues in DNA. Mutat Res 407, 109–116 10.1016/S0921-8777(97)00065-7 [DOI] [PubMed] [Google Scholar]
- 16. Colombi D., and Gomes S. L. (1997) An alkB gene homolog is differentially transcribed during the Caulobacter crescentus cell cycle. J. Bacteriol. 179, 3139–3145 10.1128/jb.179.10.3139-3145.1997 [DOI] [PMC free article] [PubMed] [Google Scholar]
- 17. Duncan T., Trewick S. C., Koivisto P., Bates P. A., Lindahl T., and Sedgwick B. (2002) Reversal of DNA alkylation damage by two human dioxygenases. Proc. Natl. Acad. Sci. U. S. A. 99, 16660–16665 10.1073/pnas.262589799 [DOI] [PMC free article] [PubMed] [Google Scholar]
- 18. Delaney J. C., and Essigmann J. M. (2004) Mutagenesis, genotoxicity, and repair of 1-methyladenine, 3-alkylcytosines, 1-methylguanine, and 3-methylthymine in alkB Escherichia coli. Proc. Natl. Acad. Sci. U. S. A. 101, 14051–14056 10.1073/pnas.0403489101 [DOI] [PMC free article] [PubMed] [Google Scholar]
- 19. Chen F., Tang Q., Bian K., Humulock Z. T., Yang X., Jost M., Drennan C. L., Essigmann J. M., and Li D. (2016) Adaptive response enzyme AlkB preferentially repairs 1-methylguanine and 3-methylthymine adducts in double-stranded DNA. Chem. Res. Toxicol. 29, 687–693 10.1021/acs.chemrestox.5b00522 [DOI] [PMC free article] [PubMed] [Google Scholar]
- 20. McGhee J. D., and von Hippel P. H. (1977) Formaldehyde as a probe of DNA structure. 4. Mechanism of the initial reaction of formaldehyde with DNA. Biochemistry 16, 3276–3293 10.1021/bi00634a002 [DOI] [PubMed] [Google Scholar]
- 21. Guéron M., Kochoyan M., and Leroy J. L. (1987) A single mode of DNA base-pair opening drives imino proton exchange. Nature 328, 89–92 10.1038/328089a0 [DOI] [PubMed] [Google Scholar]
- 22. Hoogsteen K. (1959) The structure of crystals containing a hydrogen-bonded complex of 1-methylthymine and 9-methyladenine. Acta Crystallogr. 12, 822–823 10.1107/S0365110X59002389 [DOI] [Google Scholar]
- 23. Portugal J. (1989) Do Hoogsteen base pairs occur in DNA? Trends Biochem. Sci. 14, 127–130 10.1016/0968-0004(89)90141-2 [DOI] [PubMed] [Google Scholar]
- 24. Nikolova E. N., Kim E., Wise A. A., O'Brien P. J., Andricioaei I., and Al-Hashimi H. M. (2011) Transient Hoogsteen base pairs in canonical duplex DNA. Nature 470, 498–502 10.1038/nature09775 [DOI] [PMC free article] [PubMed] [Google Scholar]
- 25. Alvey H. S., Gottardo F. L., Nikolova E. N., and Al-Hashimi H. M. (2014) Widespread transient Hoogsteen base pairs in canonical duplex DNA with variable energetics. Nat. Commun. 5, 4786 10.1038/ncomms5786 [DOI] [PMC free article] [PubMed] [Google Scholar]
- 26. Nikolova E. N., Zhou H., Gottardo F. L., Alvey H. S., Kimsey I. J., and Al-Hashimi H. M. (2013) A historical account of Hoogsteen base-pairs in duplex DNA. Biopolymers 99, 955–968 10.1002/bip.22334 [DOI] [PMC free article] [PubMed] [Google Scholar]
- 27. Golovenko D., Brauning B., Vyas P., Haran T. E., Rozenberg H., and Shakked Z. (2018) New insights into the role of DNA shape on its recognition by p53 proteins. Structure 26, 1237–1250e1236 10.1016/j.str.2018.06.006 [DOI] [PubMed] [Google Scholar]
- 28. Aishima J., Gitti R. K., Noah J. E., Gan H. H., Schlick T., and Wolberger C. (2002) A Hoogsteen base pair embedded in undistorted B-DNA. Nucleic Acids Res 30, 5244–5252 10.1093/nar/gkf661 [DOI] [PMC free article] [PubMed] [Google Scholar]
- 29. Wang A. H., Ughetto G., Quigley G. J., Hakoshima T., van der Marel G. A., van Boom J. H., and Rich A. (1984) The molecular structure of a DNA-triostin A complex. Science 225, 1115–1121 10.1126/science.6474168 [DOI] [PubMed] [Google Scholar]
- 30. Patikoglou G. A., Kim J. L., Sun L., Yang S. H., Kodadek T., and Burley S. K. (1999) TATA element recognition by the TATA box-binding protein has been conserved throughout evolution. Genes Dev. 13, 3217–3230 10.1101/gad.13.24.3217 [DOI] [PMC free article] [PubMed] [Google Scholar]
- 31. Kitayner M., Rozenberg H., Rohs R., Suad O., Rabinovich D., Honig B., and Shakked Z. (2010) Diversity in DNA recognition by p53 revealed by crystal structures with Hoogsteen base pairs. Nat. Struct. Mol. Biol. 17, 423–429 10.1038/nsmb.1800 [DOI] [PMC free article] [PubMed] [Google Scholar]
- 32. Singer B., and Grunberger D. (2012) Molecular Biology of Mutagens and Carcinogens. pp. 55–77, Plenum Press, New York [Google Scholar]
- 33. Kirkegaard K., Buc H., Spassky A., and Wang J. C. (1983) Mapping of single-stranded regions in duplex DNA at the sequence level: single-strand-specific cytosine methylation in RNA polymerase-promoter complexes. Proc. Natl. Acad. Sci. U. S. A. 80, 2544–2548 10.1073/pnas.80.9.2544 [DOI] [PMC free article] [PubMed] [Google Scholar]
- 34. Li S., Waters R., and Smerdon M. J. (2000) Low- and high-resolution mapping of DNA damage at specific sites. Methods 22, 170–179 10.1006/meth.2000.1058 [DOI] [PubMed] [Google Scholar]
- 35. Sun D., Guo K., and Shin Y. J. (2011) Evidence of the formation of G-quadruplex structures in the promoter region of the human vascular endothelial growth factor gene. Nucleic Acids Res. 39, 1256–1265 10.1093/nar/gkq926 [DOI] [PMC free article] [PubMed] [Google Scholar]
- 36. Rouskin S., Zubradt M., Washietl S., Kellis M., and Weissman J. S. (2014) Genome-wide probing of RNA structure reveals active unfolding of mRNA structures in vivo. Nature 505, 701–705 10.1038/nature12894 [DOI] [PMC free article] [PubMed] [Google Scholar]
- 37. Guo J. U., and Bartel D. P. (2016) RNA G-quadruplexes are globally unfolded in eukaryotic cells and depleted in bacteria. Science 353, aaf5371 10.1126/science.aaf5371 [DOI] [PMC free article] [PubMed] [Google Scholar]
- 38. Dinglay S., Trewick S. C., Lindahl T., and Sedgwick B. (2000) Defective processing of methylated single-stranded DNA by E. coli AlkB mutants. Genes Dev. 14, 2097–2105 [PMC free article] [PubMed] [Google Scholar]
- 39. Kataoka H., Yamamoto Y., and Sekiguchi M. (1983) A new gene (alkB) of Escherichia coli that controls sensitivity to methyl methane sulfonate. J. Bacteriol. 153, 1301–1307 10.1128/JB.153.3.1301-1307.1983 [DOI] [PMC free article] [PubMed] [Google Scholar]
- 40. Aas P. A., Otterlei M., Falnes P. O., Vagbø C. B., Skorpen F., Akbari M., Sundheim O., Bjøras M., Slupphaug G., Seeberg E., and Krokan H. E. (2003) Human and bacterial oxidative demethylases repair alkylation damage in both RNA and DNA. Nature 421, 859–863 10.1038/nature01363 [DOI] [PubMed] [Google Scholar]
- 41. Li X., Xiong X., Wang K., Wang L., Shu X., Ma S., and Yi C. (2016) Transcriptome-wide mapping reveals reversible and dynamic N1-methyladenosine methylome. Nat. Chem. Biol. 12, 311–316 10.1038/nchembio.2040 [DOI] [PubMed] [Google Scholar]
- 42. Itoh K., Mizugaki M., and Ishida N. (1988) Preparation of a monoclonal antibody specific for 1-methyladenosine and its application for the detection of elevated levels of 1-methyladenosine in urines from cancer patients. Jpn. J. Cancer Res. 79, 1130–1138 10.1111/j.1349-7006.1988.tb01536.x [DOI] [PMC free article] [PubMed] [Google Scholar]
- 43. Dominissini D., Nachtergaele S., Moshitch-Moshkovitz S., Peer E., Kol N., Ben-Haim M. S., Dai Q., Di Segni A., Salmon-Divon M., Clark W. C., Zheng G., Pan T., Solomon O., Eyal E., Hershkovitz V., et al. (2016) The dynamic N1-methyladenosine methylome in eukaryotic messenger RNA. Nature 530, 441–446 10.1038/nature16998 [DOI] [PMC free article] [PubMed] [Google Scholar]
- 44. Grozhik A. V., Olarerin-George A. O., Sindelar M., Li X., Gross S. S., and Jaffrey S. R. (2019) Antibody cross-reactivity accounts for widespread appearance of m(1)A in 5'UTRs. Nat. Commun. 10, 5126 10.1038/s41467-019-13146-w [DOI] [PMC free article] [PubMed] [Google Scholar]
- 45. Saffhill R., and Abbott P. J. (1978) Formation of O2-methylthymine in poly(dA-dT) on methylation with N-methyl-N-nitrosourea and dimethyl sulphate. Evidence that O2-methylthymine does not miscode during DNA synthesis. Nucleic Acids Res. 5, 1971–1978 10.1093/nar/5.6.1971 [DOI] [PMC free article] [PubMed] [Google Scholar]
- 46. Trewick S. C., Henshaw T. F., Hausinger R. P., Lindahl T., and Sedgwick B. (2002) Oxidative demethylation by Escherichia coli AlkB directly reverts DNA base damage. Nature 419, 174–178 10.1038/nature00908 [DOI] [PubMed] [Google Scholar]
- 47. Engel J. D. (1975) Mechanism of the Dimroth rearrangement in adenosine. Biochem. Biophys. Res. Commun. 64, 581–586 10.1016/0006-291X(75)90361-7 [DOI] [PubMed] [Google Scholar]
- 48. Safra M., Sas-Chen A., Nir R., Winkler R., Nachshon A., Bar-Yaacov D., Erlacher M., Rossmanith W., Stern-Ginossar N., and Schwartz S. (2017) The m1A landscape on cytosolic and mitochondrial mRNA at single-base resolution. Nature 551, 251–255 10.1038/nature24456 [DOI] [PubMed] [Google Scholar]
- 49. Liu B., Merriman D. K., Choi S. H., Schumacher M. A., Plangger R., Kreutz C., Horner S. M., Meyer K. D., and Al-Hashimi H. M. (2018) A potentially abundant junctional RNA motif stabilized by m6A and Mg2. Nat. Commun. 9, 2761 10.1038/s41467-018-05243-z [DOI] [PMC free article] [PubMed] [Google Scholar]
- 50. Cordero P., Kladwang W., VanLang C. C., and Das R. (2014) The mutate-and-map protocol for inferring base pairs in structured RNA. Methods Mol. Biol. 1086, 53–77 10.1007/978-1-62703-667-2_4 [DOI] [PMC free article] [PubMed] [Google Scholar]
- 51. Tijerina P., Mohr S., and Russell R. (2007) DMS footprinting of structured RNAs and RNA-protein complexes. Nat. Protoc. 2, 2608–2623 10.1038/nprot.2007.380 [DOI] [PMC free article] [PubMed] [Google Scholar]
- 52. Wan Y., Qu K., Ouyang Z., and Chang H. Y. (2013) Genome-wide mapping of RNA structure using nuclease digestion and high-throughput sequencing. Nat. Protoc. 8, 849–869 10.1038/nprot.2013.045 [DOI] [PubMed] [Google Scholar]
- 53. Humeny A., Beck C., Becker C. M., and Jeltsch A. (2003) Detection and analysis of enzymatic DNA methylation of oligonucleotide substrates by matrix-assisted laser desorption ionization time-of-flight mass spectrometry. Anal. Biochem. 313, 160–166 10.1016/S0003-2697(02)00568-7 [DOI] [PubMed] [Google Scholar]
- 54. Matsuura S. (1965) Studies on quinoxaline antibiotics. IV. Selective antitumor activity of each quinoxaline antibiotic. J Antibiot. (Tokyo) 18, 43–46 [PubMed] [Google Scholar]
- 55. Waring M. J., and Wakelin L. P. (1974) Echinomycin: a bifunctional intercalating antibiotic. Nature 252, 653–657 10.1038/252653a0 [DOI] [PubMed] [Google Scholar]
- 56. Ughetto G., Wang A. H., Quigley G. J., van der Marel G. A., van Boom J. H., and Rich A. (1985) A comparison of the structure of echinomycin and triostin A complexed to a DNA fragment. Nucleic Acids Res. 13, 2305–2323 10.1093/nar/13.7.2305 [DOI] [PMC free article] [PubMed] [Google Scholar]
- 57. Quigley G. J., Ughetto G., van der Marel G. A., van Boom J. H., Wang A. H., and Rich A. (1986) Non-Watson-Crick G.C and A.T base pairs in a DNA-antibiotic complex. Science 232, 1255–1258 10.1126/science.3704650 [DOI] [PubMed] [Google Scholar]
- 58. Gilbert D. E., van der Marel G. A., van Boom J. H., and Feigon J. (1989) Unstable Hoogsteen base pairs adjacent to echinomycin binding sites within a DNA duplex. Proc. Natl. Acad. Sci. U. S. A. 86, 3006–3010 10.1073/pnas.86.9.3006 [DOI] [PMC free article] [PubMed] [Google Scholar]
- 59. Cuesta-Seijo J. A., and Sheldrick G. M. (2005) Structures of complexes between echinomycin and duplex DNA. Acta Crystallogr. D Biol. Crystallogr. 61, 442–448 10.1107/S090744490500137X [DOI] [PubMed] [Google Scholar]
- 60. Xu Y., McSally J., Andricioaei I., and Al-Hashimi H. M. (2018) Modulation of Hoogsteen dynamics on DNA recognition. Nat. Commun. 9, 1473 10.1038/s41467-018-03516-1 [DOI] [PMC free article] [PubMed] [Google Scholar]
- 61. Gilbert D. E., and Feigon J. (1991) The DNA sequence at echinomycin binding sites determines the structural changes induced by drug binding: NMR studies of echinomycin binding to [d(ACGTACGT)]2 and [d(TCGATCGA)]2. Biochemistry 30, 2483–2494 10.1021/bi00223a027 [DOI] [PubMed] [Google Scholar]
- 62. Zhou H., Kimsey I. J., Nikolova E. N., Sathyamoorthy B., Grazioli G., McSally J., Bai T., Wunderlich C. H., Kreutz C., Andricioaei I., and Al-Hashimi H. M. (2016) m1A and m1G disrupt A-RNA structure through the intrinsic instability of Hoogsteen base pairs. Nat. Struct. Mol. Biol. 23, 803–810 10.1038/nsmb.3270 [DOI] [PMC free article] [PubMed] [Google Scholar]
- 63. Nikolova E. N., Bascom G. D., Andricioaei I., and Al-Hashimi H. M. (2012) Probing sequence-specific DNA flexibility in a-tracts and pyrimidine-purine steps by nuclear magnetic resonance 13C relaxation and molecular dynamics simulations. Biochemistry 51, 8654–8664 10.1021/bi3009517 [DOI] [PMC free article] [PubMed] [Google Scholar]
- 64. Gallego J., Ortiz A. R., and Gago F. (1993) A molecular dynamics study of the bis-intercalation complexes of echinomycin with d(ACGT)2 and d(TCGA)2: rationale for sequence-specific Hoogsteen base pairing. J. Med. Chem. 36, 1548–1561 10.1021/jm00063a005 [DOI] [PubMed] [Google Scholar]
- 65. Lawley P. D. (1974) Some chemical aspects of dose-response relationships in alkylation mutagenesis. Mutat. Res. 23, 283–295 10.1016/0027-5107(74)90102-X [DOI] [PubMed] [Google Scholar]
- 66. Gates K. S., Nooner T., and Dutta S. (2004) Biologically relevant chemical reactions of N7-alkylguanine residues in DNA. Chem. Res. Toxicol. 17, 839–856 10.1021/tx049965c [DOI] [PubMed] [Google Scholar]
- 67. Dumitru I., and McNeil J. B. (1994) A simple in vivo footprinting method to examine DNA-protein interactions over the yeast PYK UAS element. Nucleic Acids Res. 22, 1450–1455 10.1093/nar/22.8.1450 [DOI] [PMC free article] [PubMed] [Google Scholar]
- 68. Zubradt M., Gupta P., Persad S., Lambowitz A. M., Weissman J. S., and Rouskin S. (2017) DMS-MaPseq for genome-wide or targeted RNA structure probing in vivo. Nat. Methods 14, 75–82 10.1038/nmeth.4057 [DOI] [PMC free article] [PubMed] [Google Scholar]
- 69. McLean M. J., and Waring M. J. (1988) Chemical probes reveal no evidence of Hoogsteen base pairing in complexes formed between echinomycin and DNA in solution. J. Mol. Recognit. 1, 138–151 10.1002/jmr.300010307 [DOI] [PubMed] [Google Scholar]
- 70. McGhee J. D., and Felsenfeld G. (1979) Reaction of nucleosome DNA with dimethyl sulfate. Proc. Natl. Acad. Sci. U. S. A. 76, 2133–2137 10.1073/pnas.76.5.2133 [DOI] [PMC free article] [PubMed] [Google Scholar]
- 71. Zhou H., Sathyamoorthy B., Stelling A., Xu Y., Xue Y., Pigli Y. Z., Case D. A., Rice P. A., and Al-Hashimi H. M. (2019) Characterizing Watson-Crick versus Hoogsteen base pairing in a DNA-protein complex using nuclear magnetic resonance and site-specifically 13C- and 15N-labeled DNA. Biochemistry 58, 1963–1974 10.1021/acs.biochem.9b00027 [DOI] [PMC free article] [PubMed] [Google Scholar]
- 72. Bunting K. A., Roe S. M., Headley A., Brown T., Savva R., and Pearl L. H. (2003) Crystal structure of the Escherichia coli dcm very-short-patch DNA repair endonuclease bound to its reaction product-site in a DNA superhelix. Nucleic Acids Res. 31, 1633–1639 10.1093/nar/gkg273 [DOI] [PMC free article] [PubMed] [Google Scholar]
- 73. Rice P. A., Yang S., Mizuuchi K., and Nash H. A. (1996) Crystal structure of an IHF-DNA complex: a protein-induced DNA U-turn. Cell 87, 1295–1306 10.1016/S0092-8674(00)81824-3 [DOI] [PubMed] [Google Scholar]
- 74. Ronning D. R., Guynet C., Ton-Hoang B., Perez Z. N., Ghirlando R., Chandler M., and Dyda F. (2005) Active site sharing and subterminal hairpin recognition in a new class of DNA transposases. Mol. Cell 20, 143–154 10.1016/j.molcel.2005.07.026 [DOI] [PubMed] [Google Scholar]
- 75. Stelling A. L., Liu A. Y., Zeng W., Salinas R., Schumacher M. A., and Al-Hashimi H. M. (2019) Infrared spectroscopic observation of a G-C+ Hoogsteen base pair in the DNA:TATA box binding protein complex under solution conditions. Angew. Chem. Int. Ed. Engl. 58, 12010–12013 10.1002/anie.201902693 [DOI] [PMC free article] [PubMed] [Google Scholar]
- 76. Wakamori M., Fujii Y., Suka N., Shirouzu M., Sakamoto K., Umehara T., and Yokoyama S. (2015) Intra- and inter-nucleosomal interactions of the histone H4 tail revealed with a human nucleosome core particle with genetically-incorporated H4 tetra-acetylation. Sci. Rep. 5, 17204 10.1038/srep17204 [DOI] [PMC free article] [PubMed] [Google Scholar]
- 77. Sathyamoorthy B., Shi H., Zhou H., Xue Y., Rangadurai A., Merriman D. K., and Al-Hashimi H. M. (2017) Insights into Watson-Crick/Hoogsteen breathing dynamics and damage repair from the solution structure and dynamic ensemble of DNA duplexes containing m1A. Nucleic Acids Res. 45, 5586–5601 10.1093/nar/gkx186 [DOI] [PMC free article] [PubMed] [Google Scholar]
- 78. Zhou H., Hintze B. J., Kimsey I. J., Sathyamoorthy B., Yang S., Richardson J. S., and Al-Hashimi H. M. (2015) New insights into Hoogsteen base pairs in DNA duplexes from a structure-based survey. Nucleic Acids Res. 43, 3420–3433 10.1093/nar/gkv241 [DOI] [PMC free article] [PubMed] [Google Scholar]
- 79. Portugal J., Fox K. R., McLean M. J., Richenberg J. L., and Waring M. J. (1988) Diethyl pyrocarbonate can detect a modified DNA structure induced by the binding of quinoxaline antibiotics. Nucleic Acids Res. 16, 3655–3670 10.1093/nar/16.9.3655 [DOI] [PMC free article] [PubMed] [Google Scholar]
- 80. Jeppesen C., and Nielsen P. E. (1988) Detection of intercalation-induced changes in DNA structure by reaction with diethyl pyrocarbonate or potassium permanganate. Evidence against the induction of Hoogsteen base pairing by echinomycin. FEBS Lett. 231, 172–176 10.1016/0014-5793(88)80725-7 [DOI] [PubMed] [Google Scholar]
- 81. Sayers E. W., and Waring M. J. (1993) Footprinting titration studies on the binding of echinomycin to DNA incapable of forming Hoogsteen base pairs. Biochemistry 32, 9094–9107 10.1021/bi00086a014 [DOI] [PubMed] [Google Scholar]
- 82. Mendel D., and Dervan P. B. (1987) Hoogsteen base pairs proximal and distal to echinomycin binding sites on DNA. Proc. Natl. Acad. Sci. U.S.A. 84, 910–914 10.1073/pnas.84.4.910 [DOI] [PMC free article] [PubMed] [Google Scholar]
- 83. Ding Y., Tang Y., Kwok C. K., Zhang Y., Bevilacqua P. C., and Assmann S. M. (2014) In vivo genome-wide profiling of RNA secondary structure reveals novel regulatory features. Nature 505, 696–700 10.1038/nature12756 [DOI] [PubMed] [Google Scholar]
- 84. Talkish J., May G., Lin Y., Woolford J. L. Jr., and McManus C. J. (2014) Mod-seq: high-throughput sequencing for chemical probing of RNA structure. RNA 20, 713–720 10.1261/rna.042218.113 [DOI] [PMC free article] [PubMed] [Google Scholar]
- 85. Rangadurai A., Zhou H., Merriman D. K., Meiser N., Liu B., Shi H., Szymanski E. S., and Al-Hashimi H. M. (2018) Why are Hoogsteen base pairs energetically disfavored in A-RNA compared to B-DNA? Nucleic Acids Res. 46, 11099–11114 10.1093/nar/gky885 [DOI] [PMC free article] [PubMed] [Google Scholar]
- 86. Bohnuud T., Beglov D., Ngan C. H., Zerbe B., Hall D. R., Brenke R., Vajda S., Frank-Kamenetskii M. D., and Kozakov D. (2012) Computational mapping reveals dramatic effect of Hoogsteen breathing on duplex DNA reactivity with formaldehyde. Nucleic Acids Res. 40, 7644–7652 10.1093/nar/gks519 [DOI] [PMC free article] [PubMed] [Google Scholar]
- 87. Georgakopoulos-Soares I., Morganella S., Jain N., Hemberg M., and Nik-Zainal S. (2018) Noncanonical secondary structures arising from non-B DNA motifs are determinants of mutagenesis. Genome Res. 28, 1264–1271 10.1101/gr.231688.117 [DOI] [PMC free article] [PubMed] [Google Scholar]
- 88. Schneider K., and Chait B. T. (1995) Increased stability of nucleic acids containing 7-deaza-guanosine and 7-deaza-adenosine may enable rapid DNA sequencing by matrix-assisted laser desorption mass spectrometry. Nucleic Acids Res. 23, 1570–1575 10.1093/nar/23.9.1570 [DOI] [PMC free article] [PubMed] [Google Scholar]
- 89. Nordhoff E., Cramer R., Karas M., Hillenkamp F., Kirpekar F., Kristiansen K., and Roepstorff P. (1993) Ion stability of nucleic acids in infrared matrix-assisted laser desorption/ionization mass spectrometry. Nucleic Acids Res. 21, 3347–3357 10.1093/nar/21.15.3347 [DOI] [PMC free article] [PubMed] [Google Scholar]
- 90. Delaglio F., Grzesiek S., Vuister G. W., Zhu G., Pfeifer J., and Bax A. (1995) Nmrpipe—a multidimensional spectral processing system based on Unix pipes. J. Biomol. NMR 6, 277–293 10.1007/BF00197809 [DOI] [PubMed] [Google Scholar]
- 91. Salomon-Ferrer R., Götz A. W., Poole D., Le Grand S., and Walker R. C. (2013) Routine microsecond molecular dynamics simulations with AMBER on GPUs. 2. Explicit solvent particle mesh Ewald. J. Chem. Theory Comput. 9, 3878–3888 10.1021/ct400314y [DOI] [PubMed] [Google Scholar]
- 92. Cheatham T. E. 3rd, Cieplak P., and Kollman P. A. (1999) A modified version of the Cornell et al. force field with improved sugar pucker phases and helical repeat. J. Biomol. Struct. Dyn. 16, 845–862 10.1080/07391102.1999.10508297 [DOI] [PubMed] [Google Scholar]
Associated Data
This section collects any data citations, data availability statements, or supplementary materials included in this article.
Supplementary Materials
Data Availability Statement
All data presented are available upon request from Hashim M. Al-Hashimi (hashim.al.hashimi@duke.edu).