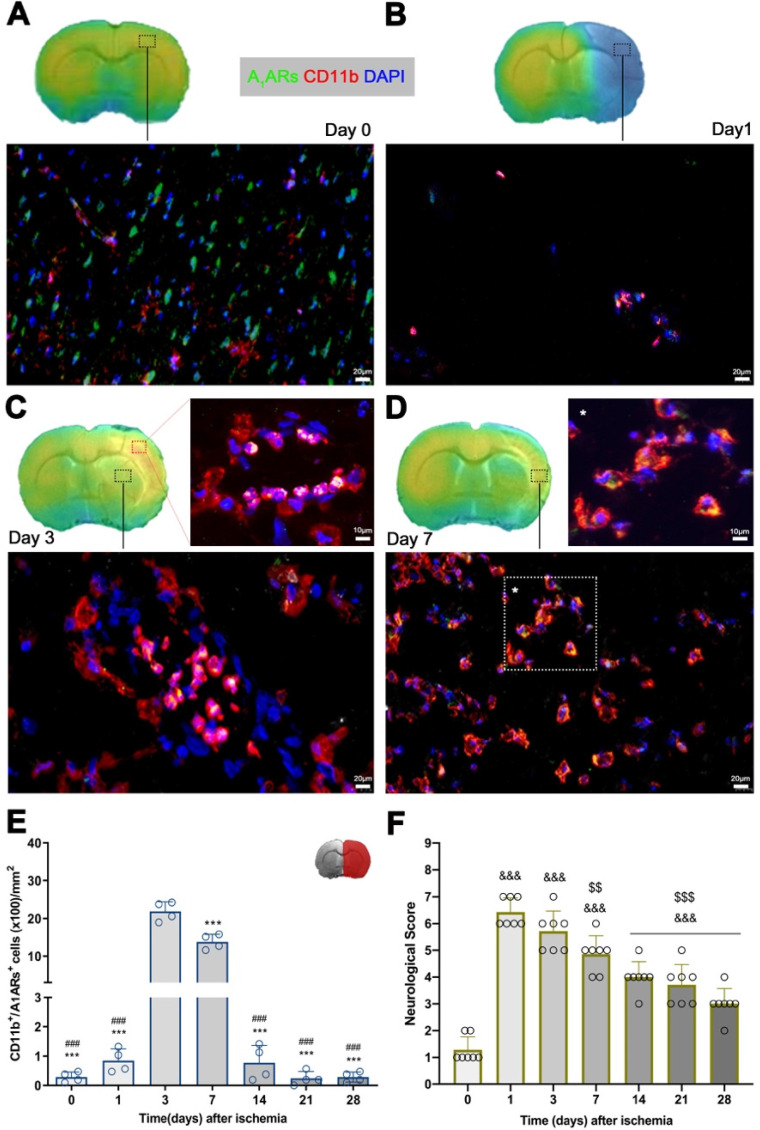
Figure 5.
Immunofluorescent labeling of A1ARs (green), CD11b (red) and DAPI (blue) in the ischemic region, shown as merged channels and neurological outcome after ischemia. The data show the temporal evolution of A1ARs expression in microglia and infiltrated leukocytes (macrophages and neutrophils) expressing CD11b at day 0 (A), day 1 (B), day 3 (C) and day 7 (D) after ischemia. The number of CD11b-reactive microglia and infiltrated leukocytes (n = 4) were measured at different time points in the infarcted brain hemisphere (E). The upper right panel of this figure show the selected brain ROI for the quantification defined on an axial slice of a MRI (T2W) template. The neurological score show an improvement over time (F). ***p < 0.01 compared with day 3; ###p < 0.01 compared with day 7; &&&p < 0.01 compared with day 0 and $$p < 0.01 and $$$p < 0.01 compared with day 1. Scale bars, 10 and 20 µm. Values are presented as scatter dot blot (mean ± SD).

