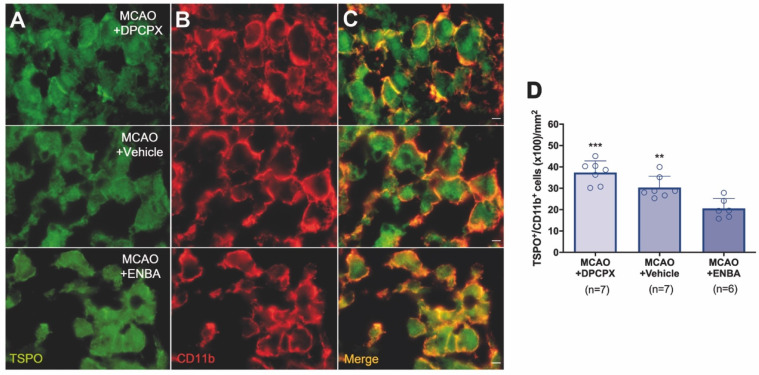
Figure 7.
Immunofluorescent labeling of TSPO (green) and CD11b (red) in the ischemic area, shown as two channels. The data show TSPO expression in microglia/macrophages at day 7 after MCAO in DPCPX (upper row), vehicle (middle row), and ENBA-treated rats (lower row). TSPO expression (A) in CD11b-reactive microglia/macrophages (B) decreases after MCAO in ENBA-treated rats in merged images of two immunofluorescent antibodies (C). The number of CD11b-reactive microglia/macrophages expressing TSPO was evaluated at day 7 after daily treatment with DPCPX (n = 7), Vehicle (n = 7) and ENBA (n = 6) (D). **p < 0.01 and ***p < 0.01 compared with MCAO+ENBA. Scale bars, 5 µm. Values are presented as scatter dot blot (mean ± SD).

