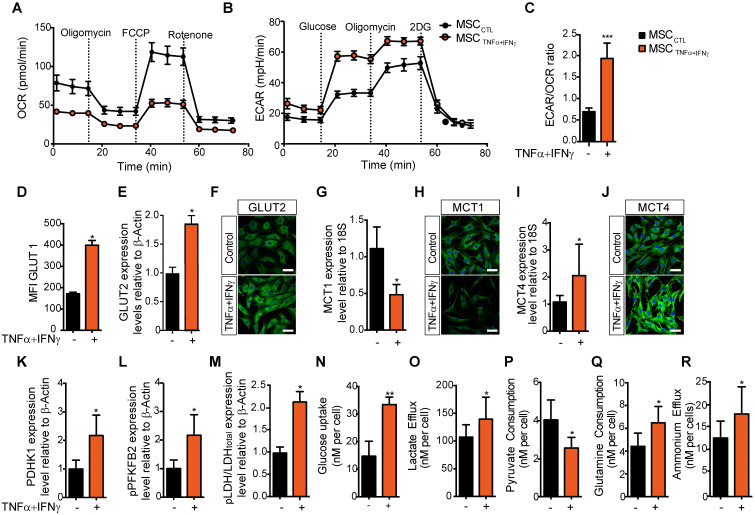
Figure 1.
MSC immunosuppressive activity is associated with a switch towards a glycolysis-dependent metabolism. (A-C) The metabolic profile of MSC incubated (orange) or not (black) with pro-inflammatory cytokines for 24 h was evaluated by measuring the oxygen consumption rates (OCR) (A), the extracellular acidification rate (ECAR) of the medium (B), and the ECAR/OCR ratio (C) using the Agilent Seahorse XF technology. Data are the mean ± SD of at least 4 independent experiments; *** p <0.001 (unpaired Mann-Whitney test). (D-O) The expression, uptake, consumption or efflux of enzymes and metabolites associated with glycolysis or OXPHOS was determined in MSC incubated or not with TNFα and IFNγ for 24 h. The expression levels of the specific glucose transporters GLUT1 (D) and GLUT2 were quantified by FACS and western blotting (E), or immunofluorescence (F) analysis. The expression levels of the monocarboxylate transporters MCT1 (G, H) and MCT4 (I, J) were quantified by qPCR or immunofluorescence. The expression levels of enzymes associated with glycolysis, (K) PDHK1 and (L) phosphorylated (p) PFKFB2 and (M) pLDH, were quantified by western blotting. (N) 2-deoxy-D-glucose (2DG) radioactive uptake in cultured MSC was assessed using 10 mM deoxyglucose (O) Lactate efflux, (P) pyruvate consumption rate, (Q) glutamine consumption rate and (R) ammonium efflux were quantified from the supernatants of murine MSC activated or not with TNFα and IFNγ using an YSI analyzer. Data are the mean ± SD of at least 4 independent experiments; *: p < 0.05, **: p < 0.01 (unpaired Mann-Whitney test).

