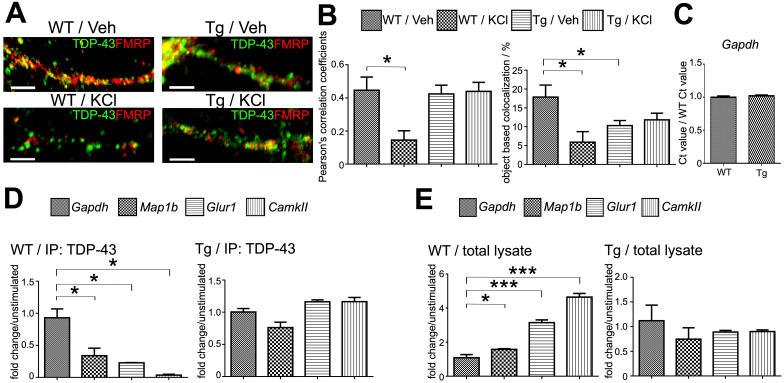
Figure 4.
Activity-dependent dynamic of TDP-43 containing neuronal RNA granules and its impairment in TDP-43 proteinopathy. (A) Confocal microscopy images show the immunocytochemistry staining of TDP-43 and FMRP in WT or TDP-43 Tg primary mouse cortical neurons after KCl or vehicle treatment. Scale bar: 5 µm. (B) Pearson's correlation coefficient and object based colocalization analysis of TDP-43 and FMRP in WT or TDP-43 Tg neurons with or without KCl stimulation. The data represent the average and SEM of n ≥ 3 biological repeats. (C) Normalized Gapdh RNA levels in WT and TDP-43 Tg neurons. The data represent the average and SEM of n ≥ 3 biological repeats. (D) Representative bar graph showing the fold change of TDP-43 co-immunoprecipated RNA levels in KCl stimulated WT and TDP-43 Tg neurons compared to unstimulated neurons. The data represent the average and SEM of n ≥ 3 biological repeats. (E) Representative bar graph showing the fold change of free form of RNA levels in KCl-stimulated WT and TDP-43 Tg neurons compared to unstimulated neurons. The data represent the average and SEM of n ≥ 3 biological repeats.

