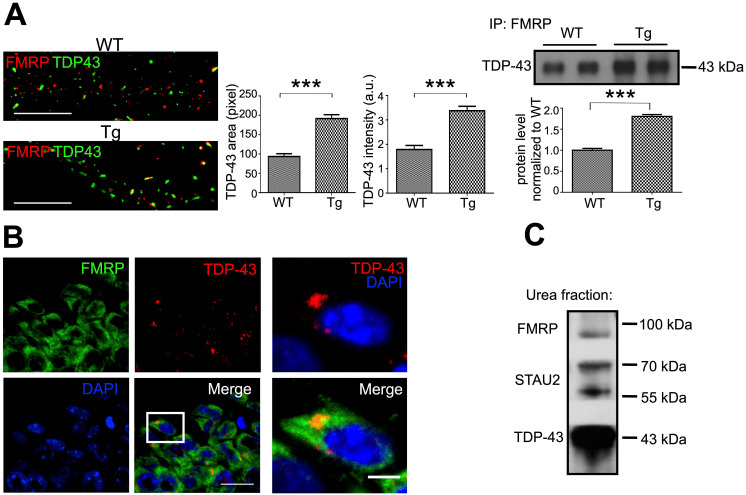
Figure 6.
Neuronal mRNP granules promote pathological TDP-43 inclusion. (A) Representative dSTORM images of TDP-43 and FMRP in WT and TDP-43 Tg primary mouse cortical neuronal cells are shown (left panels). Scale bar: 5 µm. The corresponding quantification of TDP-43 area and TDP-43 intensity (middle panels) is shown. The data represent the average and SEM of n ≥ 3 biological repeats. Representative blots and corresponding quantification showing the immunoprecipated level of TDP-43 with FMRP in WT and TDP-43 Tg primary mouse cortical neuronal cells (right panels). (B) Representative immunofluorescence staining of TDP-43 and FMRP in adult TDP-43 Tg mouse hippocampal CA1 area is shown. Scale bar: 20 µm and 5 µm (magnified images) (C) Representative blot showing the expression of TDP-43, STAU2 and FMRP in urea soluble fractions.

