Abstract
Intrarenal angiotensin II is increased in kidney diseases independently of plasma angiotensin II and is thought to promote progressive deterioration of renal architecture. Here we investigated the mechanism of enhanced renal angiotensin II generation in kidney glomerular diseases. For this, kidney- or liver-specific angiotensinogen gene (Agt) knockout was superimposed on the mouse model of inducible podocyte injury (NEP25). Seven days after induction of podocyte injury, renal angiotensin II was increased ninefold in NEP25 mice with intact Agt, accompanied by increases in urinary albumin and angiotensinogen excretion, renal angiotensinogen protein, and its mRNA. Kidney Agt knockout attenuated renal Agt mRNA but not renal angiotensin II, renal, or urinary angiotensinogen protein. In contrast, liver Agt knockout markedly reduced renal angiotensin II to 18.7% of that of control NEP25 mice, renal and urinary angiotensinogen protein, but not renal Agt mRNA. Renal angiotensin II had no relationship with renal Agt mRNA, or with renal renin mRNA, which was elevated in liver Agt knockouts. Kidney and liver dual Agt knockout mice showed phenotypes comparable to those of liver Agt knockout mice. Thus, increased renal angiotensin II generation upon severe podocyte injury is attributed to increased filtered angiotensinogen of liver origin resulting from loss of macromolecular barrier function of the glomerular capillary wall that occurs upon severe podocyte injury.
Keywords: glomerular filtration barrier, nephrotic syndrome, podocyte, proteinuria, renin–angiotensin system
In many forms of kidney disease, pharmacological intervention of angiotensin II (AII) has salutary effects, although plasma AII is generally not elevated. In normal condition, intrarenal AII is above its level in the plasma, and increases further in chronic kidney diseases.1–9 These findings have collectively formed the prevailing notion that the intrarenal AII is regulated differently from plasma AII, thereby exerting detrimental effects on the renal structure. Among the several mechanisms proposed7–19 for the increased AII, transcriptional activation of the renal angiotensinogen (Agt) gene is thought to play a central role in view of readily demonstrable expression of Agt mRNA in the kidney.
Agt protein mainly exists in proximal convoluted tubules (S1 and S2 segments). On the other hand, S3 segment contains more Agt mRNA than S1 and S2,20,21 although earlier reverse transcriptase–PCR study by Terada et al.22 showed that both proximal convoluted and straight tubules express Agt mRNA. Nevertheless, concurrent increases in Agt mRNA and protein seen in renal tissue homogenates have been taken to indicate that transcriptional activation of the renal Agt gene causes an increase in renal AII.
In this regard, Pohl et al.21 elegantly demonstrated that Agt is a ligand of megalin and that the renal Agt protein detectable by immunostaining is taken up from glomerular filtrate by megalin-dependent endocytosis and its localization is distinct from that of Agt mRNA.
We recently demonstrated that kidney (proximal straight tubule)–specific Agt knockout (KO) mice have markedly decreased renal Agt mRNA, but renal Agt protein and AII content are unaffected.23 In contrast, KO of the liver Agt gene near completely abolishes renal Agt protein and markedly decreases AII contents. Thus, clearly, the liver-derived Agt is the major source of renal AII in basal condition. This observation led us to speculate that the functional integrity of glomerular capillary wall as a molecular barrier may determine the renal AII synthesis in progressive glomerular diseases. To test this idea, we analyzed NEP25 mice in which injury can be induced in a podocyte-specific manner by injection of immunotoxin, LMB2.24 After induction of podocyte injury, renal Agt protein and AII increased along with an increase in urinary Agt excretion. Moreover, analysis in NEP25 mice carrying mosaic tubular megalin KO revealed that tubular distribution of Agt protein in proteinuric state is also completely dependent on megalin. These collectively suggested that an increase in the leakage of plasma Agt into tubular lumen is the major mechanism of increased renal AII in proteinuric glomerular diseases.
Earlier studies by others, however, reported that in various disease models,11,25–28 the Agt transcription in the proximal tubule is enhanced, raising the possibility that renal Agt mRNA may contribute to renal AII synthesis in kidney diseases.29 This study aims to determine the contribution of the kidney- versus liver-derived Agt to the renal AII generation in glomerular diseases with podocyte injury.
RESULTS
Podocyte injury results in massive leakage and renal incorporation of liver-originated Agt protein
We generated NEP25 mice carrying four types of Agt genotypes: control intact Agt (AgtloxP/loxP), kidney Agt KO (KAP-Cre:AgtloxP/loxP), liver Agt KO (albumin-Cre:AgtloxP/loxP), and dual Agt KO (KAP-Cre:albumin-Cre:AgtloxP/loxP). In kidney Agt KO mice, the Agt gene in proximal tubules is mostly disrupted, and renal Agt mRNA level is decreased to 14% of that in control or wild-type mice. In liver Agt KO mice, the Agt gene in the liver is near completely knocked out.23 The four types of mice were injected with LMB2 (0, 1.25, or 2.5ng per g body weight (BW)) to induce podocyte injury.
At 7 days after 1.25 or 2.5 ng per g BW of LMB2, all types of mice developed massive proteinuria, with urinary albumin/creatinine (Cr) ratio >60 mg/mg (Figure 1). Analysis in separate mice indicated that blood pressure is not affected by 2.5 ng per g BW of LMB2 in control, kidney, and liver Agt KO mice (Supplementary Table S1 online). Cystatin C did not significantly change (Supplementary Table S2 online).
Figure 1 |. Urinary albumin/creatinine ratio (U-Alb/Cr).
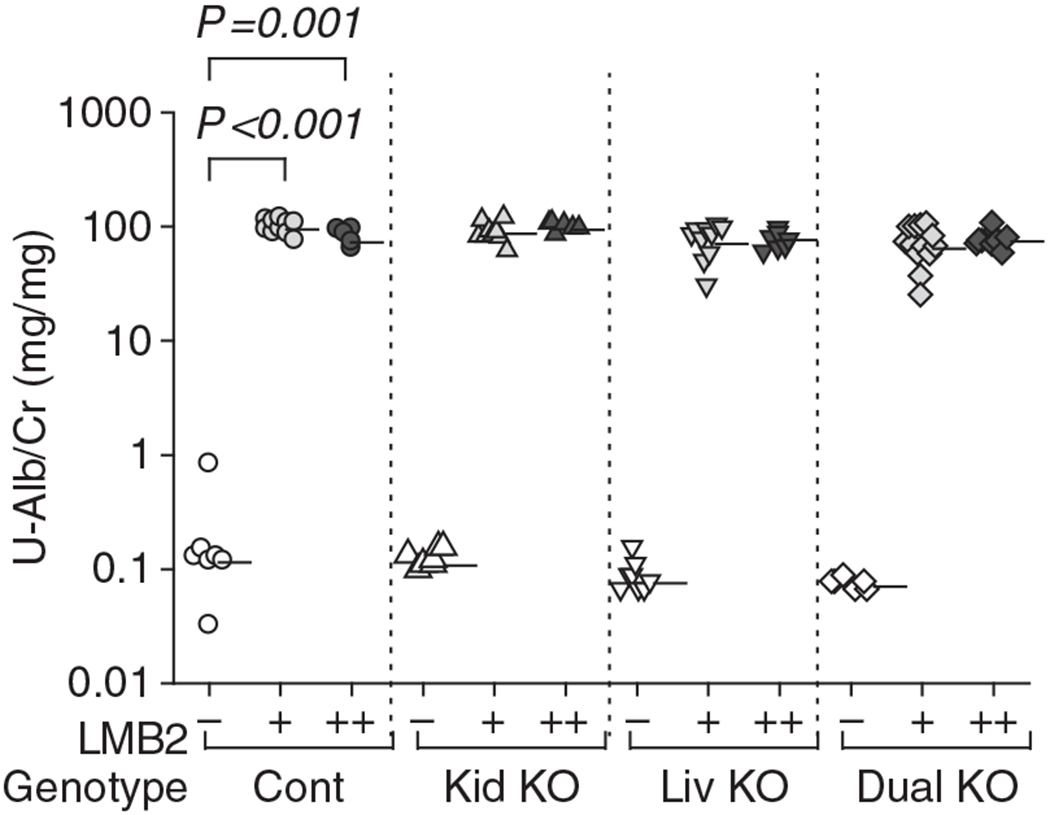
NEP25 mice with control Agt genotype (Cont), kidney Agt knockout (Kid KO), liver Agt KO (Liv KO), and dual Agt KO (Dual KO) were injected with 1.25 or 2.5 ng per g body weight (BW) of LMB2 (depicted by ‘+’ and ‘+ +’, respectively) to induce podocyte injury or vehicle (−) and analyzed 7 days later. All types of mice developed massive proteinuria after LMB2 injection. Horizontal bars represent geographical means. The statistical method is described in detail in the legend of Figure 3. For comparison among genotypes at each LMB2 dose, data of Figures 1, 3, 5, and 7a are presented separately for each LMB2 dose in Supplementary Figure S3 online. Representing numerical values are shown in Supplementary Table S3 online.
The mice injected with LMB2 did not develop glomerulosclerosis or interstitial fibrosis at this time point (Supplementary Figure S1 online). Nephrin staining was diminished, depending on the dose of LMB2 (Figure 2a and Supplementary Figure S2 online). Liver Agt KO and dual Agt KO mice showed significantly more preserved nephrin after 1.25 ng per g BW of LMB2 than control Agt mice given the same does of LMB2. However, after 2.5 ng per g BW of LMB2, mice of all genotypes showed comparably severe nephrin loss (Figure 2a). Control and kidney Agt KO mice similarly showed early sign of tubulointerstitial damage, including tubule dilatation, tubule apoptosis, and proliferation (Ki67) of tubular and interstitial cells (Figure 2b–e). There was a tendency that liver or dual Agt KO mice develop milder tubule apoptosis and Ki67 after 1.25 ng per g BW of LMB2, but more severe tubule dilatation and interstitial Ki67 after 2.5 ng per g BW of LMB2.
Figure 2 |. Morphometric evaluation.
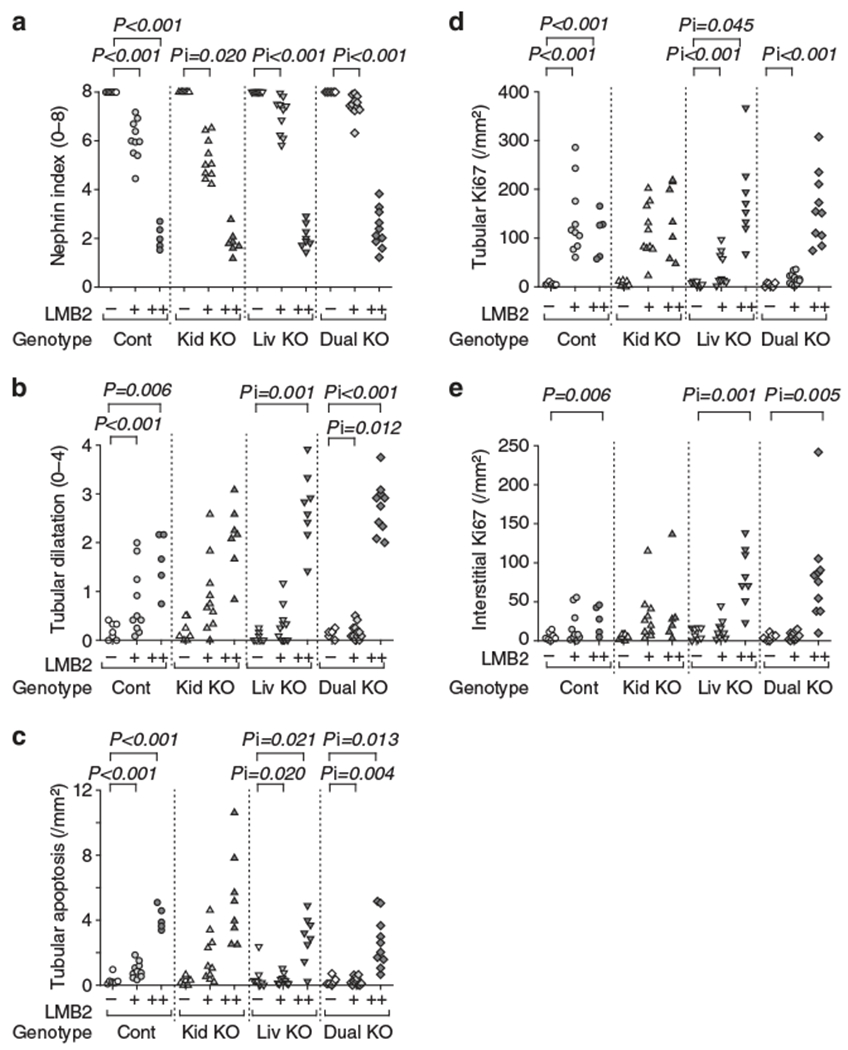
(a) Nephrin staining index. LMB2 dose-dependently decreased nephrin index in control mice. After 1.25 ng per g body weight (BW) of LMB2 (+), kidney Agt knockout (KO) mice (Kid KO) showed slightly more diminished nephrin, but liver Agt KO (Liv KO) and dual Agt KO (Dual KO) mice showed more preserved nephrin staining. After 2.5 ng per g BW of LMB2 (+ +), mice in all genotypes showed uniformly severe nephrin loss. (b) Tubule dilatation. LMB2 induced tubule dilatation similarly in control (Cont) and kidney Agt KO mice. In dual Agt KO mice after 1.25 ng per g BW of LMB2, tubule dilatation is milder than that in control mice with the same dose of LMB2. After 2.5 ng per g BW of LMB2, both liver and dual Agt KO mice showed more severe dilatation than that in control mice with the same dose of LMB2. (c) Tubule apoptosis. LMB2 induced tubular apoptosis similarly in control and kidney Agt KO mice. Liver and dual Agt KO mice showed less apoptosis after 1.25 ng per g BW of LMB2, but more apoptosis after 2.5 ng per g BW of LMB2 than that in control mice with the same dose of LMB2. (d) Tubule proliferation (Ki67). LMB2 increased tubular Ki67 similarly in control and kidney Agt KO mice. Liver and dual Agt KO mice showed less Ki67 after 1.25 ng per g BW of LMB2 than that in control mice with the same dose of LMB2. Liver Agt KO mice showed more Ki67 after 2.5 ng per g BW of LMB2 than that in control mice with the same dose of LMB2. (e) Interstitial cell proliferation (Ki67). In control and kidney Agt KO mice, 2.5 ng per g BW of LMB2 similarly significantly increased interstitial Ki67. Liver and dual Agt KO mice showed more interstitial Ki67 after 2.5 ng per g BW of LMB2 as compared with control mice. The statistical method is described in detail in the legend of Figure 3.
In control Agt mice, LMB2 markedly and dose-dependently increased renal Agt protein (Figure 3). Kidney Agt KO showed similar level of Agt protein at the basal condition and similarly increased Agt after injection of LMB2. In contrast, liver Agt KO markedly reduced renal Agt protein in both podocyte-intact and podocyte-injured conditions. Dual Agt KO mice showed similar patterns to those of liver Agt KO mice.
Figure 3 |. Liver- but not kidney-specific Agt KO abrogates the increase in renal Agt protein induced by podocyte injury.
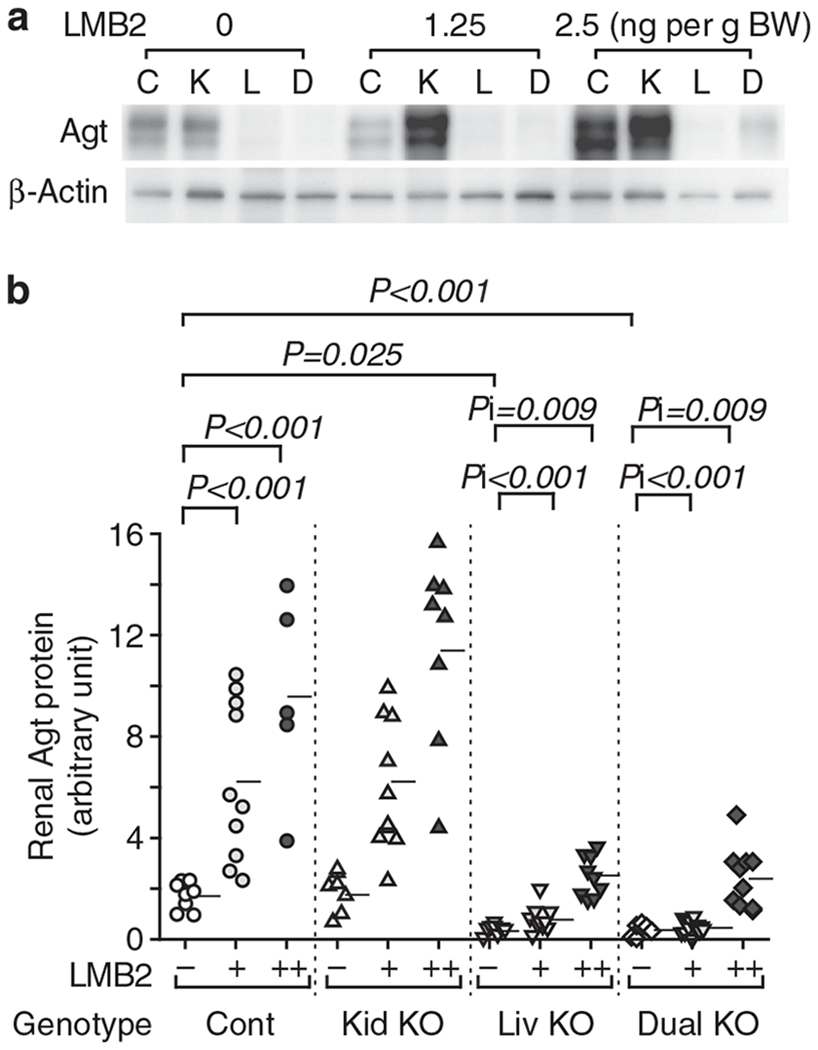
(a) Representative western analysis for renal Agt protein. C, control; D, dual Agt knockout; K, kidney Agt knockout; L, liver Agt knockout. (b) Renal Agt protein content determined by densitometric analysis. Renal Agt protein was increased in control mice dose-dependently after LMB2 injection. Kidney Agt KO mice showed similar levels of renal Agt protein to those of control mice both before and after LMB2. Liver and dual Agt KO mice had comparably dampened the levels of renal Agt protein before and after LMB2 when compared with control and kidney Agt KO mice. Horizontal bars represent means. Data were analyzed by generalized estimating equation method. Statistical significance for main effects and interaction are shown by P and Pi, respectively. Only significant P and Pi values are shown. LMB2 1.25 ng per g body weight (BW; +) and 2.5 ng per g BW (+ +) significantly increased Agt protein in control Agt mice (P < 0.001, P < 0.001). Without LMB2 (−), liver and dual Agt KO mice showed less Agt protein than control Agt mice (P = 0.025, P = 0.001). In liver Agt KO mice, the increments of Agt protein by LMB2 (1.25, 2.5 ng per /g BW) were significantly less than those in control Agt mice (Pi < 0.001, Pi < 0.001). Kidney Agt KO mice showed similar response to control Agt mice, and dual Agt KO mice showed similar response to liver Agt KO mice.
Immunostaining for Agt paralleled to the result of western analysis. Thus, after injection of LMB2, control and kidney Agt KO mice showed similarly intense granular staining in proximal tubule cells (Figure 4). Along the S3 segment, where Agt mRNA is intensely expressed, kidney Agt KO did not attenuate Agt staining to any appreciable extent. In contrast, liver and dual Agt KO mice showed almost no staining after 1.25 ng per g BW of LMB2. After 2.5 ng per g BW of LMB2, although focal Agt staining was discernible along with proteinaceous casts, it was far less than that in control or kidney Agt KO mice.
Figure 4 |. Representative pictures for Agt immunostaining.
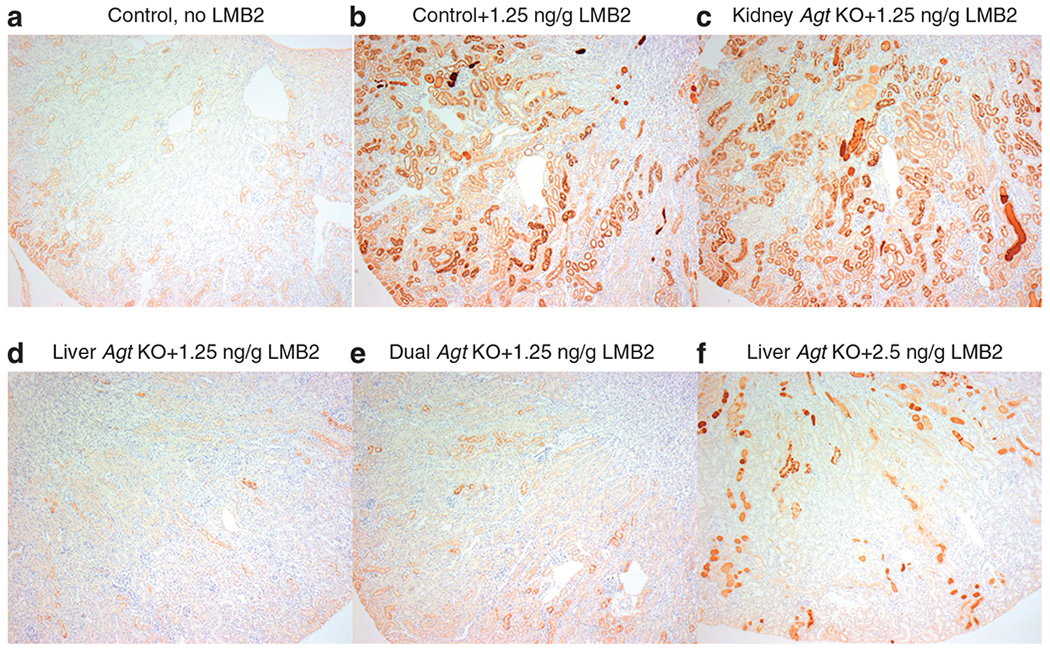
Control Agt mice (a) showed weak staining mainly in S1 and S2 segments of proximal tubules. After injection of 1.25 ng per g body weight (BW) of LMB2, control Agt mice (b) showed intense Agt staining in S1–S3 segments. Kidney Agt knockout (KO) mice injected with 1.25 ng per g BW of LMB2 (c) showed intense Agt staining, which is similar to that of control Agt mice. In contrast, liver (d) and dual (e) Agt KO mice comparably and markedly dampened the otherwise expected heightened Agt staining that followed 1.25 ng per g BW of LMB2. After 2.5 ng per g BW of LMB2, liver Agt KO mice (f) showed focal Agt staining along with proteinase casts (original magnification ×50).
Similar trend was observed in urinary Agt excretion but in a more dramatic manner. Thus, urinary Agt/Cr ratio increased ~300-fold after 1.25 ng per g BW of LMB2, and 1300-fold after 2.5 ng per g BW of LMB2 in control mice (Figure 5). Kidney Agt KO mice showed similar patterns to those in control mice. In contrast, Agt/Cr ratio in liver Agt KO mice after 1.25 and 2.5 ng per g BW of LMB2 remained at levels of only 5% and 3%, respectively, of those in control mice injected with the same dose of LMB2. Dual Agt KO mice showed similarly low urinary Agt. Within control and kidney Agt KO mice injected with LMB2, urinary albumin and urinary Agt concentration were significantly correlated (r = 0.399, P = 0.029; Figure 5).
Figure 5 |. Podocyte injury causes massive leakage of liver-derived Agt into the urine.
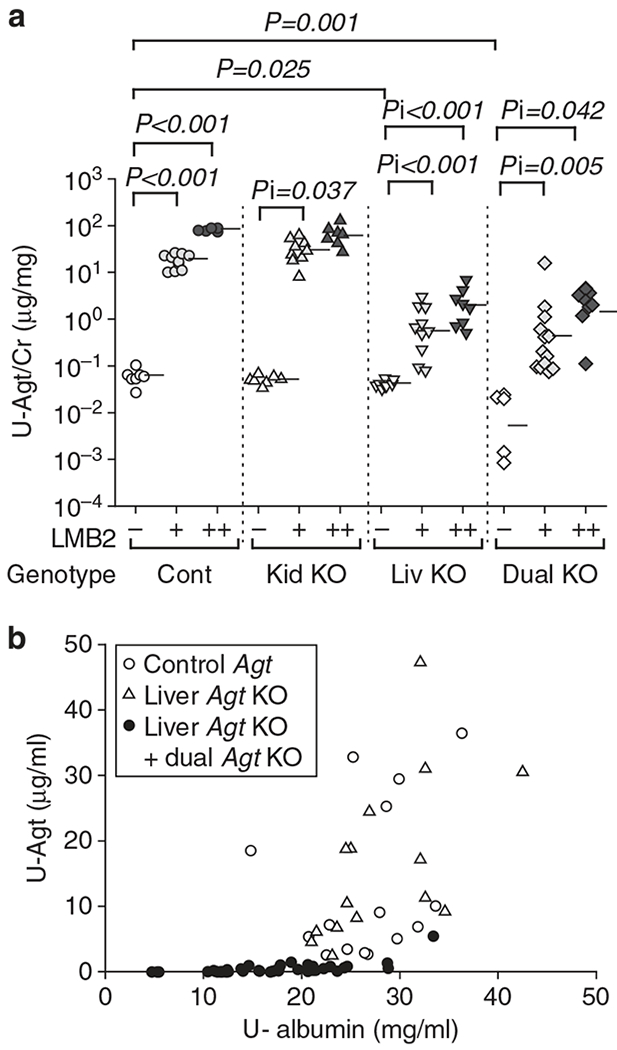
(a) Urinary Agt/creatinine ratio (U-Agt/Cr). Control (Cont) and kidney Agt knockout (KO) mice (Kid KO) showed similar dose-dependent increase in urinary Agt/Cr ratio after LMB2. Liver Agt KO (Liv KO) and dual Agt KO (Dual KO) mice showed significantly attenuated urinary Agt/Cr ratio when compared with control and kidney Agt KO mice for the same dose of LMB2. Previously, we found that kidney Agt KO showed lower urinary Agt at baseline than control mice. In this study, this was not reproduced probably because of the limited number of mice. Horizontal bars represent geographical means. (b) Correlation between U-Agt and albumin concentration. In control (represented by open circles) and kidney Agt KO mice (open triangles) injected with either dose of LMB2, a significant correlation exists between urinary albumin and Agt concentration (r = 0.399, P = 0.029). Of note, liver and dual Agt KO mice (closed circles) showed uniformly low urinary Agt irrespective of urinary albumin levels.
Separately, the effect of podocyte damage on plasma Agt was studied in NEP25 mice (n = 5) with wild-type Agt allele. Plasma Agt was, on average, 2.7 ± 0.3 μg/ml before LMB2 injection, and decreased, on average, to 1.7 ± 0.3 μg/ml at 7 days after injection of 2.5 ng per g BW of LMB2 (P < 0.05). Hepatic Agt mRNA in these mice after LMB2 injection increased to 3.4-fold of that in normal mice without podocyte injury (n = 6). We also tested whether Agt within the vascular bed and the interstitial space of the kidney increases after podocyte injury. The blood and interstitial fluid within the kidney were harvested by perfusion. In mice without podocyte injury (n = 5), Agt concentration normalized by red blood cell volume in the perfusate was, on average, 1.9-fold of that in the blood collected from the tail artery, likely reflecting that the perfusate contains Agt from the interstitial fluid. In NEP25 mice at 7 days after induction of podocyte injury with 2.5 ng per g BW of LMB2 (n = 5), this ratio remained similar, averaging 1.7. These indicate that Agt content in the vascular bed or the interstitial space does not increase after podocyte injury (Supplementary Table S4 online).
These results are taken to indicate that podocyte injury increases glomerular leakage of liver-derived plasma Agt in parallel with albumin, and leads to increase in renal Agt protein. Thus, most renal Agt protein is originated from the liver in glomerular diseases with podocyte injury, a pattern identical to that found in normal condition.
Liver Agt KO, but not kidney Agt KO, abrogates the renal AII increase in podocyte injury
In control mice, LMB2 dose-dependently increased renal AII (Figure 6). Kidney Agt KO had no impact on renal AII both before and after LMB2 injection. In contrast, liver Agt KO mice, except for one mouse, uniformly showed low level of renal AII in both basal and proteinuric conditions. Dual Agt KO mice showed similar low level of renal AII, but no further suppression was observed. The results indicate that in glomerular diseases with podocyte injury, most, if not all, renal AII is originated from the liver-derived Agt.
Figure 6 |. Liver- but not kidney-specific Agt KO abrogates the increase in renal angiotensin II (AII) induced by podocyte injury.
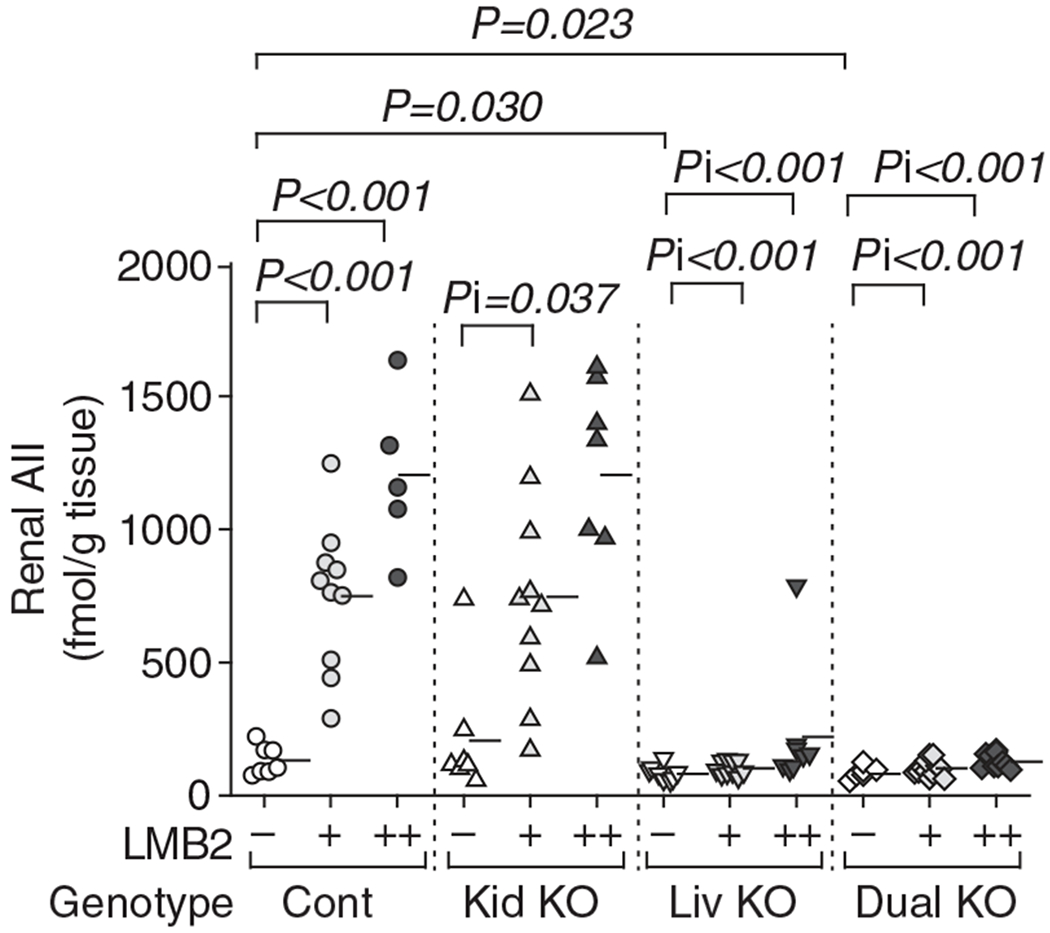
Control (Cont) and kidney Agt knockout (KO) mice (Kid KO) showed dose-dependent increase in renal AII after LMB2 in a similar manner. In contrast, both liver Agt KO (Liv KO) and dual Agt KO (Dual KO) mice uniformly showed low renal AII both before and after LMB2. One liver Agt KO mouse injected with 2.5 ng per g body weight (BW) of LMB2 showed exceptionally high renal AII. The level of renal Agt mRNA in this mouse was not elevated, and was lower than the average value of control Agt mice without LMB2. Horizontal bars represent means.
Podocyte injury leads to a small increase in renal Agt mRNA that is not correlated with the renal AII content
In control Agt mice, renal Agt mRNA increased dose-dependently after injection of LMB2 (Figure 7a). At the basal condition, kidney Agt KO mice showed lower level of Agt mRNA than control mice. As KO of the renal Agt gene was, at best, partial, residual renal Agt gene was activated after LMB2 injection. With 1.25 ng per g BW of LMB2, Agt mRNA increased to a level comparable to that of control mice without LMB2, but still remained lower than the level of control mice with the same dose of LMB2. With 2.5 ng per g BW of LMB2, renal Agt mRNA increased to a level comparable to that of control mice given the same dose of LMB2. Liver Agt KO mice showed similar pattern to control mice, and dual Agt KO mice showed similar pattern to kidney Agt KO mice.
Figure 7 |. Podocyte injury induces a small increase in renal Agt mRNA that is not correlated with renal angiotensin II (AII).
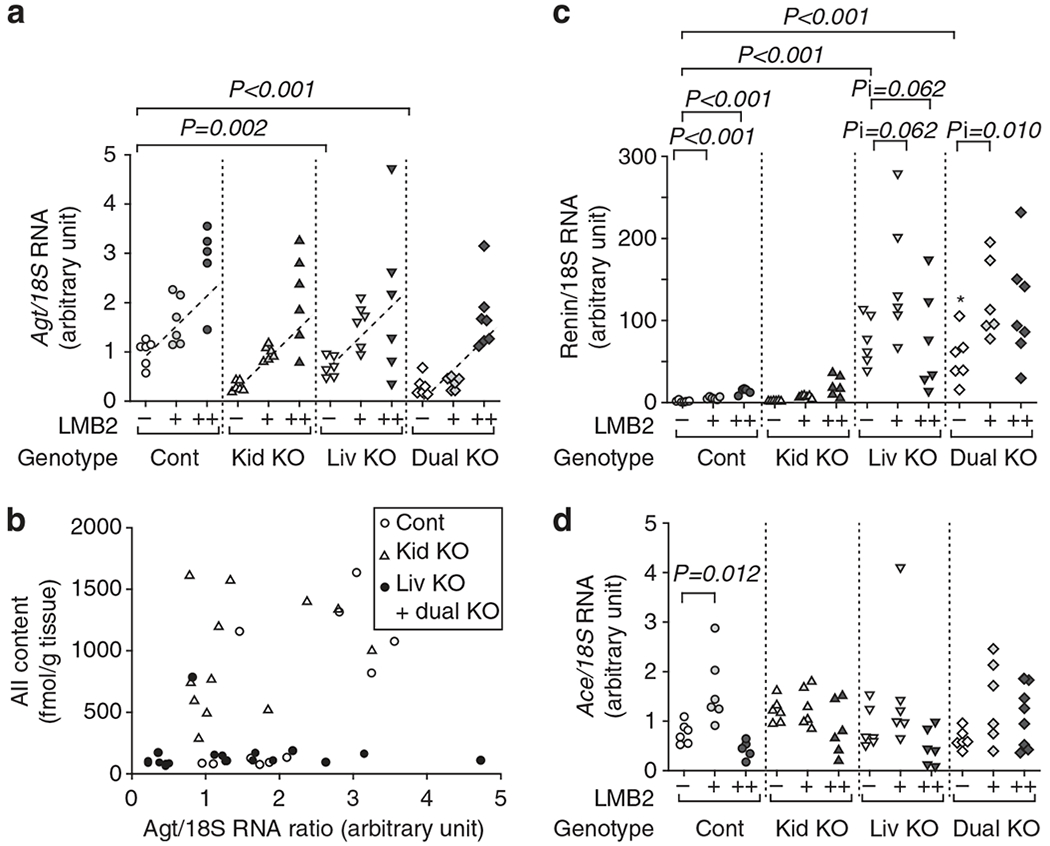
(a) Renal Agt mRNA/18S rRNA (Agt/18S RNA) ratio. In each genotype, LMB2 increased Agt/18S RNA dependently on the LMB2 dose with a similar slope. Without LMB2, kidney Agt knockout (Kid KO) and dual Agt KO (Dual KO) mice had less Agt/18S RNA than control Agt (Cont) mice. Consequently, kidney and dual Agt KO mice given 1.25 ng per g body weight (BW) of LMB2 showed lower Agt/18S RNA than control Agt mice given the same dose of LMB2. Liver Agt KO (Liv KO) mice showed a pattern similar to that of control Agt mice. Graphs expressing data for each LMB2 dose are presented in Supplementary Figure S3 online. (b) Relationship between renal Agt mRNA and angiotensin II (AII) content after injection of LMB2. In liver and dual Agt KO mice (closed circles), AII content was uniformly low regardless of the Agt mRNA level. In contrast, control (open circles) and kidney Agt KO (open triangles) mice showed high AII content, which was not associated with renal Agt mRNA (r = 0.330, P = 0.124). (c) Renal renin mRNA/18S rRNA (renin/18S RNA) ratio. Without LMB2, liver and dual Agt KO mice showed markedly higher renal renin/18S RNA than control mice. LMB2 injection slightly increased renin/18S RNA in control Agt KO mice. Kidney Agt KO mice showed a pattern similar to that of control mice. Increments of renin/18S RNA by LMB2 in liver and dual Agt KO mice were more than those in control mice. These changes are not in parallel with the renal AII content. Renal Ace mRNA/18S rRNA (Ace/18 S RNA) ratio. (d) Renal Ace mRNA was not affected by LMB2 injection in any of the Agt genotypes, and there was no significant difference among Agt genotypes, except for a small increase by 1.25 ng per g body weight (BW) of LMB2 in control mice.
To examine the site of Agt mRNA upregulation, we dissected kidneys from NEP25 mice carrying wild-type Agt allele and quantified by real-time reverse transcriptase–PCR. Without podocyte injury, the superficial cortex contains Agt mRNA, which is only 6.8% that of the outer medulla, confirming that the S1 and S2 segments contain only small amount of Agt mRNA in normal condition. At 7 days after injection of 2.5 ng per g BW of LMB2, Agt mRNA increased in both the superficial cortex and the outer medulla (Supplementary Table S5 online), indicating that Agt mRNA was upregulated in the region not targeted by KAP-Cre.
Figure 7b shows the relationship between renal Agt mRNA and renal AII content after injection of LMB2. The AII content in liver and dual Agt KO mice was uniformly low regardless of the Agt mRNA level. In contrast, control and kidney Agt KO mice showed high renal AII content that was dissociated from renal Agt mRNA (r = 0.33, P = 0.124).
Renal renin mRNA markedly increased in liver and dual Agt KO mice (Figure 7c). LMB2 injection led to a slight increase in renin mRNA in control and kidney Agt KO mice, and a more marked increase in it in liver and dual Agt KO mice. These changes were not parallel with that of renal AII content. Renal Ace mRNA was not affected by LMB2 injection in any of the Agt genotypes, except for an increase seen with 1.25 ng per g BW of LMB2 in control mice. Besides, there was no significant difference among the Agt genotypes (Figure 4d). Similarly, Ace mRNA was not in parallel with renal AII content.
Overall, none of these mRNAs in the kidney was in parallel with renal AII content.
Liver Agt KO attenuates sodium (Na) retention after podocyte injury
After injection with 1.25 ng per g BW of LMB2, 94.7% of control or kidney Agt KO mice showed readily appreciable ascites and edema in the mesentery that showed transparent jellylike appearance. In contrast, 30.4% of liver or dual Agt KO mice showed such phenotypes (P < 0.001). After injection with 2.5 ng per g BW of LMB2, 91.6% of control or kidney Agt KO mice developed massive ascites, some with leakage through the abdominal wall, and edema involving the intestinal wall. In contrast, 11.8% of liver or dual Agt KO mice showed such phenotypes (P < 0.001). These were not, however, reflected by the body weight gain, probably because of leakage of ascites through the abdominal wall and appetite loss caused by intestinal edema. The severer edema was reflected by lower urinary Na secretion that was discernible when urinary Na concentration was normalized by urinary albumin concentration (Figure 8). In all genotypes of mice injected with LMB2, urinary Na/albumin ratio was inversely correlated with renal AII content (Figure 8d).
Figure 8 |. Liver Agt knockout (KO) attenuates sodium (Na) retention after podocyte injury.
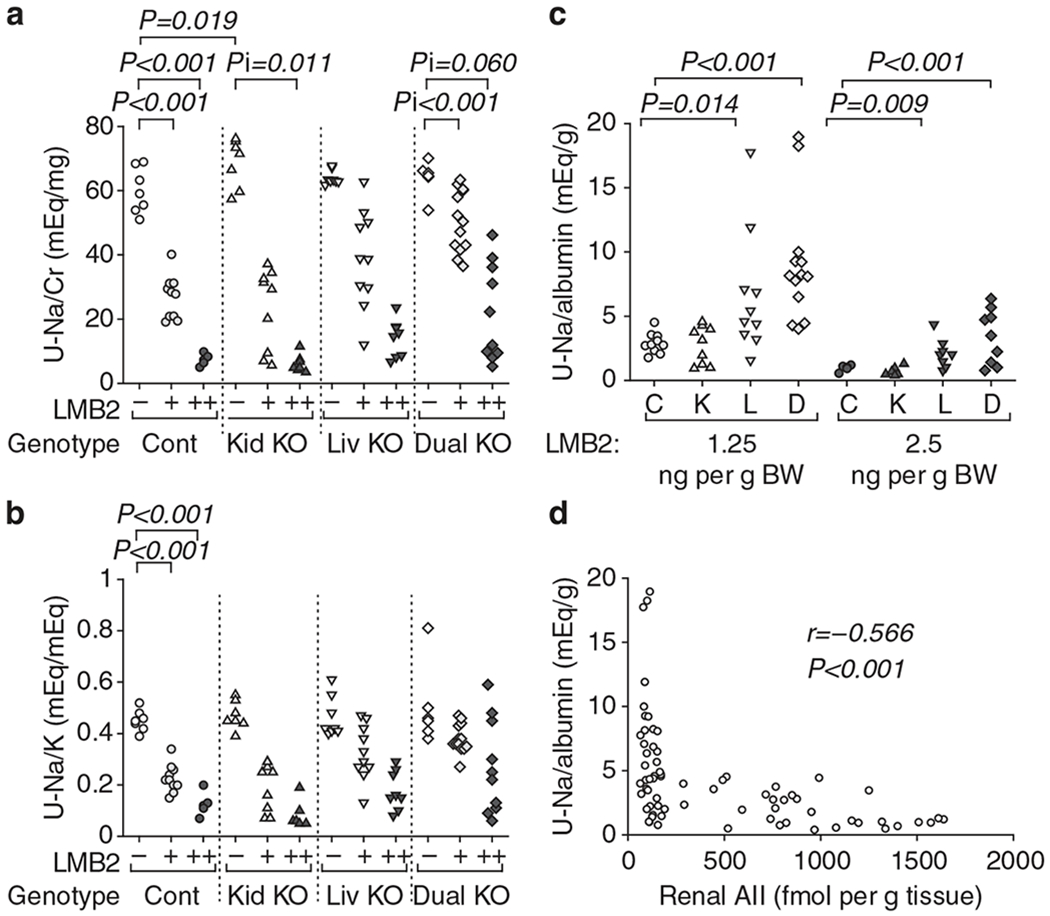
Control (Cont) and kidney Agt KO (Kid KO) mice showed dose-dependent decreases in (a) urinary sodium/creatinine (Na/Cr) and (b) sodium/potassium (Na/K) ratios after LMB2 injection. (c) Liver Agt KO (Liv KO) and dual Agt KO (Dual KO) mice injected with LMB2 showed significantly higher urinary Na concentration normalized by urinary albumin concentration than control mice. (d) In all genotypes of mice injected with LMB2, urinary Na/albumin ratio was inversely correlated with renal angiotensin II (AII) content (R = −0.566, P < 0.001).
DISCUSSION
Podocyte injury markedly increased renal AII content. Upon podocyte injury, renal AII increased, on average, to 1200 fmol/g in control Agt mice, a level 9 times of that found without podocyte injury, and 35 times the blood content in normal mice (data not shown). This marked increase was accompanied by increases in urinary Agt and renal Agt. These were all abolished by liver Agt KO, but not by kidney Agt KO, thus demonstrating unequivocally that renal AII that increases upon loss of molecular barrier function of the glomerular capillary wall originates from liver-derived Agt. As Agt content in the vascular and interstitial spaces remained unchanged after podocyte injury, the increased renal AII is likely generated from filtered Agt, although we did not directly test this notion. Apart from this is the fact that podocyte injury also enhanced renal Agt transcription. This occurred even in kidney Agt KO mice, resulting in elevation of renal Agt mRNA to a level comparable to that in control Agt mice after 2.5 ng per g BW of LMB2. Nevertheless, several lines of evidence indicate that the increased renal Agt mRNA has little contribution to the enhanced renal AII generation. First, after 1.25 ng per g BW of LMB2, kidney Agt KO mice showed attenuated renal Agt mRNA, but renal AII was similarly elevated to that in control Agt mice injected with the same dose of LMB2. Second, there was no correlation between renal Agt mRNA and renal AII in control and kidney Agt KO mice injected with LMB2. Third, liver Agt KO near completely abolished the otherwise anticipated renal AII increase regardless of the renal Agt mRNA level.
Notably, renin mRNA is increased by some 50 times in liver Agt KO mice compared with control Agt mice. Despite this marked renin mRNA increase, renal AII was suppressed in liver Agt KO mice both with and without podocyte injury. These indicate that renin is not the rate-limiting factor for renal AII generation in these conditions. Instead, availability of the substrate, Agt, determines the renal AII synthesis.
The present study investigated the renin–angiotensin system in kidneys with podocyte injury. Several studies reported renal AII increases along with small upregulation of renal Agt mRNA in animal models. The magnitude of renal Agt mRNA upregulation found in those studies, however, was uniformly small, for example, 1.2–1.5-fold in AII infusion,27,28,30 1.47-fold in a model of heart failure,31 2.0-fold in a uninephrectomy model,26 and 2.6-fold in a spontaneous hypertensive rat model.25 These are either comparable to, or less than, the magnitude observed in this study. Given the constitutively low renal AII in liver Agt KO mice with podocyte injury, it appears that an approximately twofold increase in renal Agt mRNA may not be sufficient to increase renal AII to an appreciable level.
Our previous study indicates that, in normal mice with intact podocytes, approximately a half of urinary Agt is derived from Agt synthesized in the proximal tubule, whereas this demonstrated that the massive urinary Agt seen in mice with podocyte injury is mostly derived from the liver. In concert with the latter notion, a clinical study by van den Heuvel et al.32 found that urinary Agt and albumin were correlated in diabetic patients. However, somewhat different observation was made by Nishiyama et al.33 They noted dissociation between the magnitude of urinary Agt excretion and that of proteinuria in glomerular diseases. Thus, urinary Agt was increased in patients with IgA nephropathy, but not in those with minor glomerular abnormalities, although the latter group had more marked proteinuria. The observed difference in the behavior of urinary protein versus Agt may best be explained by the difference in the electrical charge of the two similar-size molecules, that is, negatively charged albumin versus almost-neutral Agt. Thus, in glomerular diseases with minor barrier defect, that is, loss of charge selectivity, such as in minimal change disease, marked albuminuria develops whereas glomerular leak of Agt is hardly affected. In contrast, in glomerular diseases with severe barrier dysfunction, that is, loss of molecular size selectivity, angiotensinogenuria develops. In the latter condition, which is clinically characterized by nonselective proteinuria, glomeruli are at the risk of progressive deterioration, in which pharmacological inhibition of AII has often a salutary effect.
In a recent study, Nakano et al.34 studied to visualize glomerular permeability of Agt, using in vivo multiphoton imaging technique, and found it to be low in normal C57BL/6 mice. In addition, glomerular sieving coefficient of Agt was found not to be significantly increased in Munich–Wistar–Frömter rats, a model of glomerulosclerosis. The discordant results may reflect different nature of podocyte injury. The proteinuria in Munich–Wistar–Frömter rats is characterized by selective albuminuria, whereas that in NEP25 mice is nonselective.35 The model used in this study represented relatively severe conditions with prominent nonselective proteinuria. We also observed local enhancement of renal Agt staining in NEP25 mice given 0.625 ng per g BW of LMB2, and in a model of adriamycin nephropathy, as well as in another slowly progressive focal segmental glomerulosclerosis model, that is, transgenic mice expressing mutant α-Actinin-4 (Supplementary Figure S4 online). These suggest that podocyte injury that later leads to glomerulosclerosis involves leakage of Agt.
Liver Agt KO mice showed milder glomerular injury after a low dose (1.25 ng per g BW) of LMB2, but more severe tubule injury after a high dose (2.5 ng per g BW) of LMB2. These likely reflect the effects of low blood pressure and hypoperfusion, respectively. Yet, it is theoretically possible that the transcription of Agt in the kidney is increased in liver Agt KO mouse, thereby accounting for the somehow worsened tubular injury, although kidney Agt KO showed no protective effect. Notably, liver Agt KO markedly attenuated the severe edema that otherwise developed in immunotoxin-treated NEP25 mice. This attenuation was in parallel with the observed higher Na excretion in Agt KO mice than that in control or kidney Agt KO mice. As liver Agt KO dampens not only renal but also circulating AII, these effects of liver Agt KO on Na excretion are attributed to either loss of renal II or removal of AII from the circulation, or a combination thereof. With regard to the mechanism of edema formation in nephrotic syndrome, it is now believed that local, as opposed to systemic, mechanism exists within the kidney for salt retention.36 In this regard, this study has provided an attractive and plausible explanation, that is, enhanced production of AII in kidneys with podocyte damage. Further study is necessary to establish the role of so-locally produced AII.
In conclusion, this study indicated that the enhanced renal AII in severe podocyte damage is because of the loss of the barrier function of the glomerular capillary wall allowing massive influx of the AII precursor plasma Agt, and not to transcriptional activation of the Agt gene in renal cells.
MATERIALS AND METHODS
Animal experiments
Kidney (proximal tubule)-specific Agt KO mice, which carry KAP-Cre and AgtloxP/loxP, and liver (hepatocyte)-specific Agt KO mice, which carry albumin-Cre and AgtloxP/loxP, were previously reported.23 In the kidney of kidney Agt KO mice, Agt mRNA decreases to 14% of baseline after treatment of testosterone. In the kidney of liver Agt KO mice, Agt mRNA is almost completely abolished. These lines were mated with NEP25 mice, and the following four kinds of mice were generated and used for this study: namely, NEP25/control Agt (carrying NEP25/AgtloxP/loxP), NEP25/kidney Agt KO (NEP25/ KAP-Cre/AgtloxP/loxP), and NEP25/liver Agt KO (NEP25/albumin-Cre/AgtloxP/loxP). As KAP promoter is androgen dependent, only male mice treated with testosterone (50 μg per g BW subcutaneous, 5 times) were used for the experiments.
To induce podocyte injury, LMB2 (1.25 or 2.5 ng per g BW) was intravenously injected.24 On day 7, mice were killed and kidneys were harvested. For AII, protein, and mRNA assays, kidneys were frozen in liquid nitrogen. Before LMB2 injection and also before killing, 24-h urine was collected and the concentrations of creatinine, albumin, and Agt protein were determined as previously described.23
Morphometric analyses
Nephrin was stained and semiquantified as previously reported.37 Tubule dilatation was semiquantified using scores from 0 (no dilatation) to 4 (most extensive and severe dilatation) in 12 visual fields on periodic acid–Schiff–stained 2 μm sections, and average scores were calculated. Apoptotic cells were stained by TUNEL (TdT-mediated dNTP nick end labeling) method using a kit (Takara Bio, Otsu, Shiga, japan). The TUNEL-positive cells in tubules or in tubular lumen were counted in the whole cortex and outer medulla, and the density was calculated. Ki67 was stained using a monoclonal antibody (Leica Microsystems, Tokyo, japan). The Ki67-positive cells were counted separately within and outside tubules in the whole cortex and outer medulla, and the density was calculated.
Assays for renal AII content, renal and urinary Agt protein, and mRNAs
Kidneys were cut in half and immediately frozen in liquid nitrogen and stored at −80 °C. Renal AII content was determined by radioimmunoassay as previously described.23
Western analysis for Agt was performed as previously described. Under denatured conditions, 5 μg of renal protein from each mouse was separated in five sodium dodecyl sulfate–polyacrylamide gels each containing a common internal control sample. They were transferred onto polyvinylidene difluoride membrane. Agt protein was detected with rabbit anti-Agt antibody (Immuno-Biological Laboratories, Fujioka, Japan) diluted at 1:400 with Can Get Signal immunoreaction enhancer solution (Toyobo, Tokyo, Japan). Actin was detected with rabbit monoclonal anti-β-actin antibody (Cell Signaling Technology, Tokyo, Japan) diluted at 1:1000. Densitometric analysis was performed using CS analyzer (Atto, Tokyo, Japan).
Real-time reverse transcriptase–PCR was performed for Agt, renin, Ace mRNA, and 18S rRNA using TaqMan primer probe sets and StepOne Real Time PCR Systems (Life Technologies Japan, Tokyo, Japan). Relative amount for Agt, renin, and Ace mRNA was determined by the ΔΔCT method.
Plasma and urinary Agt was determined by enzyme-linked immunosorbent assay (ELISA; IBL, Fujioka, Gumma, Japan). The sensitivity of the ELISA kit is ⩾0.03 ng/ml. The specificity was verified by negative detection of Agt in plasma or urine from whole body Agt KO mice. For the assays, plasma samples were diluted 1000-fold, and urine samples from control and kidney Agt KO mice after LMB2 injection were diluted 9100-fold. Other urine samples were diluted 13-fold.
Statistical analysis
Data for urinary albumin/Cr ratio and urinary Agt/Cr ratio were analyzed by general linear model after logarithmic transformation to improve normality of residuals. For analyses where heteroscedasticity was observed even after transforming outcome variables, data for Agt protein, renal AII, nephrin index, tubule dilatation, tubule apoptosis, tubular Ki67, and interstitial Ki67 were analyzed by generalized estimating equation method. Agt mRNA was analyzed by general linear model using dose of LMB2 as a continuous covariate to examine linear dose-response association and the model included cross-product terms between LMB2 and genotypes to statistically assess whether the effect of LMB2 differed by genotypes. As the interaction between LMB2 and genotypes was not significant, the cross-product terms were excluded from the general linear model, resulting in a common slope for all genotypes, that is, a single β-coefficient to quantify the effect of LMB2 for all genotypes. Renin/18S RNA was analyzed by generalized estimating equation after square root transformation. Ace/18S RNA was analyzed by general linear model after square root transformation.
For systolic blood pressure and plasma cystatin C concentration, values before and after LMB2 were compared by Wilcoxon signed-rank test in each group. Difference between genotype was analyzed using Mann–Whitney U-test. The P-values were corrected by Holm’s method in order to minimize inflation of type I error due to multiple comparisons. These are expressed by mean ± 95% confidence interval.
Plasma Agt in NEP25 mice was expressed by mean ± 95% confidence interval and the values before and after podocyte injury were compared by paired t-test.
Association between urinary (U)-albumin and U-Agt in control or liver Agt KO mice injected with LMB2 (Figure 5b) was evaluated by calculating Spearman’s rank correlation coefficient after logarithmic transformation. To highlight the low U-Agt in liver and dual Agt KO mice observed in the study, data for U-Agt and U-albumin were plotted linearly in Figure 5b.
Association between renal AII and U-Na/albumin after LMB2 (Figure 8d) was evaluated by calculating Spearman’s rank correlation coefficient.
Incidence of ascites and edema was compared between control and kidney Agt KO mice versus liver and dual Agt KO mice using the χ2 test.
Values were regarded as significant at two-sided P < 0.05.
Supplementary Material
ACKNOWLEDGMENTS
We acknowledge Ms Shiho Imai and Ms Chie Sakurai for excellent technical assistance and Ms Tanaka for administrative assistance. This study was supported by Grant-in Aid for Scientific Research of Japan Society for the Promotion of Science, MEXT, MEXT-Supported Program for the Strategic Research Foundation at Private Universities (2009-2013), Project Research (2010–2011) in Tokai University, Grant-in-Aid from the American Heart Association (12GRANT11630000), and in part by the Intramural Research Program of the NIH, National Cancer Institute, Center for Cancer Research.
Footnotes
DISCLOSURE
TM received a research fund from Chugai Pharmaceutical. All the other authors declared no competing interests.
SUPPLEMENTARY MATERIAL
Table S1. Systolic Blood Pressure (mm Hg).
Table S2. Plasma Cystatin C Concentration (ng/ml).
Table S3. Representative Values (mean, 95% CI) for the Data Shown in Figures 1 and 4A, and the Body Weight.
Table S4. Agt Concentration in the Perfusate vs. Arterial Blood.
Table S5. Relative Agt mRNA Amount.
Figure S1. Representative Renal Histology.
Figure S2. Representative pictures for nephrin staining.
Figure S3. Effects of Agt Genotypes on Agt mRNA, Protein and Ang II.
Figure S4. Focal Leakage of Agt Protein in Mouse Models of Focal Segmental Glomerulosclerosis (FSGS).
Supplementary material is linked to the online version of the paper at http://www.nature.com/ki
REFERENCES
- 1.Navar LG, Nishiyama A. Why are angiotensin concentrations so high in the kidney? Curr Opin Nephrol Hypertens 2004;13: 107–115. [DOI] [PubMed] [Google Scholar]
- 2.Kobori H, Nangaku M, Navar LG et al. The intrarenal renin-angiotensin system: from physiology to the pathobiology of hypertension and kidney disease. Pharmacol Rev 2007;59: 251–287. [DOI] [PubMed] [Google Scholar]
- 3.Pendergrass KD, Averill DB, Ferrario CM et al. Differential expression of nuclear AT1 receptors and angiotensin II within the kidney of the male congenic mRen2. Lewis rat. Am J Physiol Renal Physiol 2006;290: F1497–F1506. [DOI] [PubMed] [Google Scholar]
- 4.Siragy HM, Carey RM. Role of the intrarenal renin-angiotensin-aldosterone system in chronic kidney disease. Am J Nephrol 2010;31: 541–550. [DOI] [PMC free article] [PubMed] [Google Scholar]
- 5.Bader M, Ganten D. Update on tissue renin-angiotensin systems. J Mol Med (Berl) 2008;86: 615–621. [DOI] [PubMed] [Google Scholar]
- 6.Li J, Zhou C, Yu L et al. Renal protective effects of blocking the intrarenal renin-angiotensin system. Hypertens Res 1999;22: 223–228. [DOI] [PubMed] [Google Scholar]
- 7.Largo R, Gomez-Garre D, Soto K et al. Angiotensin-converting enzyme is upregulated in the proximal tubules of rats with intense proteinuria. Hypertension 1999;33: 732–739. [DOI] [PubMed] [Google Scholar]
- 8.Takase O, Marumo T, Imai N et al. NF-kappaB-dependent increase in intrarenal angiotensin II induced by proteinuria. Kidney Int 2005; 68: 464–473. [DOI] [PubMed] [Google Scholar]
- 9.Ruiz-Ortega M, Gonzalez S, Seron D et al. Ace inhibition reduces proteinuria, glomerular lesions and extracellular matrix production in a normotensive rat model of immune complex nephritis. Kidney Int 1995; 48: 1778–1791. [DOI] [PubMed] [Google Scholar]
- 10.Ibrahim HN, Hostetter TH. The renin-aldosterone axis in two models of reduced renal mass in the rat. J Am Soc Nephrol 1998;9: 72–76. [DOI] [PubMed] [Google Scholar]
- 11.Anderson S, Jung FF, Ingelfinger JR. Renal renin-angiotensin system in diabetes: functional, immunohistochemical, and molecular biological correlations. Am J Physiol 1993;265: F477–F486. [DOI] [PubMed] [Google Scholar]
- 12.Hsieh TJ, Zhang SL, Filep JG et al. High glucose stimulates angiotensinogen gene expression via reactive oxygen species generation in rat kidney proximal tubular cells. Endocrinology 2002; 143: 2975–2985. [DOI] [PubMed] [Google Scholar]
- 13.Singh R, Singh AK, Leehey DJ. A novel mechanism for angiotensin II formation in streptozotocin-diabetic rat glomeruli. Am J Physiol Renal Physiol 2005; 288: F1183–F1190. [DOI] [PubMed] [Google Scholar]
- 14.Taniguchi M, Kim S, Zhan Y et al. Role of intrarenal angiotensin-converting enzyme in nephropathy of type II diabetic rats. Hypertens Res 2002; 25: 287–294. [DOI] [PubMed] [Google Scholar]
- 15.Ichihara A, Hayashi M, Kaneshiro Y et al. Inhibition of diabetic nephropathy by a decoy peptide corresponding to the “handle” region for nonproteolytic activation of prorenin. J Clin Invest 2004; 114: 1128–1135. [DOI] [PMC free article] [PubMed] [Google Scholar]
- 16.Zhuo JL, Li XC. Novel roles of intracrine angiotensin II and signalling mechanisms in kidney cells. J Renin Angiotensin Aldosterone Syst 2007; 8: 23–33. [DOI] [PMC free article] [PubMed] [Google Scholar]
- 17.Urata H Pathological involvement of chymase-dependent angiotensin II formation in the development of cardiovascular disease. J Renin Angiotensin Aldosterone Syst 2000; 1 : S35–S37. [DOI] [PubMed] [Google Scholar]
- 18.Graciano ML, Cavaglieri Rde C, Delle H et al. Intrarenal renin-angiotensin system is upregulated in experimental model of progressive renal disease induced by chronic inhibition of nitric oxide synthesis. J Am Soc Nephrol 2004; 15: 1805–1815. [DOI] [PubMed] [Google Scholar]
- 19.Crackower MA, Sarao R, Oudit GY et al. Angiotensin-converting enzyme 2 is an essential regulator of heart function. Nature 2002; 417: 822–828. [DOI] [PubMed] [Google Scholar]
- 20.Niimura F, Okubo S, Fogo A et al. Temporal and spatial expression pattern of the angiotensinogen gene in mice and rats. Am J Physiol 1997; 272: R142–R147. [DOI] [PubMed] [Google Scholar]
- 21.Pohl M, Kaminski H, Castrop H et al. Intrarenal renin angiotensin system revisited: role of megalin-dependent endocytosis along the proximal nephron. J Biol Chem 2010; 285: 41935–41946. [DOI] [PMC free article] [PubMed] [Google Scholar]
- 22.Terada Y, Tomita K, Nonoguchi H et al. PCR localization of angiotensin II receptor and angiotensinogen mrnas in rat kidney. Kidney Int 1993; 43: 1251–1259. [DOI] [PubMed] [Google Scholar]
- 23.Matsusaka T, Niimura F, Shimizu A et al. Liver angiotensinogen is the primary source of renal angiotensin II. J Am Soc Nephrol 2012; 23: 1181–1189. [DOI] [PMC free article] [PubMed] [Google Scholar]
- 24.Matsusaka T, Xin J, Niwa S et al. Genetic engineering of glomerular sclerosis in the mouse via control of onset and severity of podocyte-specific injury. J Am Soc Nephrol 2005; 16: 1013–1023. [DOI] [PubMed] [Google Scholar]
- 25.Kobori H, Ozawa Y, Suzaki Y et al. Enhanced intrarenal angiotensinogen contributes to early renal injury in spontaneously hypertensive rats. J Am Soc Nephrol 2005; 16: 2073–2080. [DOI] [PMC free article] [PubMed] [Google Scholar]
- 26.Gociman B, Rohrwasser A, Lantelme P et al. Expression of angiotensinogen in proximal tubule as a function of glomerular filtration rate. Kidney Int 2004; 65: 2153–2160. [DOI] [PubMed] [Google Scholar]
- 27.Kobori H, Harrison-Bernard LM, Navar LG. Expression of angiotensinogen mRNA and protein in angiotensin II-dependent hypertension. J Am Soc Nephrol 2001; 12: 431–439. [DOI] [PMC free article] [PubMed] [Google Scholar]
- 28.Schunkert H, Ingelfinger JR, Jacob H et al. Reciprocal feedback regulation of kidney angiotensinogen and renin mRNA expressions by angiotensin II. Am J Physiol 1992; 263: E863–E869. [DOI] [PubMed] [Google Scholar]
- 29.Navar LG, Satou R, Gonzalez-Villalobos RA. The increasing complexity of the intratubular renin-angiotensin system. J Am Soc Nephrol 2012; 23: 1130–1132. [DOI] [PubMed] [Google Scholar]
- 30.Gonzalez-Villalobos RA, Seth DM, Satou R et al. Intrarenal angiotensin II and angiotensinogen augmentation in chronic angiotensin II-infused mice. Am J Physiol Renal Physiol 2008; 295: F772–F779. [DOI] [PMC free article] [PubMed] [Google Scholar]
- 31.Schunkert H, Ingelfinger JR, Hirsch AT et al. Evidence for tissue-specific activation of renal angiotensinogen mRNA expression in chronic stable experimental heart failure. J Clin Invest 1992; 90: 1523–1529. [DOI] [PMC free article] [PubMed] [Google Scholar]
- 32.van den Heuvel M, Batenburg WW, Jainandunsing S et al. Urinary renin, but not angiotensinogen or aldosterone, reflects the renal renin-angiotensin-aldosterone system activity and the efficacy of renin-angiotensin-aldosterone system blockade in the kidney. J Hypertens 2011; 29: 2147–2155. [DOI] [PubMed] [Google Scholar]
- 33.Nishiyama A, Konishi Y, Ohashi N et al. Urinary angiotensinogen reflects the activity of intrarenal renin-angiotensin system in patients with IgA nephropathy. Nephrol Dial Transplant 2011; 26: 170–177. [DOI] [PMC free article] [PubMed] [Google Scholar]
- 34.Nakano D, Kobori H, Burford JL et al. Multiphoton imaging of the glomerular permeability of angiotensinogen. J Am Soc Nephrol 2012; 23: 1847–1856. [DOI] [PMC free article] [PubMed] [Google Scholar]
- 35.Schulz A, Weiss J, Schlesener M et al. Development of overt proteinuria in the Munich Wistar Fromter rat is suppressed by replacement of chromosome 6 in a consomic rat strain. J Am Soc Nephrol 2007; 18: 113–121. [DOI] [PubMed] [Google Scholar]
- 36.Ichikawa I, Rennke HG, Hoyer JR et al. Role for intrarenal mechanisms in the impaired salt excretion of experimental nephrotic syndrome. J Clin Invest 1983; 71: 91–103. [DOI] [PMC free article] [PubMed] [Google Scholar]
- 37.Matsusaka T, Kobayashi K, Kon V et al. Glomerular sclerosis is prevented during urinary tract obstruction due to podocyte protection. Am J Physiol Renal Physiol 2011; 300: F792–F800. [DOI] [PMC free article] [PubMed] [Google Scholar]
Associated Data
This section collects any data citations, data availability statements, or supplementary materials included in this article.


