Abstract
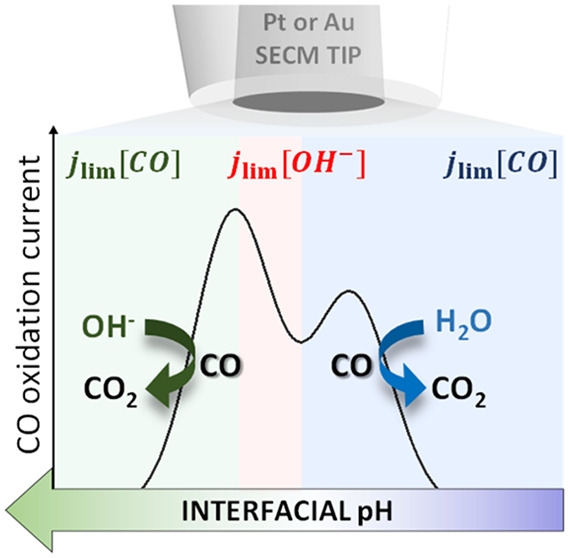
Recently, the bulk electrooxidation of CO on gold or platinum has been used to detect CO produced during CO2 reduction in neutral media. The CO bulk oxidation voltammetry may show two distinct peaks depending on the reaction conditions, which up to now have not been understood. We have used scanning electrochemical microscopy (SECM) to probe CO oxidation and pH in the diffusion layer during CO2 reduction. Our results show that the two different peaks are due to diffusion limitation by two different species, namely, CO and OH–. We find that between pH 7 and 11, CO oxidation by water and OH– gives rise to the first and second peak observed in the voltammetry, respectively. Additional rotating disc experiments showed that specifically in this pH range the current of the second peak is diffusion limited by the OH– concentration, since it is lower than the CO concentration.
The electrochemical oxidation of CO on gold1−4 and platinum5−9 has been widely studied, especially in terms of how pH and surface structure affect the reaction.10−12 Recently, CO oxidation on these two surfaces has been used in rotating ring disc electrodes (RRDE),13−15 scanning electrochemical microscopy (SECM),16,17 and cyclic voltammetry18 experiments for in situ probing the products of CO2 reduction (CO2R) or the interfacial pH. In these studies, mostly carried out in neutral media, two distinct or convoluted peaks have been observed in the CO oxidation voltammetry,13,14,16−18 but their assignment is unclear. While the oxidation of a CO adlayer has been extensively studied on mono and polycrystalline platinum at different pH, there are no reports elucidating the mechanism of CO bulk oxidation on platinum in neutral media. These conditions are of special interest as the typical CO2R reaction environment.
In general, the electrochemical oxidation of CO is believed to take place through a Langmuir–Hinshelwood (LH) mechanism, similar to the gas phase reaction. It is proposed that an adsorbed CO is oxidized by a nearest-neighbor oxygen-containing species. The oxygen donor is generally believed to be OHad from water in acidic (eq 1) or from OH– in alkaline (eq 2) media, respectively.19
| 1 |
| 2 |
| 3 |
Especially on gold electrodes, previous work has shown that CO oxidation takes place at higher overpotentials in acidic than in alkaline media.3 As studies on bulk CO oxidation have previously been carried out only in strongly acidic or alkaline conditions, there is currently no consistent explanation for the coexistence of two peaks in the bulk CO electrooxidation voltammetry in neutral media.
Using platinum cyclic voltammetry to determine CO2R products is a relatively new approach. Narayanaru et al.16 used a platinum ultramicroelectrode (Pt-UME) in the substrate generation-tip collection (SG-TC) mode of SECM to probe the products of CO2R on gold in 0.1 M KHCO3 electrolyte. Two distinct CO oxidation peaks were observed in the Pt-UME voltammetry when the gold sample was held at −1.3 V vs Ag/AgCl. Although a shift in the CO oxidation peak potential was observed as a function of sample roughness, and attributed to interfacial pH changes, the nature of the two different CO oxidation peaks was not discussed. In the same work, CO oxidation on gold directly after CO2R was also performed, and two distinct anodic peaks were observed in the CO oxidation region. The authors attributed the peak at more positive potential to the oxidation of CO and the peak at less positive potential to the oxidation of methanol. Recently, Zhang and Co13 reported the use of a RRDE with CO2R performed on a gold disc while oxidation of the reaction products is carried out on a platinum ring. A broad CO oxidation peak is observed on the platinum ring, which seems actually a convolution of two different peaks. The broadness of the peak was explained by the presence of bubbles and was not further discussed. In the same work, CO oxidation was carried out on the polycrystalline Pt ring in CO saturated 0.1 M KHCO3 at pH 6.8 and 9.2. At pH 9.2 two distinct peaks were observed and attributed to CO oxidation taking place at {100} facets and {111} facets of the Pt-UME.
In order to better understand bulk CO oxidation in the CO2R reaction environment, we have used a Pt-UME in the SG-TC mode of SECM while CO2R was carried out at a gold substrate. Using a functionalized gold pH sensor, we have used SECM to measure the pH in the diffusion layer under the same reaction conditions and approximately the same tip-to-surface distance.20 The correlation of these results and additional rotating disc electrode (RDE) measurements provide a clear understanding on the nature of the two different CO oxidation peaks previously observed13,14,16−18 and how they are influenced by the interfacial pH. Our measurements show the nature of the oxygen donor as a function of pH and how in a narrow pH window the diffusion of these species and not (only) the diffusion of CO itself is what limits the current of the oxidation reaction and gives rise to the specific voltammetry. We emphasize that CO diffusion in this paper refers to CO bulk diffusion, not to CO surface diffusion as it has been studied in CO stripping experiments.10,11
SECM CO Oxidation Measurements
. To probe CO oxidation while CO2R and the competing hydrogen evolution (HER) are taking place at the gold sample, a Pt-UME (6.5 ± 0.07 μm radius) is used. A schematic representation of the experiment is shown in Figure 1a. The blank and CO stripping cyclic voltammetry (CV) of the Pt-UME can be seen in Figure 1c. After characterization of the Pt-UME, a capacitive approach20,21 is performed in air in order to determine the tip-to-surface distance. Figure 1d shows a measured approach curve (data points) together with its fit (line). Details on the capacitive approach curve measurement and fitting are available in the Supporting Information. To minimize the influence of the tip in the diffusion process, it was placed at a relatively large distance of 40 ± 3 μm from the surface.
Figure 1.
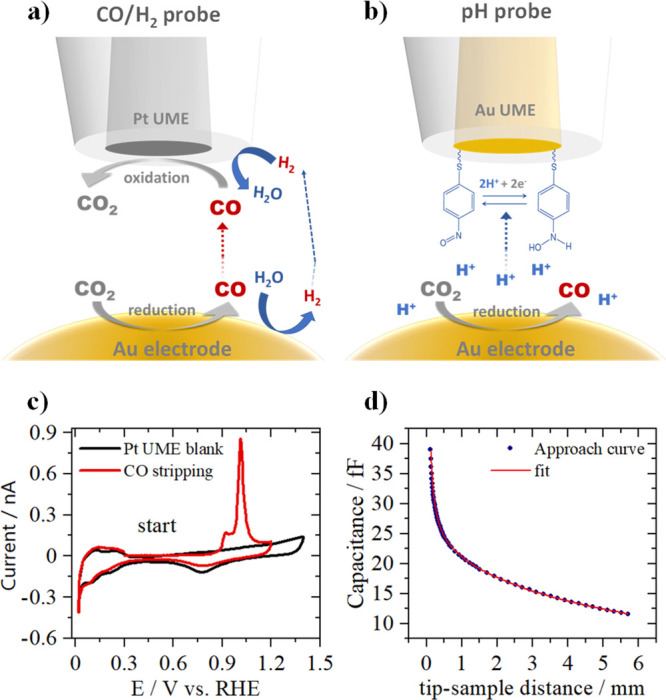
Schematic representation of (a) the SG-TC collection mode of SECM, where a Pt-UME is used to probe CO and H2 while CO2 reduction takes place at the gold sample, (b) the functionalized Au-UME used to measure pH, and (c) Pt-UME blank voltammetry (black) taken in argon-saturated 0.1 M H2SO4 and CO stripping voltammetry measured in the same electrolyte after exposing the Pt-UME to a CO atmosphere for 5 min. CVs taken at 200 mV s–1. (d) Capacitive approach curve to determine the absolute tip-to-surface distance.
During CO2R, the composition of the reaction interface changes significantly due to OH– generation. Consequently, the local pH depends on the sample potential. In order to investigate the nature of the two distinct peaks in the bulk CO oxidation voltammetry, we have created different CO2R reaction environments around the Pt-UME by using an unbuffered electrolyte (0.1 M Cs2SO4, pH = 3) and changing the potential at which the reaction is carried out at the gold substrate.
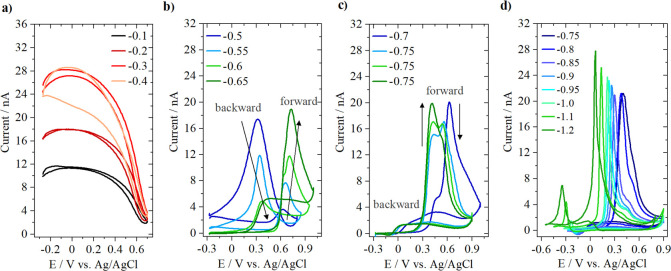
The Pt-UME voltammetry is constantly recorded while chronoamperometry at the sample is carried out at different potentials. The chronoamperometry data from the gold sample can be found in Figure S4. Figure 2 shows the results obtained at different sample potentials. Ten cycles of the Pt-UME were recorded, and the 10th cycle is displayed. It can be seen that at low sample potentials (Figure 2a) only hydrogen is produced at the gold sample as the tip voltammetry shows features characteristic of hydrogen oxidation (HOR).22 The HOR current increases when going from −0.1 to −0.3 V but stops increasing between −0.3 and −0.4 V likely due to diffusion limitation of the proton reduction reaction taking place at the surface. At these potentials, no strong pH gradients are expected and bicarbonate is present only in trace amounts, as the pKa of the CO2(aq) + H2O ↔ HCO3– + H+ equilibrium reaction is 6.4. At −0.5 V (sample potential) CO starts being formed. This leads to the poisoning of the Pt-UME for HOR, and a small CO oxidation peak appears in the forward scan (see Figure 2b). This peak gradually increases and shifts slightly positive going from −0.5 to −0.65 V, due to a higher concentration of CO in solution. For simplicity, from now on we will call this “peak I”. In the backward scan, a peak due to HOR is still observed at sample potentials −0.5 and −0.55 V, which decreases due to the increase in CO concentration. At −0.6 and −0.65 V only current due to bulk CO oxidation is seen at the Pt-UME voltammetry and a subtle shoulder appears, which we will call “peak II”. The shape of the CO oxidation CV with the hysteresis between forward and backward scans is typical for bulk CO oxidation on Pt and is discussed in detail elsewhere.23
Figure 2.
Pt-UME voltammetry recorded in 0.1 M Cs2SO4 (200 mV s–1, pH = 3) while CO2R and/or HER take place at the gold sample at potentials (a) from −0.1 to −0.4 V, (b) from −0.5 to −0.65 V, (c) from −0.7 to −0.75 V, and (d) from −0.75 to −1.2 V. The gold sample potentials shown in the legend are reported versus the reversible hydrogen electrode.
Figure 2c shows results obtained at sample potentials of −0.7 and −0.75 V. At −0.7 V the CO oxidation peak shows a clear shoulder in the Pt-UME voltammetry at 0.45 V vs Ag/AgCl due to an increase of peak II. At −0.75 V peak II gradually increases while peak I decreases. Here, three subsequent Pt-UME CVs are plotted to show this peak I/peak II transition. This transition suggests a strong change in the reaction environment when −0.75 V is applied to the gold sample. If the rate of OH– production becomes higher than the rate at which bicarbonate can be formed, the alkalinity near the surface will increase and the concentration of OH– will become larger than the concentration of HCO3–. The coexistence of peak I and peak II strongly suggests that two different mechanisms for CO oxidation are taking place simultaneously as a function of the reaction environment, i.e., OH– concentration. At more negative sample potentials, it can be seen in the Pt-UME voltammetry (Figure 2d) that peak I is still present but gradually becomes less pronounced. Peak II shifts to more negative potentials, likely due to an increase in local alkalinity. At −1 V sample potential, a small peak appears in the backward scan at −0.23 V vs Ag/AgCl due to hydrogen oxidation.
To better understand the mechanism behind bulk CO oxidation and the diffusion processes taking place, the currents of peak I and peak II are evaluated separately by holding the gold sample at potentials where either peak I or peak II are present (−0.65 and −0.9 V vs RHE). By varying the scan rate at which the Pt-UME voltammetry is recorded, we can gain insights into the nature of the species participating in the reaction and limiting the current, as the peak current can be calculated following the Randles–Sevcik equation:24
| 4 |
where n is the number of
electrons transferred, A is the electrode surface
area, D is the diffusion coefficient of the reacting
species that limits the current, C is its concentration,
and  is the scan rate. The peak current plotted
as a function of the square root of the scan rate can be seen in Figure 3. The two different
slopes found indicate that the reaction is limited by the diffusion
of two different species, giving rise to the two observed peaks in
the voltammetry. However, derivation of the diffusion coefficient
for identification of the species is not possible here, as the exact
concentration of the reactants is unknown.
Figure 3.
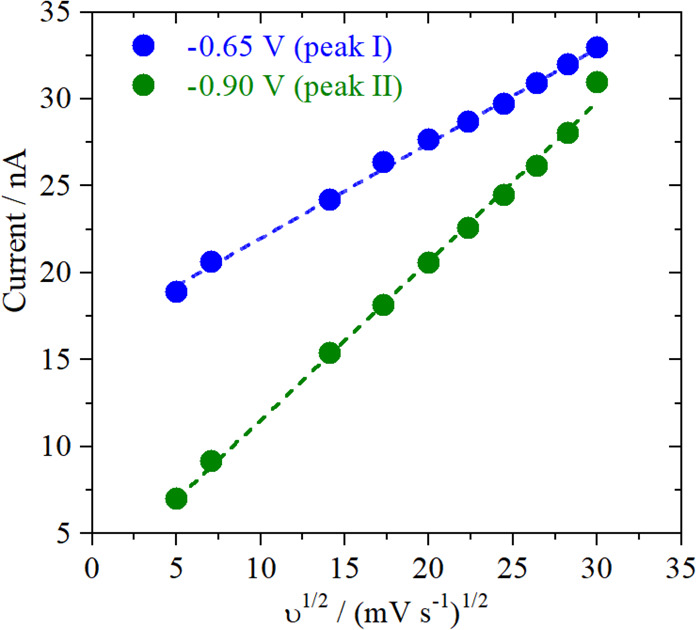
Scan rate dependency of the CO oxidation peak current measured at the Pt-UME. Measurements were performed at two different sample potentials in order to evaluate separately the CO oxidation peak I (blue) and peak II (green).
SECM pH Measurements
. To gain better insights into the reaction interface when these two peaks coexist, SECM pH measurements were performed under the same conditions as the previously shown H2/CO oxidation experiments. Here, the tip is a functionalized gold ultramicroelectrode (Au-UME) pH sensor. As can be seen in the scheme in Figure 1b the gold surface is modified with a self-assembled monolayer containing the hydroxylaminothiophenol/4-nitrosothiophenol redox couple. The pH sensing is realized by recording the tip cyclic voltammetry and monitoring the Nernstian shift of the midpeak potential. Details on the sensor fabrication and data processing can be found in our previous work.20 The Au-UME is positioned at the same distance from the surface as the Pt-UME (40 ± 3 μm) and the tip voltammetry is recorded while changing the sample potential. The pH measurements in time can be found in Figure S5.
The measured pH as a function of sample potential is displayed in Figure 4 together with the peak potential of the CO oxidation peaks from Figure 2. At low sample potentials neither the pH increases nor the CO oxidation peak I shifts negatively. In this potential range the CO2(aq) ↔ HCO3– equilibrium buffers the interfacial pH, the value of which remains near the pKa of the equilibrium reaction (6.4). At −0.75 V sample potential, where the transition between peak I and peak II is observed (Figure 2c), there is an increase in pH from 7.7 to 9 and the CO oxidation peak also starts to shift negatively. The correlation shown in Figure 4 suggests that peak I exists at neutral pH and, therefore, that water is the oxygen donor for CO oxidation. As peak II appears when the buffer breaks down and the interface becomes more alkaline, it seems that peak II corresponds to CO being oxidized by OH–. However, these findings still do not elucidate why different slopes were found in Figure 3, which suggest that the current of peak I and II is limited by two different species, which could be OH–, CO, or HCO3–.
Figure 4.
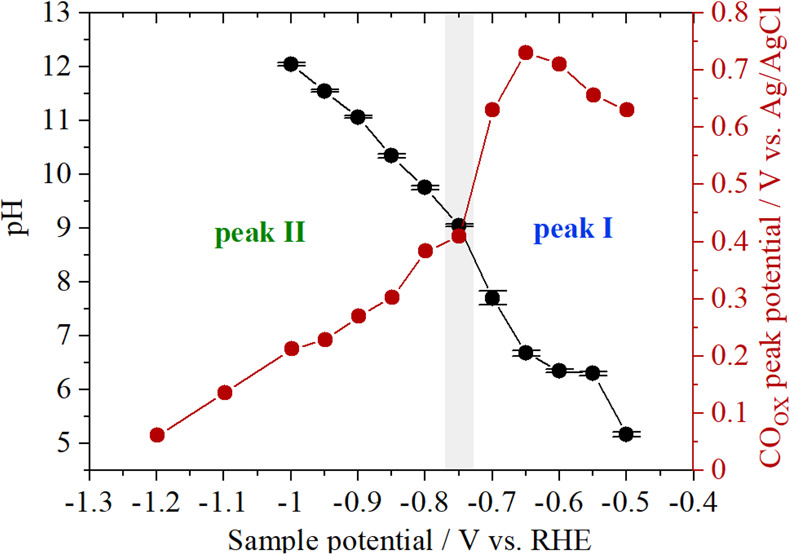
Correlation between the pH measurements performed with a functionalized Au-UME (black circles) with the CO oxidation peak position extracted from the measurements performed with the Pt-UME (red circles) during CO2 reduction on gold (0.1 M Cs2SO4, pH = 3, CO2 saturated).
RDE Measurements
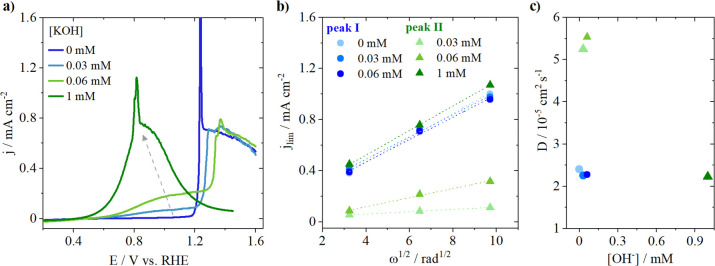
. In order to assign the species leading to the diffusion limiting current observed for peaks I and II, we performed rotating disk electrode (RDE) experiments using a polycrystalline platinum disk. The blank voltammetry of the platinum electrode is seen in Figure S6. Figure 5 displays the results obtained in pure 0.1 M Cs2SO4 (pH = 7.2) and when 0.03, 0.06, and 1 mM KOH were added to the electrolyte, leading to pH 9.5, 9.8, and 11, respectively. The electrolyte is saturated with CO during all the measurements, leading to a constant CO concentration of 1 mM. Figure 5a shows the voltammetry of bulk CO oxidation in the different electrolytes taken at 400 rpm. In pure Cs2SO4 (neutral pH) only one diffusion limiting plateau is seen between 1.2 and 1.6 V vs RHE, corresponding to peak I previously observed in the SECM measurements. When 0.03 mM KOH is added to the electrolyte, two plateaus are observed, one with a similar current as before, between 1.2 and 1.6 V vs RHE, and another with a lower diffusion limiting current, between 0.8 and 1.2 V vs RHE (peak II). Increasing the OH– concentration leads to an increase in the diffusion limiting current of peak II, confirming the correlation found in the SECM measurements between peak II and pH. At pH 11 (1 mM KOH), only one peak is observed at lower overpotentials, with a current matching the one found at pH 7.2. To elucidate which species causes the diffusion limitation in each condition, measurements were also performed at different rotation rates (see Figure S7). The Levich equation describes the relationship between the diffusion limiting current and the rotation rate and can be used to derive the diffusion coefficient of the species leading to the diffusion limitation:24
| 5 |
where n is the number of
electrons transferred, F is the Faraday constant, D is the diffusion coefficient of the species,  is the kinematic viscosity of the solvent, C is the concentration of the species, and ω is the
rotation rate. The diffusion limiting currents obtained at the different
rotations for the plateaus corresponding to peak I and II are shown
in Figure 5b as a function
of the square root of the rotation rate. The diffusion coefficients
are derived from the slopes obtained in Figure 5b and are displayed in Figure 5c. It can be seen that for peak I the same
slope is found in pure Cs2SO4 and in the presence
of 0.03 and 0.06 mM OH–. The calculated diffusion coefficients all approximate the theoretical
value reported for CO (2.03 × 10⁻⁵ cm2 s−1), confirming that the current of peak I is
limited by the diffusion of CO.25 In the
case of peak II, interestingly a different slope is found as a function
of the OH– concentration. When the OH– concentration is lower than the CO concentration (1 mM), a slope
of approximately 5.5 × 10⁻⁵ cm2 s–1 is found based on the OH– concentration,
corresponding to the value reported for OH– ions
(5.23 × 10⁻⁵ cm2 s–1).25 This clearly shows that, in this
pH range, OH– is not only the oxygen donor but also
the species whose transport limits the reaction. When the [OH–] = [CO] = 1 mM, the slope found is similar to the
one of peak I and derivation of the diffusion coefficient based on
the CO concentration again matches the value reported in literature
for CO. The latter implies that at pH 11 or higher only one peak is
present and that the current is limited by the diffusion of CO.
Figure 5.
RDE CO oxidation measurements on a polycrystalline Pt disc in Cs2SO4 (pH = 7.2) performed at 400 rpm with a 25 mV s–1 scan rate. (a) Reaction performed in the presence of different concentrations of KOH, (b) Levich plot, and (c) derivation of the diffusion coefficients for peak I (blue circles) and peak II (green triangles).
Based on the two different SECM measurements and the RDE results, we can now build a clear understanding of the nature of the two peaks observed during bulk CO electrooxidation in neutral media. As summarized in Table 1, at acidic and neutral pH, OH– is present in small concentrations and CO is oxidized by water. The current is limited by the concentration of CO in solution and only one peak is observed in the voltammetry at high overpotential, namely, peak I. Between pH 7 and 11, two peaks coexist in the CO oxidation voltammetry, namely, peak I and peak II. Peak II appears at lower overpotentials than peak I and is due to CO oxidation by OH–. The current is limited by the OH– concentration. Above pH 11, only peak II is present due to CO oxidation by OH–, and the current is limited again by the concentration of CO, which becomes smaller than the OH– concentration in this pH range. Even though methanol has been previously observed as a product of CO2 reduction on roughened gold electrodes,16 we can exclude that methanol oxidation gives rise to peak II. We have analyzed the CO2R products formed in the conditions of this study (flat gold electrode, 0.1 M Cs2SO4, pH = 3) with online chromatography (Figure S8). The only products detected are hydrogen and CO, at potentials for which peak I and II are observed.
Table 1. Relationship between pH, jlim Species, and the Bulk CO Electrooxidation Voltammetry.
| pH | O-donor | jlim species | voltammetry |
|---|---|---|---|
| ≤ 7 | H2O | CO | peak I |
| 11 > pH > 7 | H2O, OH– | OH– | peak I + peak II |
| ≥ 11 | OH– | CO | peak II |
Summarizing, in the present work we have used SECM in SG-TC mode in order to probe CO oxidation on a Pt-UME while CO2R to CO takes place on a gold sample. By changing the local reaction environment, we could observe the existence of two distinct peaks in the CO oxidation voltammetry as a function of pH. SECM local pH measurements were also performed demonstrating a clear correlation between the OH– concentration and the coexistence of the two distinct CO oxidation peaks. Additional RDE measurements confirmed that the peaks coexist in a narrow pH range in which the OH– concentration is smaller than the CO concentration (between pH 7 and 11), which results in two diffusion-limited current regimes. It is now clear why these two peaks are mainly observed when probing CO2 reduction,13,14,16−18 as the pH in the CO2 reduction reaction environment usually lies in between the CO2/HCO3– pKa and more alkaline values that develop according to the current density and buffer capacity of the electrolyte used. Considering the increased number of publications where CO oxidation is being used to probe CO2 reduction, we hope our work provides the basis for the correct assignment of the two distinct peaks often observed in the CO oxidation voltammetry.
Experimental Methods
SECM Measurements
. SECM experiments were carried out in our home-built SECM setup, which was previously described in detail.20 All the equipment and cleaning procedures used here are exactly the same as reported in our previous work. The procedures for preparing the platinum ultramicroelectrode and functionalized gold pH sensor are available in the SI. The sample used is a gold disc (0.5 mm thick, MaTeck, 99.995%) cleaned and polished with diamond suspension using a protocol described elsewhere.26 For all measurements, the tip-to-surface distance was determined by performing a capacitive approach in air.20 Details are found in the Supporting Information (see eq S2). Measurements were performed in 5 mL of 0.1 M Cs2SO4 (Alfa Aesar, Puratronic, 99.997%, metals basis) which was constantly purged with CO2. The electrolyte choice was made based on the high activity for CO2 reduction achieved in Cs+-containing electrolytes. Measurements were performed at a constant distance from the surface, and the tip voltammetry was constantly recorded at a scan rate of 200 mV s–1 while the sample potential was varied.
RDE Measurements
. RDE experiments were performed using a MSR Electrode Rotator (Pine Research Instrumentation) equipped with a AFE6M shaft. The working electrode was a platinum disc (5.0 mm OD × 4.0 mm thick, Pine Research and Instrumentation) and the counter electrode a platinum mesh. Further experimental details are found in the Supporting Information.
Acknowledgments
This work was supported by the European Commission under contract no. 722614 (Innovative Training Network Elcorel).
Supporting Information Available
The Supporting Information is available free of charge at https://pubs.acs.org/doi/10.1021/acs.jpclett.0c02779.
Experimental details of the SECM and RDE experiments, characterization of the ultramicroelectrodes, pH sensor fabrication, capacitive approach, chronoamperometry and pH data, blank voltammetry of the Pt disc electrode, and CO2R product analysis (PDF)
The authors declare no competing financial interest.
Supplementary Material
References
- Kita H.; Nakajima H.; Hayashi K. Electrochemical Oxidation of CO on Au in Alkaline Solution. J. Electroanal. Chem. Interfacial Electrochem. 1985, 190 (1–2), 141–156. 10.1016/0022-0728(85)80083-8. [DOI] [Google Scholar]
- Rodriguez P.; Garcia-Araez N.; Koper M. T. M. Self-Promotion Mechanism for CO Electrooxidation on Gold. Phys. Chem. Chem. Phys. 2010, 12 (32), 9373–9380. 10.1039/b926365a. [DOI] [PubMed] [Google Scholar]
- Rodriguez P.; Koper M. T. M. Electrocatalysis on Gold. Phys. Chem. Chem. Phys. 2014, 16 (27), 13583–13594. 10.1039/C4CP00394B. [DOI] [PubMed] [Google Scholar]
- Rodriguez P.; Plana D.; Fermin D. J.; Koper M. T. M. New Insights into the Catalytic Activity of Gold Nanoparticles for CO Oxidation in Electrochemical Media. J. Catal. 2014, 311, 182–189. 10.1016/j.jcat.2013.11.020. [DOI] [Google Scholar]
- Grgur B. N.; Marković N. M.; Lucas C. A.; Ross P. N. Electrochemical Oxidation of Carbon Monoxide: From Platinum Single Crystals to Low Temperature Fuel Cells Catalysts. Part I: Carbon Monoxide Oxidation onto Low Index Platinum Single Crystals. J. Serb. Chem. Soc. 2001, 66 (11–12), 785–797. 10.2298/JSC0112785G. [DOI] [Google Scholar]
- Kita H.; Shimazu K.; Kunimatsu K. Electrochemical Oxidation of CO on Pt in Acidic and Alkaline Solutions. Part I. Voltammetric Study on the Adsorbed Species and Effects of Aging and Sn(IV) Pretreatment. J. Electroanal. Chem. Interfacial Electrochem. 1988, 241 (1–2), 163–179. 10.1016/0022-0728(88)85124-6. [DOI] [Google Scholar]
- Abe K.; Uchida H.; Inukai J. Electro-Oxidation of CO Saturated in 0.1 M HClO4 on Basal and Stepped Pt Single-Crystal Electrodes at Room Temperature Accompanied by Surface Reconstruction. Surfaces 2019, 2 (2), 315–325. 10.3390/surfaces2020023. [DOI] [Google Scholar]
- Park I. S.; Chen D. J.; Atienza D. O.; Tong Y. J. Enhanced CO Monolayer Electro-Oxidation Reaction on Sulfide-Adsorbed Pt Nanoparticles: A Combined Electrochemical and in Situ ATR-SEIRAS Spectroscopic Study. Catal. Today 2013, 202 (1), 175–182. 10.1016/j.cattod.2012.05.045. [DOI] [Google Scholar]
- Wang H.; Abruña H. D. Origin of Multiple Peaks in the Potentiodynamic Oxidation of CO Adlayers on Pt and Ru-Modified Pt Electrodes. J. Phys. Chem. Lett. 2015, 6 (10), 1899–1906. 10.1021/acs.jpclett.5b00493. [DOI] [PubMed] [Google Scholar]
- Lai S. C. S.; Lebedeva N. P.; Housmans T. H. M.; Koper M. T. M. Mechanisms of Carbon Monoxide and Methanol Oxidation at Single-Crystal Electrodes. Top. Catal. 2007, 46 (3–4), 320–333. 10.1007/s11244-007-9010-y. [DOI] [Google Scholar]
- García G.; Koper M. T. M. Carbon Monoxide Oxidation on Pt Single Crystal Electrodes: Understanding the Catalysis for Low Temperature Fuel Cells. ChemPhysChem 2011, 12 (11), 2064–2072. 10.1002/cphc.201100247. [DOI] [PubMed] [Google Scholar]
- Gisbert R.; García G.; Koper M. T. M. Oxidation of Carbon Monoxide on Poly-Oriented and Single-Crystalline Platinum Electrodes over a Wide Range of PH. Electrochim. Acta 2011, 56 (5), 2443–2449. 10.1016/j.electacta.2010.11.032. [DOI] [Google Scholar]
- Zhang F.; Co A. C. Direct Evidence of Local PH Change and the Role of Alkali Cation during CO2 Electroreduction in Aqueous Media. Angew. Chem. 2020, 132, 1691. 10.1002/ange.201912637. [DOI] [PubMed] [Google Scholar]
- Zhang F.; Co A. C. Rapid Product Analysis for the Electroreduction of CO2 on Heterogeneous and Homogeneous Catalysts Using a Rotating Ring Detector. J. Electrochem. Soc. 2020, 167 (4), 046517. 10.1149/1945-7111/ab7a80. [DOI] [Google Scholar]
- Goyal A.; Marcandalli G.; Mints V. A.; Koper M. T. M. Competition between CO2 Reduction and Hydrogen Evolution on a Gold Electrode under Well-Defined Mass Transport Conditions. J. Am. Chem. Soc. 2020, 142 (1), 4154. 10.1021/jacs.9b10061. [DOI] [PMC free article] [PubMed] [Google Scholar]
- Narayanaru S.; Chinnaiah J.; Phani K. L.; Scholz F. PH Dependent CO Adsorption and Roughness-Induced Selectivity of CO2 Electroreduction on Gold Surfaces. Electrochim. Acta 2018, 264, 269–274. 10.1016/j.electacta.2018.01.106. [DOI] [Google Scholar]
- Sreekanth N.; Phani K. L. Selective Reduction of CO2 to Formate through Bicarbonate Reduction on Metal Electrodes: New Insights Gained from SG/TC Mode of SECM. Chem. Commun. 2014, 50 (76), 11143–11146. 10.1039/C4CC03099K. [DOI] [PubMed] [Google Scholar]
- Lee C. W.; Cho N. H.; Nam K. T.; Hwang Y. J.; Min B. K. Cyclic Two-Step Electrolysis for Stable Electrochemical Conversion of Carbon Dioxide to Formate. Nat. Commun. 2019, 10 (1), 1–8. 10.1038/s41467-019-11903-5. [DOI] [PMC free article] [PubMed] [Google Scholar]
- McPherson I. J.; Ash P. A.; Jones L.; Varambhia A.; Jacobs R. M. J.; Vincent K. A. Electrochemical CO Oxidation at Platinum on Carbon Studied through Analysis of Anomalous in Situ IR Spectra. J. Phys. Chem. C 2017, 121 (32), 17176–17187. 10.1021/acs.jpcc.7b02166. [DOI] [PMC free article] [PubMed] [Google Scholar]
- Monteiro M. C. O.; Jacobse L.; Touzalin T.; Koper M. T. M. Mediator-Free SECM for Probing the Diffusion Layer PH with Functionalized Gold Ultramicroelectrodes. Anal. Chem. 2020, 92 (2), 2237–2243. 10.1021/acs.analchem.9b04952. [DOI] [PMC free article] [PubMed] [Google Scholar]
- de Voogd J.M.; van Spronsen M.A.; Kalff F.E.; Bryant B.; Ostojic O.; den Haan A.M.J.; Groot I.M.N.; Oosterkamp T.H.; Otte A.F.; Rost M.J. Fast and Reliable Pre-Approach for Scanning Probe Microscopes Based on Tip-Sample Capacitance. Ultramicroscopy 2017, 181, 61–69. 10.1016/j.ultramic.2017.05.009. [DOI] [PubMed] [Google Scholar]
- Sheng W.; Zhuang Z.; Gao M.; Zheng J.; Chen J. G.; Yan Y. Correlating Hydrogen Oxidation and Evolution Activity on Platinum at Different PH with Measured Hydrogen Binding Energy. Nat. Commun. 2015, 6, 6–11. 10.1038/ncomms6848. [DOI] [PubMed] [Google Scholar]
- Koper M. T. M.; Schmidt T. J.; Marković N. M.; Ross P. N. Potential Oscillations and S-Shaped Polarization Curve in the Continuous Electro-Oxidation of CO on Platinum Single-Crystal Electrodes. J. Phys. Chem. B 2001, 105 (35), 8381–8386. 10.1021/jp011410s. [DOI] [Google Scholar]
- Bard A. J.; Faulkner L. R.. Electrochemical Methods. Fundamentals and Applications, 2nd ed.; John Wiley & Sons: 2001. [Google Scholar]
- Haynes W. M.Handbook of Chemistry and Physics, 95th ed.; CRC Press: New York, 2014. [Google Scholar]
- Monteiro M. C. O.; Koper M. T. M. Alumina Contamination through Polishing and Its Effect on Hydrogen Evolution on Gold Electrodes. Electrochim. Acta 2019, 325, 134915. 10.1016/j.electacta.2019.134915. [DOI] [Google Scholar]
Associated Data
This section collects any data citations, data availability statements, or supplementary materials included in this article.


