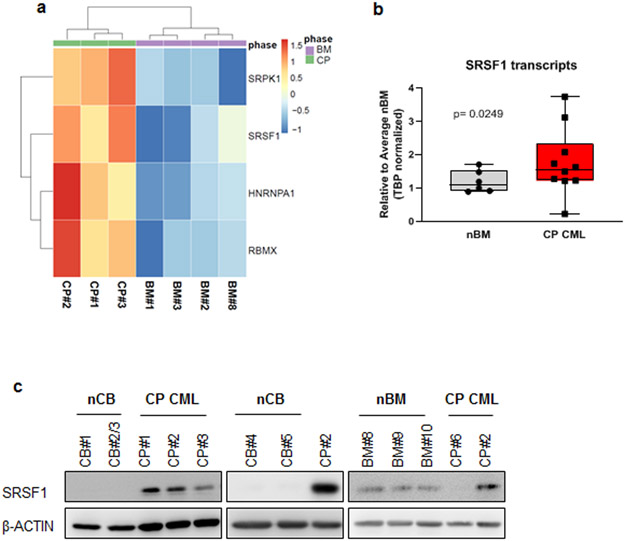
Fig 1.
SRSF1 is upregulated in CD34+ CML progenitors. a. Heatmap indicating the expression of RNA-binding proteins that were differentially expressed in CD34+ cells from four normal bone marrow (nBM) and three CP CML (CP) samples as determined from RNA-sequencing. Bar scale refers to the Z-scores. b. SRSF1 transcript levels in nBM and CP CML samples were measured by qPCR (nBM=6, CP CML=10). Whiskers represent minimum and maximum values, lines within the boxes represent median values, p-values are determined by Student’s t-test. c. Western blot of SRSF1 levels in whole cell lysates obtained from CD34+ normal cord blood (nCB), normal bone marrow (nBM) or CP CML samples. CP#2 has been used across all three blots to show relative protein levels.

