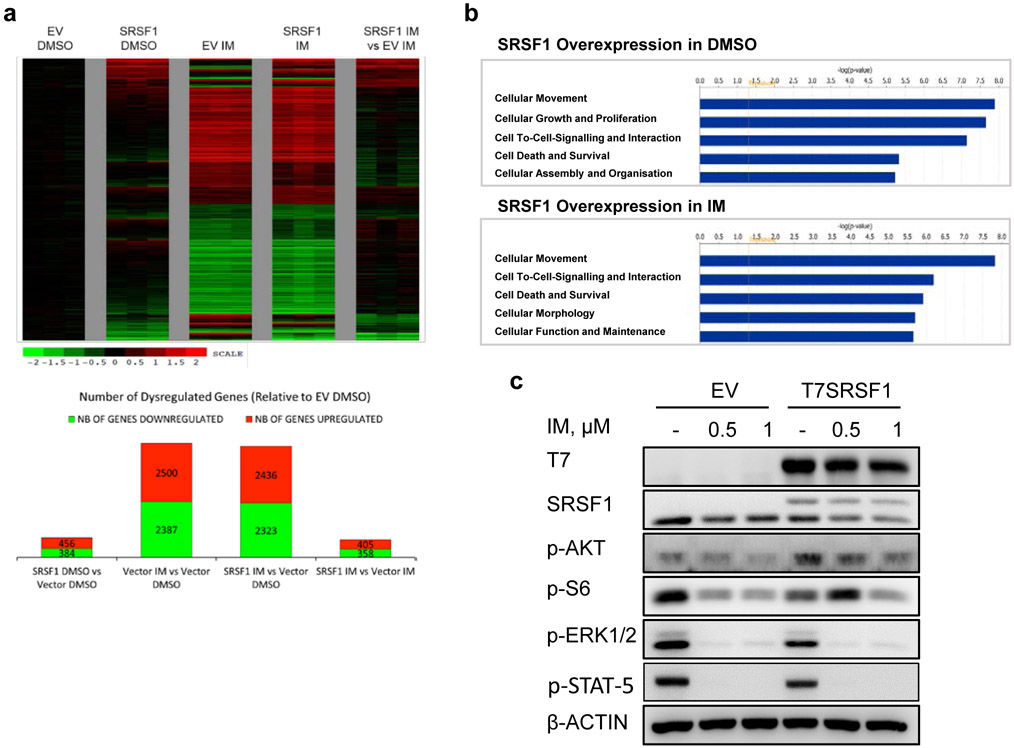
Fig 4.
Upregulated SRSF1 levels antagonize imatinib-related gene expression via a non-splicing function of SRSF1. a. Top panel: Heatmap of gene expression changes from T7SRSF1 overexpressing K562 cells treated with 0.5 μM IM for 48 h. Differential gene expression is initially normalized to the average log counts from the three replicates in the empty vector (EV) DMSO condition, and analyzed relative to the EV control in either DMSO or IM-treated conditions. Thresholds used to determine deregulated genes are ≥1.5 fold change and p-values ≤0.05. Bottom panel: Number of genes differentially expressed relative to EV DMSO condition. b. The top five enriched pathways identified by IPA analysis on differentially expressed genes in cells overexpressing SRSF1 with DMSO (top) or 0.5 μM IM (bottom) treatment. c. Western blot from K562 cells overexpressing SRSF1, treated with 0.5 or 1μM IM for 48 h (n=3).

