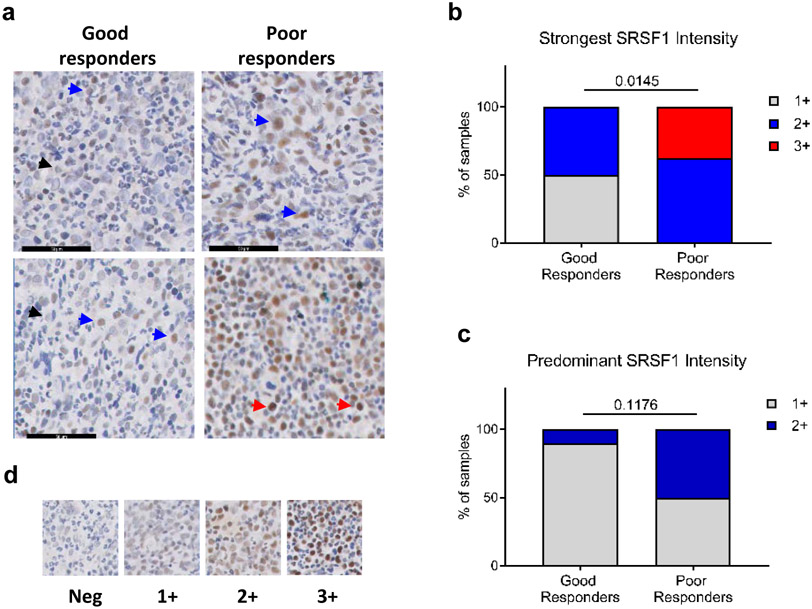
Fig 7.
SRSF1 levels correlate to imatinib response in CP CML patients. a. Representative IHC staining for SRSF1 in bone marrow sections from patients with good (left panels) and poor (right panels) imatinib responses. Arrows indicate 1+ (black), 2+ (blue) and 3+ (red) SRSF1 intensity levels in stained cells. b. Percentage of patients categorized by the strongest SRSF1 intensity levels in any given cell per FFPE section from (a), regardless of predominant intensity. c. Percentage of patients from (a), categorized according to the predominant SRSF1 levels across all SRSF1-positive cells. p-values are determined by a Fisher’s exact test. d. Scoring scale of the staining intensities in (b, c).

