Abstract
In this paper, we propose a multiscale numerical algorithm to simulate the hemolytic release of hemoglobin (Hb) from red blood cells (RBCs) flowing through sieves containing micropores with mean diameters smaller than RBCs. Analyzing the RBC damage in microfiltration is important in the sense that it can quantify the sensitivity of human erythrocytes to mechanical hemolysis while they undergo high shear rate and high deformation. Here, the numerical simulations are carried out via lattice Boltzmann method and spring connected network (SN) coupled by an immersed boundary method. To predict the RBC sublytic damage, a sub-cellular damage model derived from molecular dynamic simulations is incorporated in the cellular solver. In the proposed algorithm, the local RBC strain distribution calculated by the cellular solver is used to obtain the pore radius on the RBC membrane. Index of hemolysis (IH) is calculated by resorting to the resulting pore radius and solving a diffusion equation considering the effects of steric hinderance and increased hydrodynamic drag due to the size of the hemoglobin molecule. It should be mentioned that current computational hemolysis models usually utilize empirical fitting of the released free hemoglobin (Hb) in plasma from damaged RBCs. These empirical correlations contain ad hoc parameters that depend on specific device and operating conditions, thus cannot be used to predict hemolysis under different conditions. In contrast to the available hemolysis model, the proposed algorithm does not have any empirical parameters. Therefore, it can predict the IH in microfilter with different sieve pore sizes and filtration pressures. Also, in contrast to empirical correlations in which the Hb release is related to shear stress and exposure time without considering the physical processes, the proposed model links flow-induced deformation of the RBC membrane to membrane permeabilization and hemoglobin release. In this paper, the cellular solver is validated by simulating optical tweezers experiment, shear flow experiment as well as an experiment to measure RBC deformability in a very narrow microchannel. Moreover, the shape of a single RBC at the rupture moment is compared with corresponding experimental data. Finally, to validate the damage model, the results obtained from our parametric study on the role of filtration pressure and sieve pore size in Hb release are compared with experimental data. Numerical results are in good agreement with experimental data. Similar to the corresponding experiment, the numerical results confirm that hemolysis increases with increasing the filtration pressure and reduction in pore size on the sieve. While in experiment, the RBC pore size cannot be measured, the numerical results can quantify the RBC pore size. The numerical results show that at the sieve pore size of 2.2 μm above 25 cm Hg, RBC pore size is above 75 nm and RBCs experience rupture. More importantly, the results demonstrate that the proposed approach is independent from the operating conditions and it can estimate the hemolysis in a wide range of filtration pressure and sieve pore size with reasonable accuracy.
Keywords: Multiscale modeling, Red blood cell, Hemolysis, High deformation, High shear rate, Microfiltration
1. Introduction
In blood-wetting devices such as red blood cell (RBC) injection nozzles (FDA 2013), centrifugal blood pumps (Wood et al. 2005), bileaflet mechanical heart valve (Wu et al. 2011), ventricular assist devices (VAD) and axial blood pumps (Long et al. 2014), blood cells are under various flow and geometry induced stresses. In these devices, RBCs usually experience high shear, or direct contact with moving components, or excessive deformation in squeezing. Under such circumstances, the RBCs are prone to be damaged. Indeed, prolonged contact and collision between blood cells and device surfaces and regions of high shear stress contribute to cell damage in the mentioned apparatuses (Kormos et al. 1987; Hung et al. 1991). The consequences of RBC damage can be sudden and potentially fatal. The damage-induced nitric oxide depletion can result in pulmonary hypertension, abdominal pain, and some other physiological dysfunctions (Rother et al. 2005). Also, hemolysis and platelet dysfunction resulting from blood-device interaction are linked to renal failure, anemia, arrhythmias, stroke, and death (Aaron and Jacobson 2015; Al Jarallah and Duncan 1997). Therefore, it is important to evaluate the blood damage for safety evaluation of blood-wetted medical devices. To understand the RBC damage mechanism, the RBC deformation ability should be investigated. Over the past 50 years, myriad experimental and numerical studies have been devoted to evaluating the blood damage.
In the laboratory, because the cell damage is difficult to be directly visualized due to its small size (5–10 μm) and the fast flow speed, most of the experimental studies are performed on the measuring of hemoglobin (Hb) release in different devices. In experimental studies, to quantify the RBC damage, the amount of plasma-free Hb (pfHb) is measured by circulating the blood in a loop containing the perfused artificial devices. In this scope, Chien et al. (1971) studied the normal human erythrocytes resistance to mechanical hemolysis by filtration through polycarbonate sieves with micropores. Their findings showed that the hemolysis increases by increasing the filtration pressure and decreasing the sieve pore size. Heuser and Opitz (2017) investigated a special type of Couette viscometer with axial flow to analyze the probability to supervise the flow conditions leading to Hb release once shear stress is implemented over a short duration. Index of hemolysis (IH) in 25 different aortic valve prostheses was measured by Giersiepen et al. (1990) using in vitro investigations. They developed a mathematical model in accordance with their experimental data. Another mathematical model was proposed by Yeleswarapu et al. (1995) based on experimental quantification of hemolysis in their especial apparatus to control the stress on a blood sample. There are also some experimental studies on examining the shape of a single RBC in microfluidic systems to assess the RBC damage. For example, Abkarian et al. (2006, 2008) constructed some confined geometries at microscale to analyze the shape of an individual RBC up to the rupture. They tried to show that how the RBC shape is influenced by flow and geometrical conditions in microfluidic systems. In these studies, some empirical correlations are presented to estimate hemolysis by resorting to curve fitting on experiment data. These correlations are functions of shear stress and exposure time. Due to complicated geometries and operating conditions in different devices, the correlations derived based on these tests are only applicable to that specific device.
Hemolysis models can be classified in two ways (Yu et al. 2017): stress-based (Heuser and Opitz 2017; Giersiepen et al. 1990; Zhang et al. 2012; Grigioni et al. 2005) or strain-based (Arora 2005; Chen and Sharp 2011; Pauli et al. 2013; Farinas et al. 2006; Arora et al. 2004, 2006; Vitale et al. 2014; Sohrabi and Liu 2017). In stress-based models, instantaneous hemolysis is a direct function of local instantaneous shear stress, while in strain-based models, the calculation of instantaneous hemolysis is related to the deformation of the RBC as a consequence of the shear stress. Most of the stress-based models are called “empirical models” because they often use a power-law relationship containing empirical parameters dependent on the device and operating conditions. In most of these correlations, the IH is assumed a function of shear stress and exposure time (IH = Aταtβ). It should be mentioned that because simple stress-based models do not have accurate linkage with RBC membrane mechanics, they cannot calculate the IH in the complex flows that often occur in medical devices (Faghih and Sharp 2019). On the other hand, the strain-based models should not have any ad hoc parameters and can be utilized as a predictive tool for hemolysis evaluation. Introducing a truly physical strain-based model is a complex task. Therefore, only few strain-based models can be found in the literature. More details about different hemolysis models can be found in Yu et al. (2017) and Taskin et al. (2012). The first strain-based model was proposed by Arora (2005), and Arora et al. (2004, 2006). In this model, the RBC is considered as a deformable droplet in the flow. A symmetric, positive-definite second-order morphology tensor is defined to represent the shape and orientation of the droplet. The arrays of this tensor are functions of strain tensor and vorticity tensor of the flow field over the pathlines. This model is not completely physical because the IH is calculated using a power-law correlation containing some empirical coefficients (Arora 2005; Arora et al. 2004, 2006). After Arora, three groups tried to introduce more physical strain-based models. In 2014, a more comprehensive multiscale strain-based model was proposed by Vitale et al. (2014) where they assumed the nucleation of pores is dictated by the membrane energy landscape of the perturbation. Assuming pores relieve the tension and minimize the total free energy, they derived analytical expression for pore radius and density under shear rates ranging from 4000 to 42,000 s−1. The model was used to calculate IH in a pure shear flow as well as the IH over a few pathlines for flow inside a curved pipe grafted to a straight channel. In another study, instead of using a droplet model for the RBC, Ezzeldin et al. (2015) proposed a coarse-grained (CG) model of the RBC to model the lipid membrane and the spectrin cytoskeleton. This model allowed computing a more complicated shape change and not only the symmetric elongation of a droplet in Arora and Vitale’s models. The performance of the model was tested by calculating the IH in pure shear flow as well as flow on some pathlines inside a heart valve. More recently, Sohrabi and Liu (2017) presented a multiscale strained-based model to calculate the hemolysis in simple shear flows. In contrast to other strain-based models, the model proposed in our previous study (Sohrabi and Liu 2017) does not have any empirical/ad hoc parameters dependent on the device and operating conditions. In this model, RBC transient pore was a function of the local strain of the RBC membrane. To calculate the pore radius, molecular dynamic (MD) correlations were used. Hb transferred through the pores was calculated by introducing a diffusion equation. The IH obtained by this model was in the range of Vitale et al.’s model (2014) for pure shear flow.
In this paper, we extend our previous model (Sohrabi and Liu 2017), which has been used to measure hemolysis in pure shear flows, to predict the Hb release in microfiltration in which the flow pattern is more complex and challenging to solve. For example, one of the challenges in modeling cell squeezing is to correctly capture the thin fluid behavior when the cell membrane moves close to the wall while modeling simple shear flow does not have such a difficulty. Also, during squeezing the hemolysis happens because of both high shear rate and high deformation as a result of squeezing. In pure shear flow, the hemolysis is only due to high shear rate. Indeed, the squeezing problem is a more challenging test case for analyzing our model. To the best of our knowledge, this paper is the first numerical simulation to quantify the RBC hemolysis due to both large deformation and high shear rate in microfiltration. To conduct this study, we first describe different elements of the numerical algorithm. Afterwards, we integrate single RBC optical tweezers and shear flow experiments with our corresponding simulations to verify the RBC mechanical properties for the chosen RBC spring connected network. Upon validation of the RBC mechanical properties, several simulations are performed to ensure that the cellular solver is able to capture the RBC high deformation in narrow micro-channels. To test the capability of the damage model, we then simulate the RBC deformation up to the rupture inside a microchannel experimentally investigated in (Abkarian et al. 2008). Eventually, for the microfiltration, the effects of the filtration pressure and sieve pore size on hemolysis are quantified and compared with an experimental study (Chien et al. 1971).
2. Numerical algorithm
The numerical algorithm used in this study has two main parts: cellular fluid-structure interaction (FSI) solver and sub-cellular damage model. The cellular FSI solver itself is comprised of three components, i.e. flow solver (LBM), spring connected network (SN) and an immersed boundary method (IBM). Figure 1 shows the numerical algorithm flowchart that clearly explains the relations between different constituent parts (Sohrabi and Liu 2017). As the figure shows, first the flow field is solved using LBM and the calculated velocities transferred by IBM to the SN RBC model. Local strain distribution is then computed by SN model. It should be noticed that the force field of SN in this study is different from what we used in our previous study (Sohrabi and Liu 2017). This force field is more suitable for high shear rate and deformation (Závodszky et al. 2017). More details about SN force field will be provided in the corresponding section. The pore size is then calculated using some MD correlations. The computed pore radius is then related to the Hb release by a diffusion equation in which the effective diffusion and membrane thickness are functions of areal strain to consider the effects of steric hinderance and increased hydrodynamic drag due to the size of the hemoglobin molecule. It is assumed that Hb release does not have any effect on the flow field. As the RBC membrane moves through the blood, each part on the SN RBC model senses different loading conditions in accordance with their orientation with respect to the flow field. In this study, we assume pore is generated on the RBC membrane once the local areal strain goes beyond the specific critical threshold (above 20%). The pores in damaged patches are considered closed as areal strain reaches below 20% when pore size is smaller than the Hb molecule (less than 10 nm) (Sohrabi and Liu 2017). It is worth mentioning that because of using cellular solver at the microscale, SN for the RBC modeling and a MD-based damage model, the proposed approach can be considered as a multiscale algorithm. The summary of the numerical algorithm is illustrated in Fig. 2. The following sub-sections briefly describe different elements of the proposed numerical process.
Fig. 1.
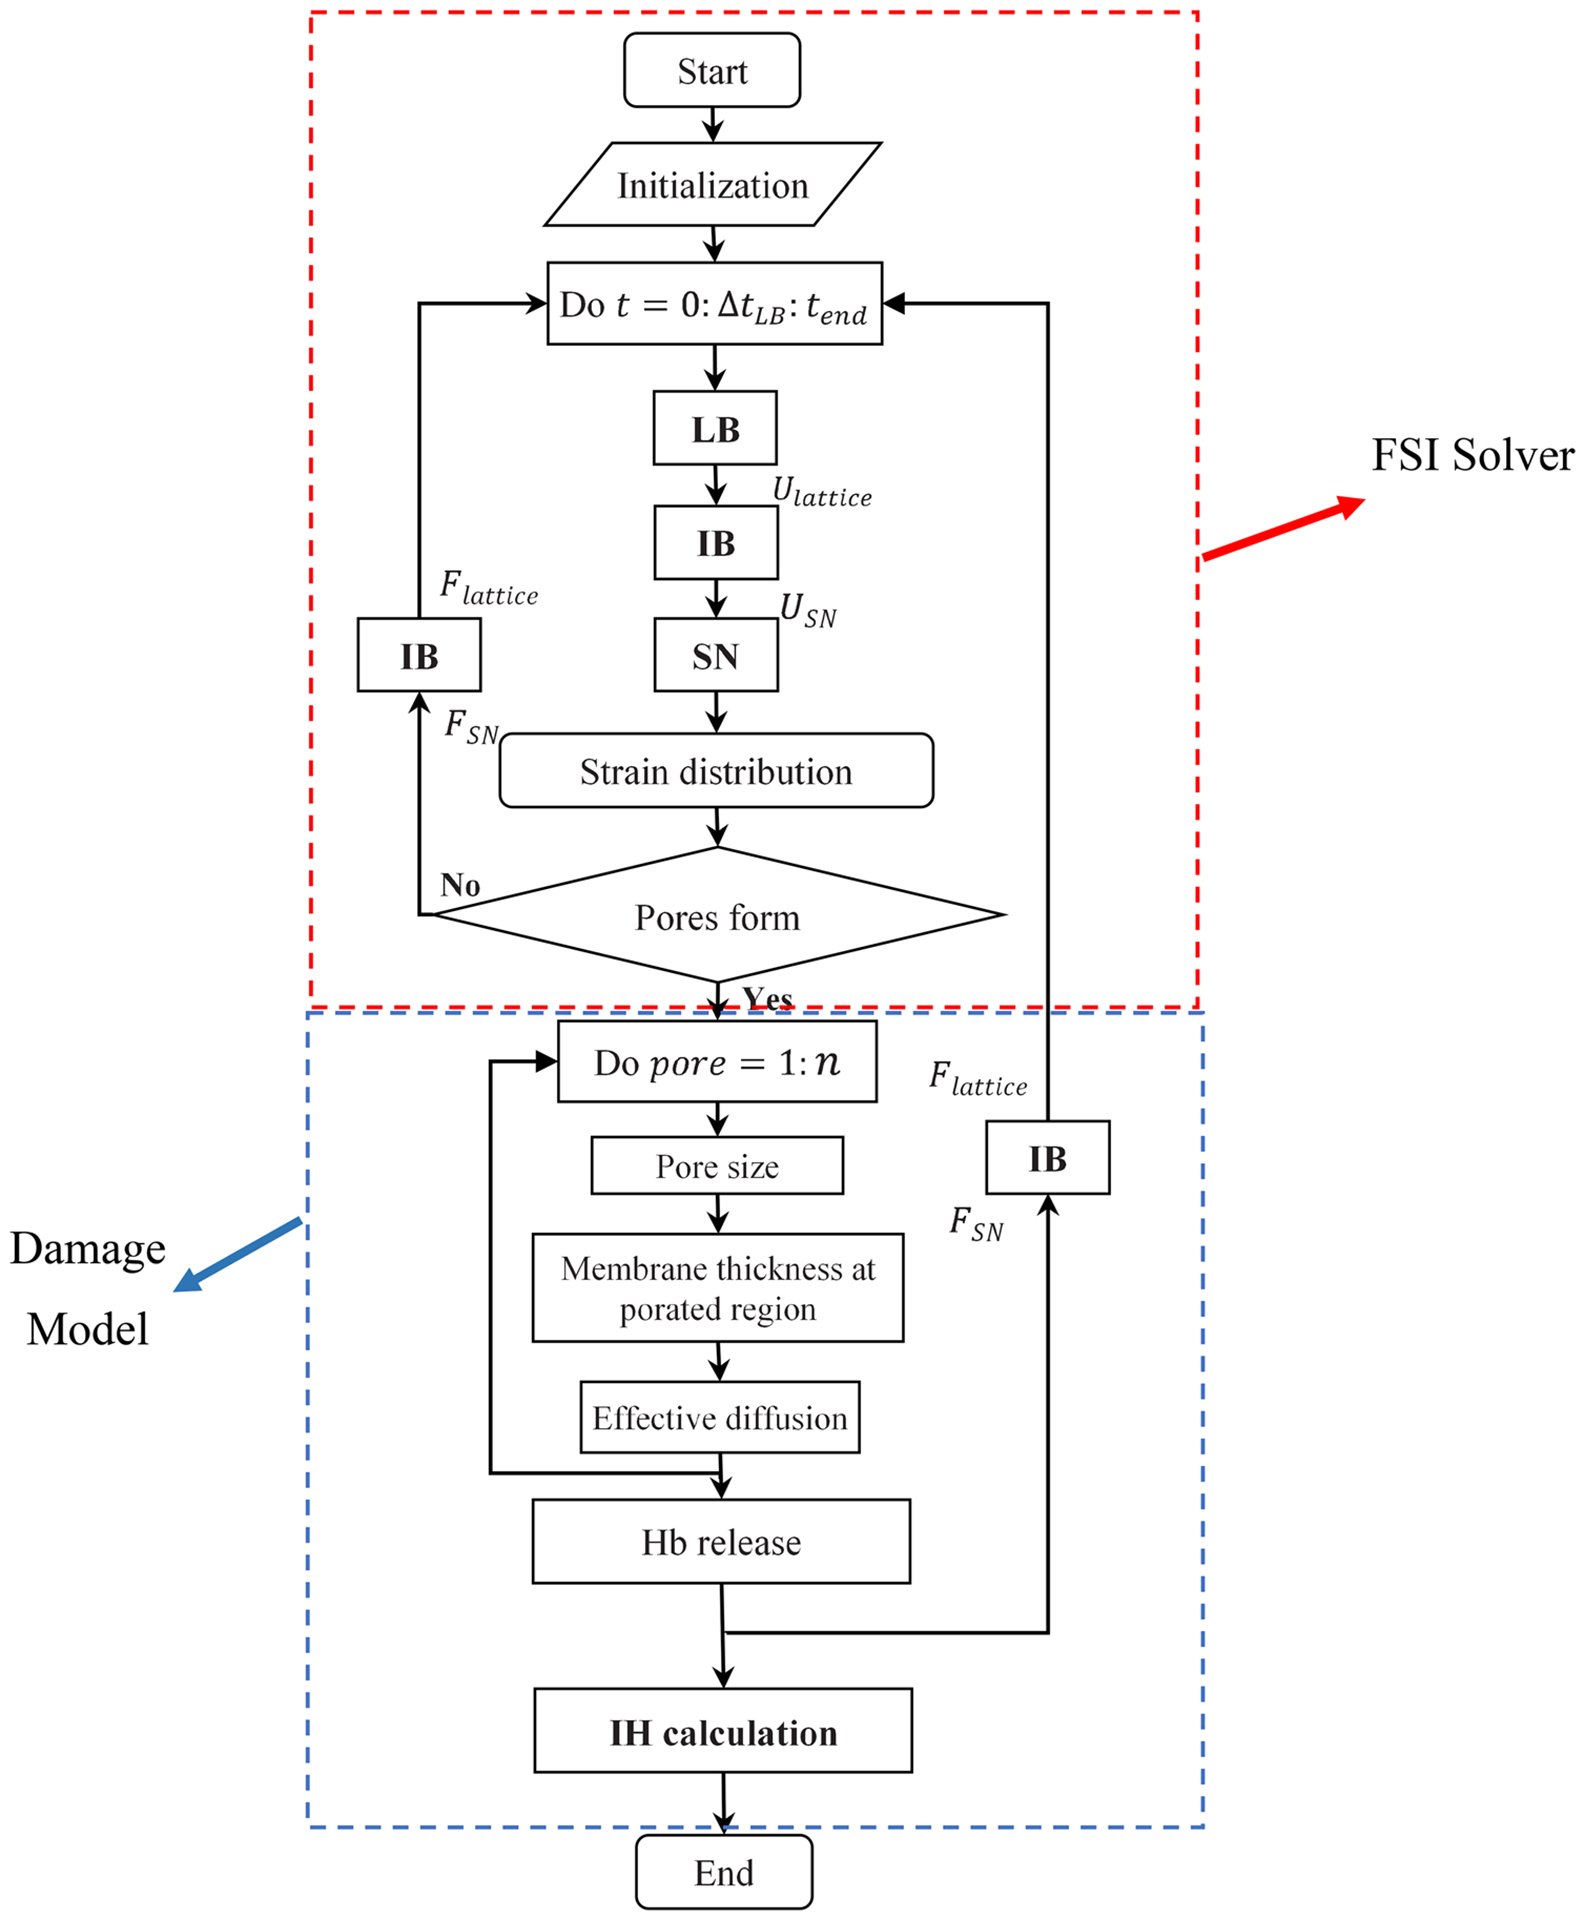
Numerical algorithm flowchart
Fig. 2.
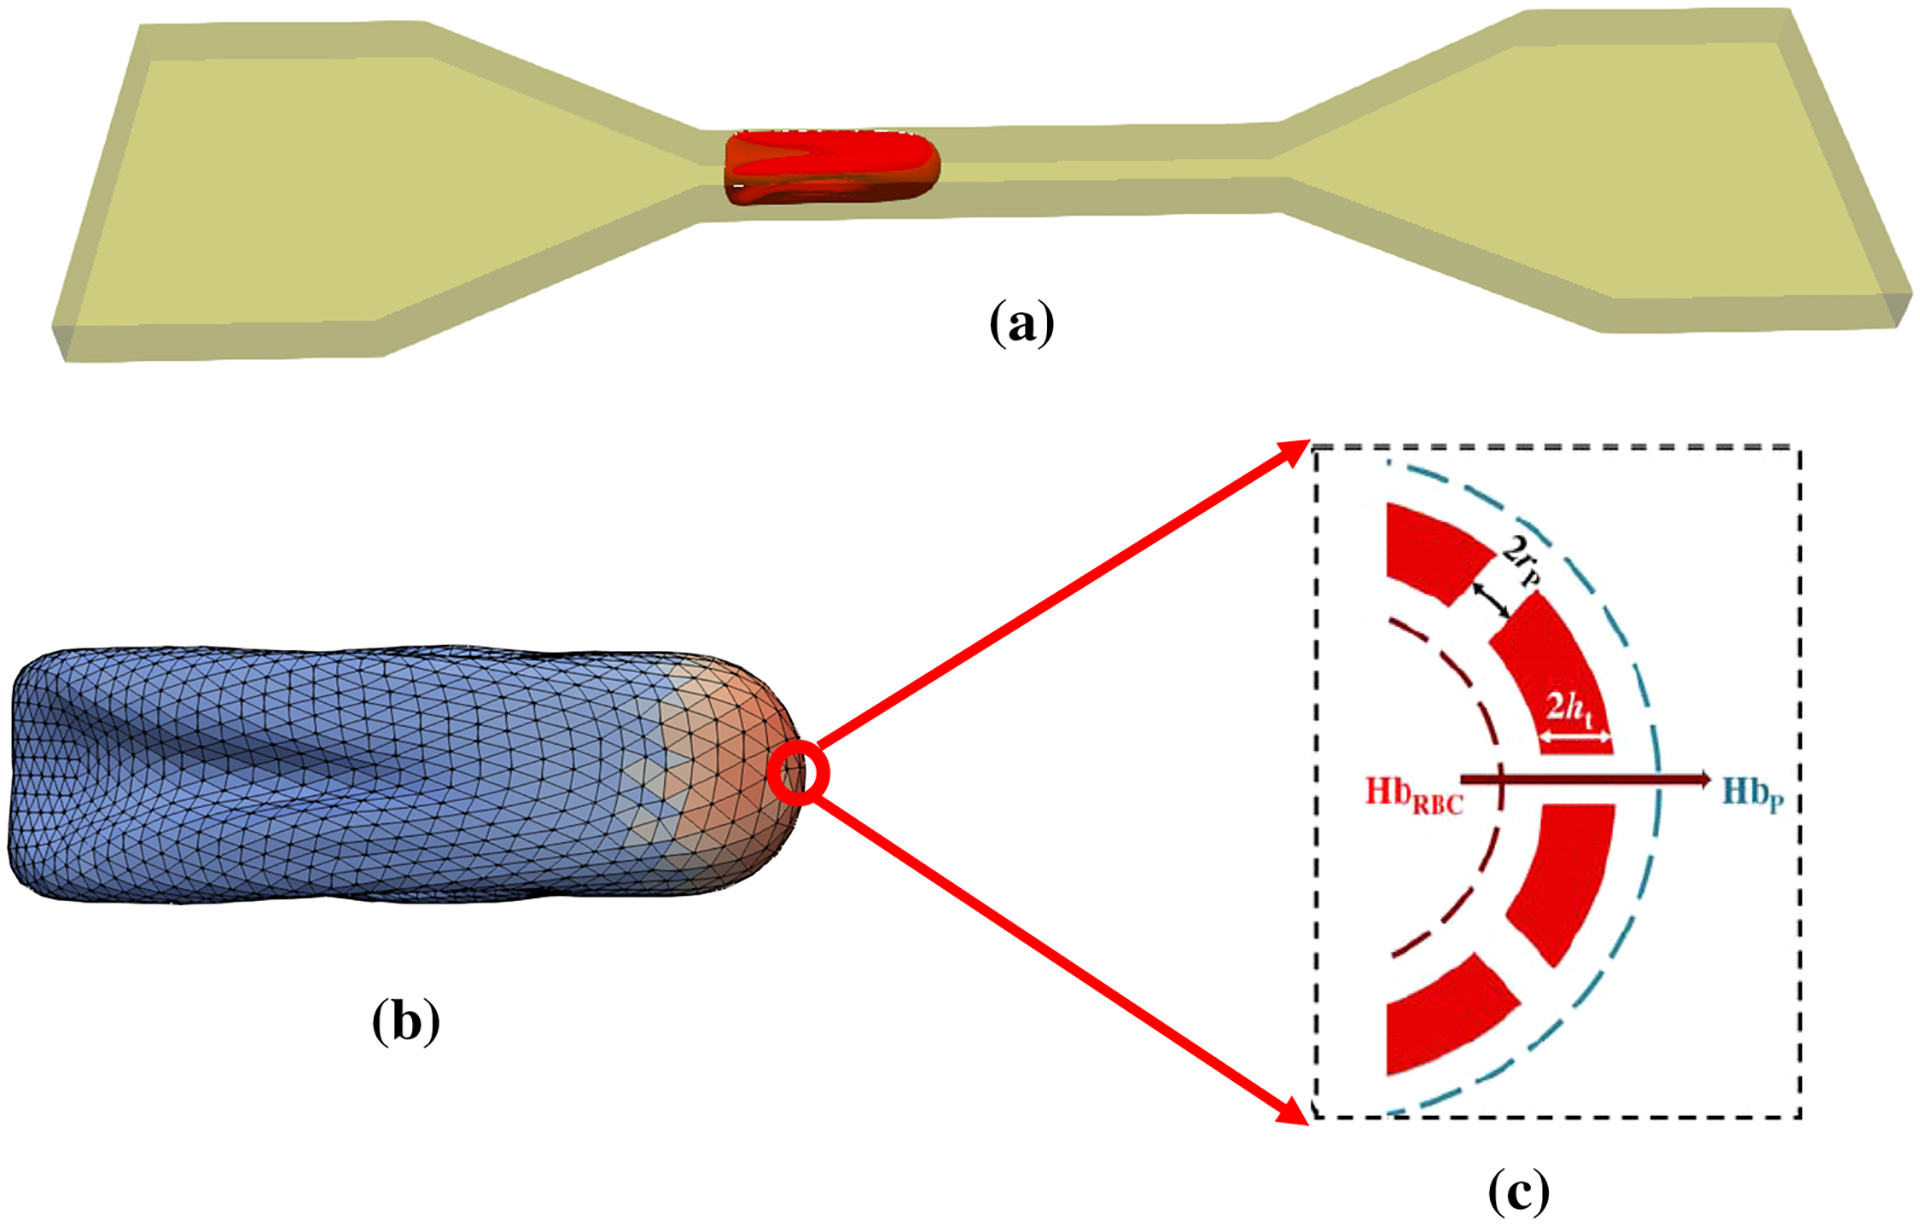
The summary of multiscale cell damage model: a RBC deformation in a micro-channel; b local strain distribution and nano-pore formation on the RBC membrane; c Hb diffusion out of porated regions on the high-strained triangulated meshes
2.1. Flow solver
Attracted by its particulate nature and parallel computing capabilities, the lattice Boltzmann method (LBM) has been developed and is used as the fluid solver in current study (Tan et al. 2016). Algorithms of LBM are reported extensively in literature (Chen and Doolen 1998; Succi 2001). The key concept is the particle distribution function fi(x, t) at phase space at time t, where is the discretized velocity. The LBM dynamics involve streaming and collision steps:
| (1) |
where Ωi is the collision operator, and is the force term. Note that the force term is important where the existence of cell domain is replaced through a force density. The details are discussed in the immersed boundary method section. In this study, Bhatnagar-Gross-Krook (BGK) collision operator and appropriate boundary conditions are used (Zou and He 1997). Macroscale density and velocity can be calculated as follows:
| (2) |
In simulations involving deformable capsules in biological flows, the viscosity difference across the membrane is important. In human RBCs, the interior cytoplasm is five times as viscous as the surrounding plasma. This viscosity difference influences the RBC dynamics and can be simply implemented using different relaxation parameters inside and outside of the RBC.
2.2. Spring connected network
The force field of SN in this study is different from what we used in our previous study (Sohrabi and Liu 2017). This force field is more suitable for high shear rate and deformation (Závodszky et al. 2017). In this study, we consider the RBC surface as a biconcave membrane immersed into the solvent (Závodszky et al. 2017). The membrane is discretized using vertex points which are connected by segments to create triangular meshes (Fig. 3a). In all of our simulations, the RBC membrane consists of Nt = 5120 faces. It should be mentioned that we have tried the RBC with 1280, 5120 and 20,480 triangulated meshes for all the cases in this paper. We observed that refining the grid more than 5120 generates less than 5% difference in the final results. Therefore, Nt = 5120 faces was chosen for all the simulation in this study. The RBC reactions to the deformations implemented by the fluid or any other external forces are formulated via four forces including area force, volume force, link force and bending force (Závodszky et al. 2017). These forces are defined as follows (Závodszky et al. 2017):
| (3) |
| (4) |
| (5) |
| (6) |
where L, θ, A and V are the edge length of surface element, angle between two neighboring surface elements, triangulated patch area and RBC volume, respectively. The 0 index stands for the equilibrium value for each variable which is obtained right after generating an equilibrate state for the RBC when we do not have any external force. It should be noted that for small deformations, these forces are all linearly dependent on different RBC deformation modes via independent coefficients (kl, kb, ka, kv), however in enough large deformations, the cytoskeleton effect (τl, τb, τa, τv) is considered in calculating these forces (Závodszky et al. 2017). The link force acts along segments between surface points and represents the response to stretching and compression of the underlying spectrin network beneath the representative link. The bending force acts between two neighboring surface elements representing the bending response of the membrane arising primarily from the nonzero thickness of the spectrin network. The local areal force acts locally on surface elements (i.e., triangles) and has the same form. It represents the combined surface response of the supporting spectrin network and the lipid bilayer of the membrane to stretching and compression. The volume conservation force is the only global term. It is used to maintain quasi-incompressibility of the cell. It is applied at each node of each surface element and it points towards the normal of the surface. The kinematics for stretching and bending of the spring network is shown in Fig. 3b. The properties of the RBC as well as the values of different parameters used in the RBC model are listed in Table 1. It should be mentioned that independent coefficients (kl, kb, ka, kv) must be set in a way to reproduce the RBC with realistic mechanical properties (Young’s modulus, shear modulus and Poisson’s ratio). These parameters are dependent on the RBC computational grid resolution. The parameters related to cytoskeleton effect (τl, τb, τa, τv) should also be set such that they can prevent the RBC model from unphysical changes/deformation. More details about these forces can be found in Závodszky et al. (2017).
Fig. 3.

a computational grid and sample local normal vectors for triangular patches, b 2D illustration of kinematics for stretching and bending in spring connected network
Table 1.
RBC properties and different parameters used in the SN RBC model
| Parameter | Value |
|---|---|
| RBC area (A) | 135.00 μm2 |
| RBC volume (V) | 95.00 μm3 |
| Equilibrium length (L0) | 0.247 μm |
| Persistence length (p) | 7.5 nm |
| kBT | 4.100531391 × 10⁻²¹ m2kg/s2 |
| kl | 9.00 kBT |
| kb | 50.00 kBT |
| ka | 5.00 kBT |
| kv | 20.0 kBT |
| τl | 3.00 |
| τb | 0.523 (π/6) |
| τa | 3.00 |
| τv | 0.01 |
One of the challenges in modeling cell squeezing is to correctly capture the thin fluid behavior when the cell membrane moves close to the wall. When the gap between the cell membrane and the wall is very small, e.g., the gap is smaller than a lattice space, the LBM fluid solver cannot resolve the thin fluid flow motion. One approach is to use a finer mesh for the whole fluid domain or refine the mesh near the boundary layers (Tan et al. 2018). This approach would increase the LBM simulation time as the lattice space is reduced. It also requires some effort to handle the density distribution passage over the interface if a multigrid is used in LBM. Another approach is to introduce a lubrication force to repel the cell membrane so that there is enough fluid within the gap. The physics behind the lubrication force model is that the fluid within the gap has to be displaced if the cell membrane moves close to the wall. As the gap gets smaller, there is less space for fluid displacement, thus requiring a larger force to drive the fluid away. This results a repelling force on the cell membrane. The faster the cell moves towards the wall, the bigger the repelling force generated by the fluid. The lubrication repelling force was introduced to the lattice Boltzmann method in Tan et al. (2018). Following their work, the lubrication force derived from the lubrication theory between two identical spheres is
| (7) |
where r is the spherical radius, μ is the fluid dynamic viscosity, s is the dimensionless gap. xij is the position vector difference between sphere i and j, defined as xij = xi − xj, is the unit vector. u is the spherical velocity. Equation (7) can also be extended to the case where a sphere approaches a stationary wall by setting uj = 0.
2.3. Immersed boundary method
Immersed boundary method (IBM) is suitable for fluid-soft structure interaction such as cells and particulate flow and is well developed in our previous studies (Liu et al. 2006; Tan et al. 2012, 2013a, b; Sohrabi et al. 2014). The fluid is solved on an Eulerian grid which does not conform to the solid mesh. A force density is applied to the fluid to represent the effect of immersed solid boundary:
| (8) |
The immersed cell is treated as a parametric surface X(s, t), then the force exerted by the cell structure on the fluid is spread as a source term into the momentum equation. Similarly, the solid velocity will be interpolated from the local fluid nodes. In other words, IBM is used to transfer force and velocity data back and forth between LB (fluid) and SN (cell model) as follows:
| (9) |
where F′(x, t) is the structural force at location s at time of t, ds is the discretized length of the immersed structure. Indeed, after solving fluid flow via LBM and obtaining the velocity from Eq. (2), the velocity of each nodal point on the RBC membrane is interpolated. Based on the interpolated velocity, the resultant force (F(s, t)) on each vertex on the RBC membrane is calculated. Afterwards, F′(x, t) is computed on LB points (Eq. (9)) and plugged into Eq. (2). The force is spread to the local fluid nodes through a delta function δ(r):
| (10) |
2.4. Damage model
To the best of our knowledge, all previous strain-based hemolysis studies are based on global areal strain (Arora 2005; Arora et al. 2004, 2006; Vitale et al. 2014; Ezzeldin et al. 2015). Our sublytic damage model is based on hindered Hb release out of pores formed in critical regions. We also assume that pores do not grow bigger than spectrin length (Sohrabi and Liu 2017). Pore formation at the molecular level is a statistical phenomenon (Koshiyama and Wada 2011). Many researchers have performed MD simulations to analyze the pore structure in the lipid bilayers (Tomasini et al. 2010; Tolpekina et al. 2004; Den Otter 2009; Leontiadou et al. 2004). Among them, Koshiyama and Wada (2011) modeled pore formation dynamics under various stretching speeds. Similar to our previous study (Sohrabi and Liu 2017), we assume that the membrane stretch can be considered as quasistatic (QS) in extreme cases of sublytic hemolysis. Therefore, the average chance of pore formation as a function of areal strain can be presented using an error function to demonstrate the ratio of patches containing pores to total number of patches (Koshiyama and Wada 2011):
| (11) |
where and σ = 0.07 are mean and variance of critical areal strain respectively (Sohrabi and Liu 2017). The next part of the damage model is to link the RBC areal strain to pore size. Tolpekina et al. (2004) used coarse-grained molecular dynamics (CGMD) to stretch a lipid bilayer patch up to 1.7 of its equilibrium area. They presented the phase diagram of pores and identified regions where pores are stable. Based on these findings, the below theoretical model is used to correlate pore radius, Rpore, and areal strain:
| (12) |
in which A0 is the area of the tensionless membrane without a pore; KA = 250 mJ/m2 is the compressibility modulus of membrane; and kc = 3.5 × 10⁻¹¹ J/m is the line tension coefficient. More details about the damage model can be found in Sohrabi and Liu (2017). In our simulation, it is assumed that pores do not become bigger than spectrin length, 75 nm (Sohrabi and Liu 2017). Above this limit, we assume that RBCs are ruptured and all the Hb content is released to the blood. Once the pore radius is large enough, Hb can be released. The Hb flux out of pores on each triangulated mesh can be calculated as follows (Sohrabi and Liu 2017):
| (13) |
where L is RBC membrane thickness, HbRBC and Hbp are the intracellular and plasma Hb concentrations, respectively. Vp is the plasma volume; Deff is the effective diffusion coefficient of Hb out of nanopores; and Apore is the pore opening area. Vp, HbRBC, and index of hemolysis (IH) are expressed ad follows (Sohrabi and Liu 2017):
| (14) |
in which HbB is the total Hb blood. Using Eq. (14), Eq. (13) can be rewritten as follows:
| (15) |
It can be assumed that initially there is no Hb in the plasma, i.e. , so Eq. (15) can be simplified as follows:
| (16) |
where IH is hemolysis index, Hct is the blood hematocrit that varies between 0.3 and 0.4 in this study, and VRBC is the RBC volume. Time step (Δt) is usually 10−7secs ≤ Δt ≤ 10−6secs. Deff and L are Hb diffusion coefficient and RBC membrane thickness which can be determined based on the local areal strain (εA) (Sohrabi and Liu 2017). Koshiyama and Wada (2011) studied how membrane thickness at porated regions changes by areal strain, which has been applied into our model (Sohrabi and Liu 2017). Also, due to Hb high concentration inside RBC, its self-diffusion coefficient is six times smaller compared to that in dilute solution. Doster and Longeville (2007) experimentally showed the self-diffusion coefficient of Hb in RBC as 1.75 × 10⁻⁷ cm2/s, while its diffusion coefficient in dilute solution is reported as 8.61 × 10⁻⁷ cm2/s. Finally, during sublytic hemolysis, Hb diffuses out of temporary small nanopores. The effective diffusion coefficient of these macromolecules through pores of comparable size is usually lower than their value in a bulk solution. Hb transverse diffusion, known as “hindered” or “restricted” diffusion, occurred in two ways. First, steric and long-range interactions between Hb and pore wall in lipid bilayer inclined to separate Hb from some radial locations within the pores. Second, hydrodynamic drag on Hb molecule rises due to confined space of the pore (Davidson and Deen 1988). Both of these factors affect the Hb effective diffusion. The details of calculating the effective diffusion for our model can be found in Sohrabi and Liu (2017).
3. Validation
In this paper, the validation is achieved by solving four test cases. In the first and second test cases, to make sure that the chosen spring connected network can mimic the RBC mechanical properties, the optical tweezer (Mills et al. 2004) and shear flow (Yao et al. 2001) experiments are simulated. Modeling an RBC squeezing through micro-channels with different cross-sectional sizes is used as the third test case to verify the cellular FSI solver ability in simulating RBCs exposed to high deformation. As the last problem, the damage capability model is examined by simulating an inflated RBC rupture passing through a microchannel. In the following sub-sections, the details of each test case are presented.
3.1. Optical tweezers experiment
The schematic view of this problem is shown in Fig. 4. In this test case, a pair of forces is applied to 5% of the total nodes on each side of the cell membrane and in total there is 10% of the nodes subjecting to external forces. The stretch response of the RBC is measured by calculating the axial (DA) and transverse (DT) diameters of the stretched RBC. Figure 5 shows that our selected spring coefficients can reproduce the stretching behavior of a single RBC with good accuracy in agreement with the experimental data (Mills et al. 2004).
Fig. 4.
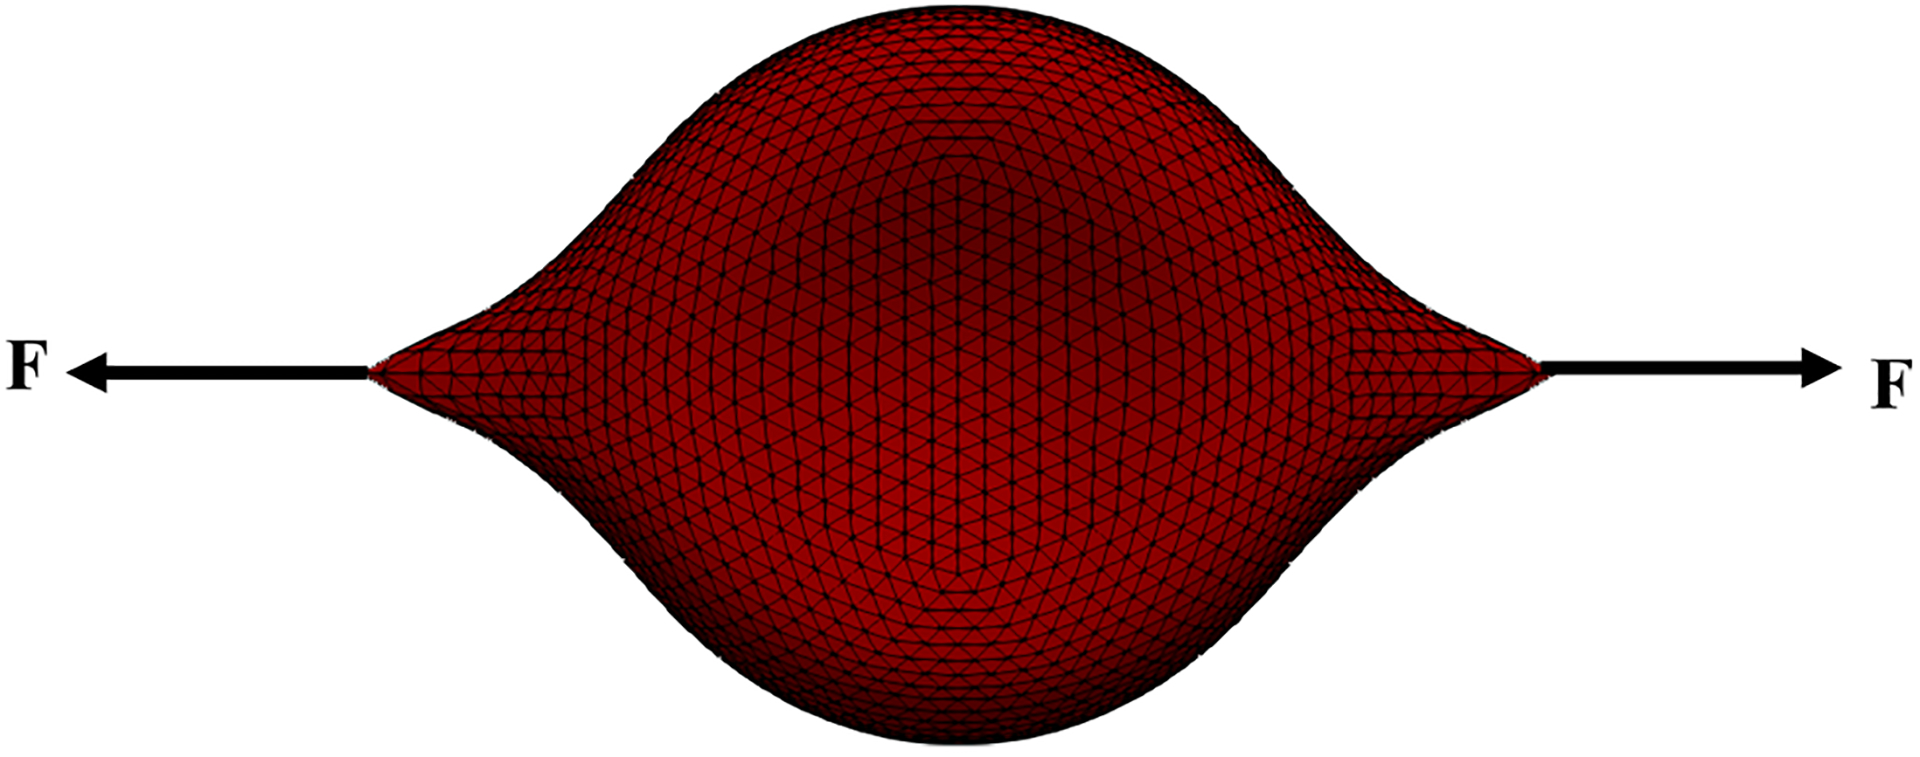
Schematic view of the optical tweezers experiment
Fig. 5.
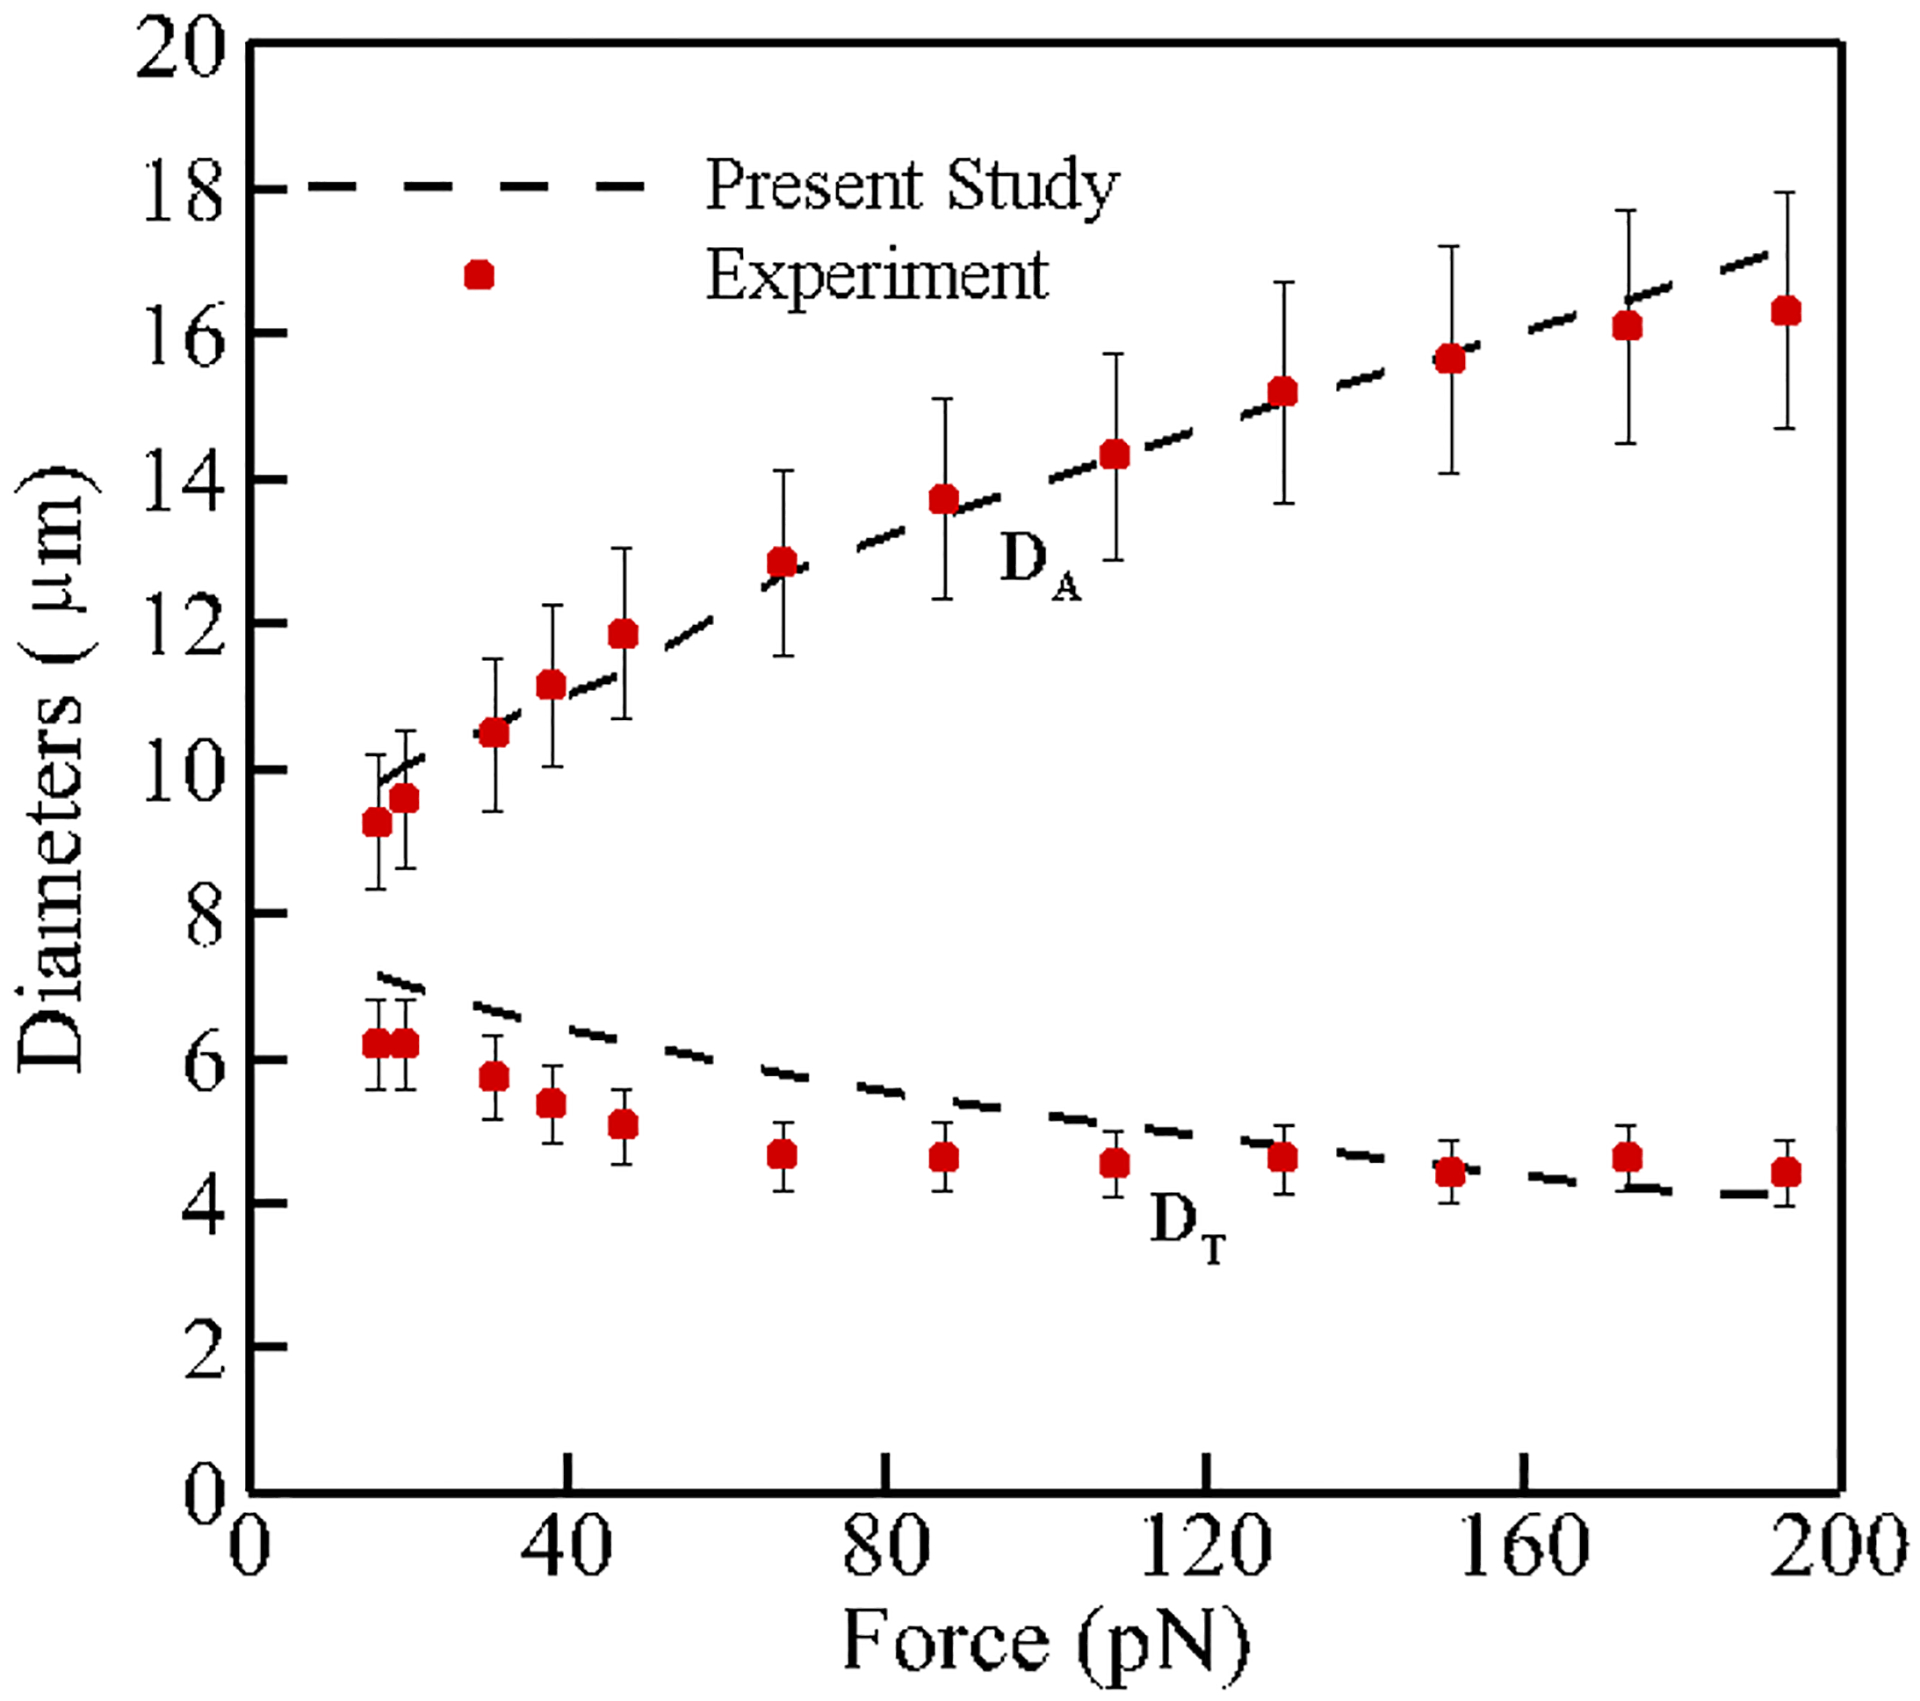
Comparison between axial and transverse RBC diameters obtained from numerical simulation and experimental data by Mills et al. (2004)
3.2. Shear flow experiment
In this test case, as Fig. 6 shows, an RBC is exposed to shear flow so that RBC symmetry axis is located in the plane of the shear and perpendicular to the flow velocity (Yao et al. 2001). According to (Yao et al. 2001), the deformation index of the RBC is defined as follows:
| (17) |
where Do is the initial diameter of the RBC (7.82 μm) and Dmax is the maximum diameter during the deformation at a constant shear rate value. Deformation index for different shear rates ranging from 17 to 200 s−1 is portrayed in Fig. 7. As it can be observed, numerical and experimental results (Yao et al. 2001) have good compatibility.
Fig. 6.
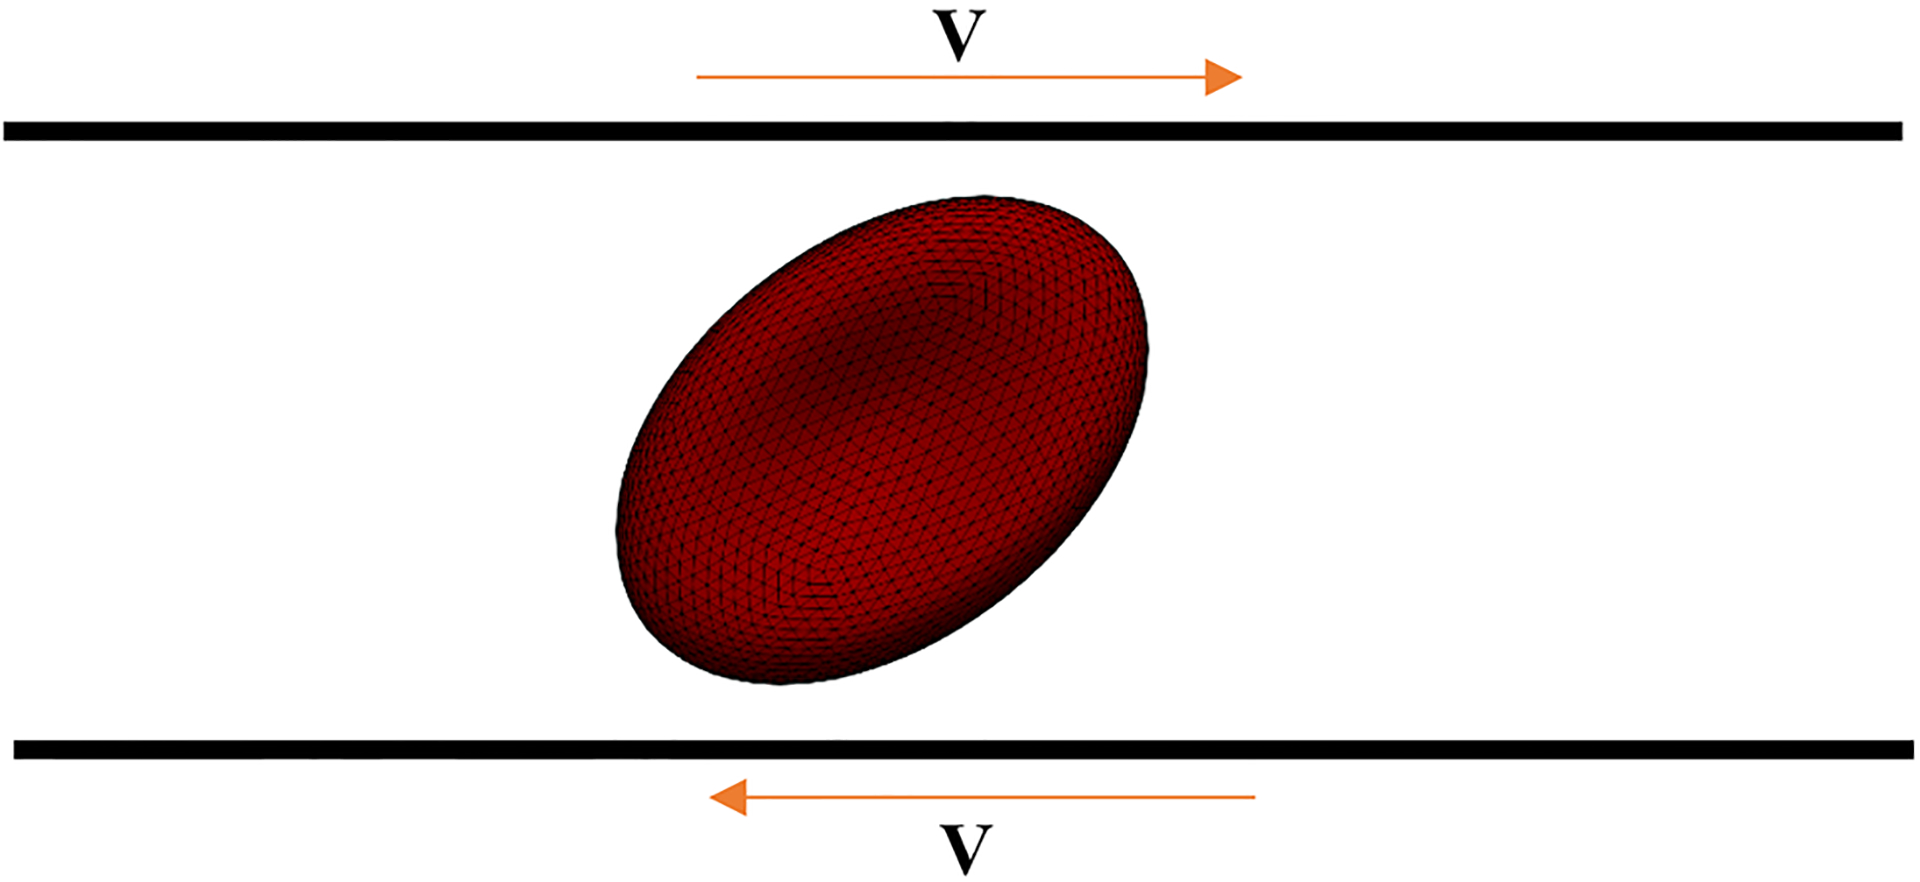
Schematic view of the shear flow experiment
Fig. 7.
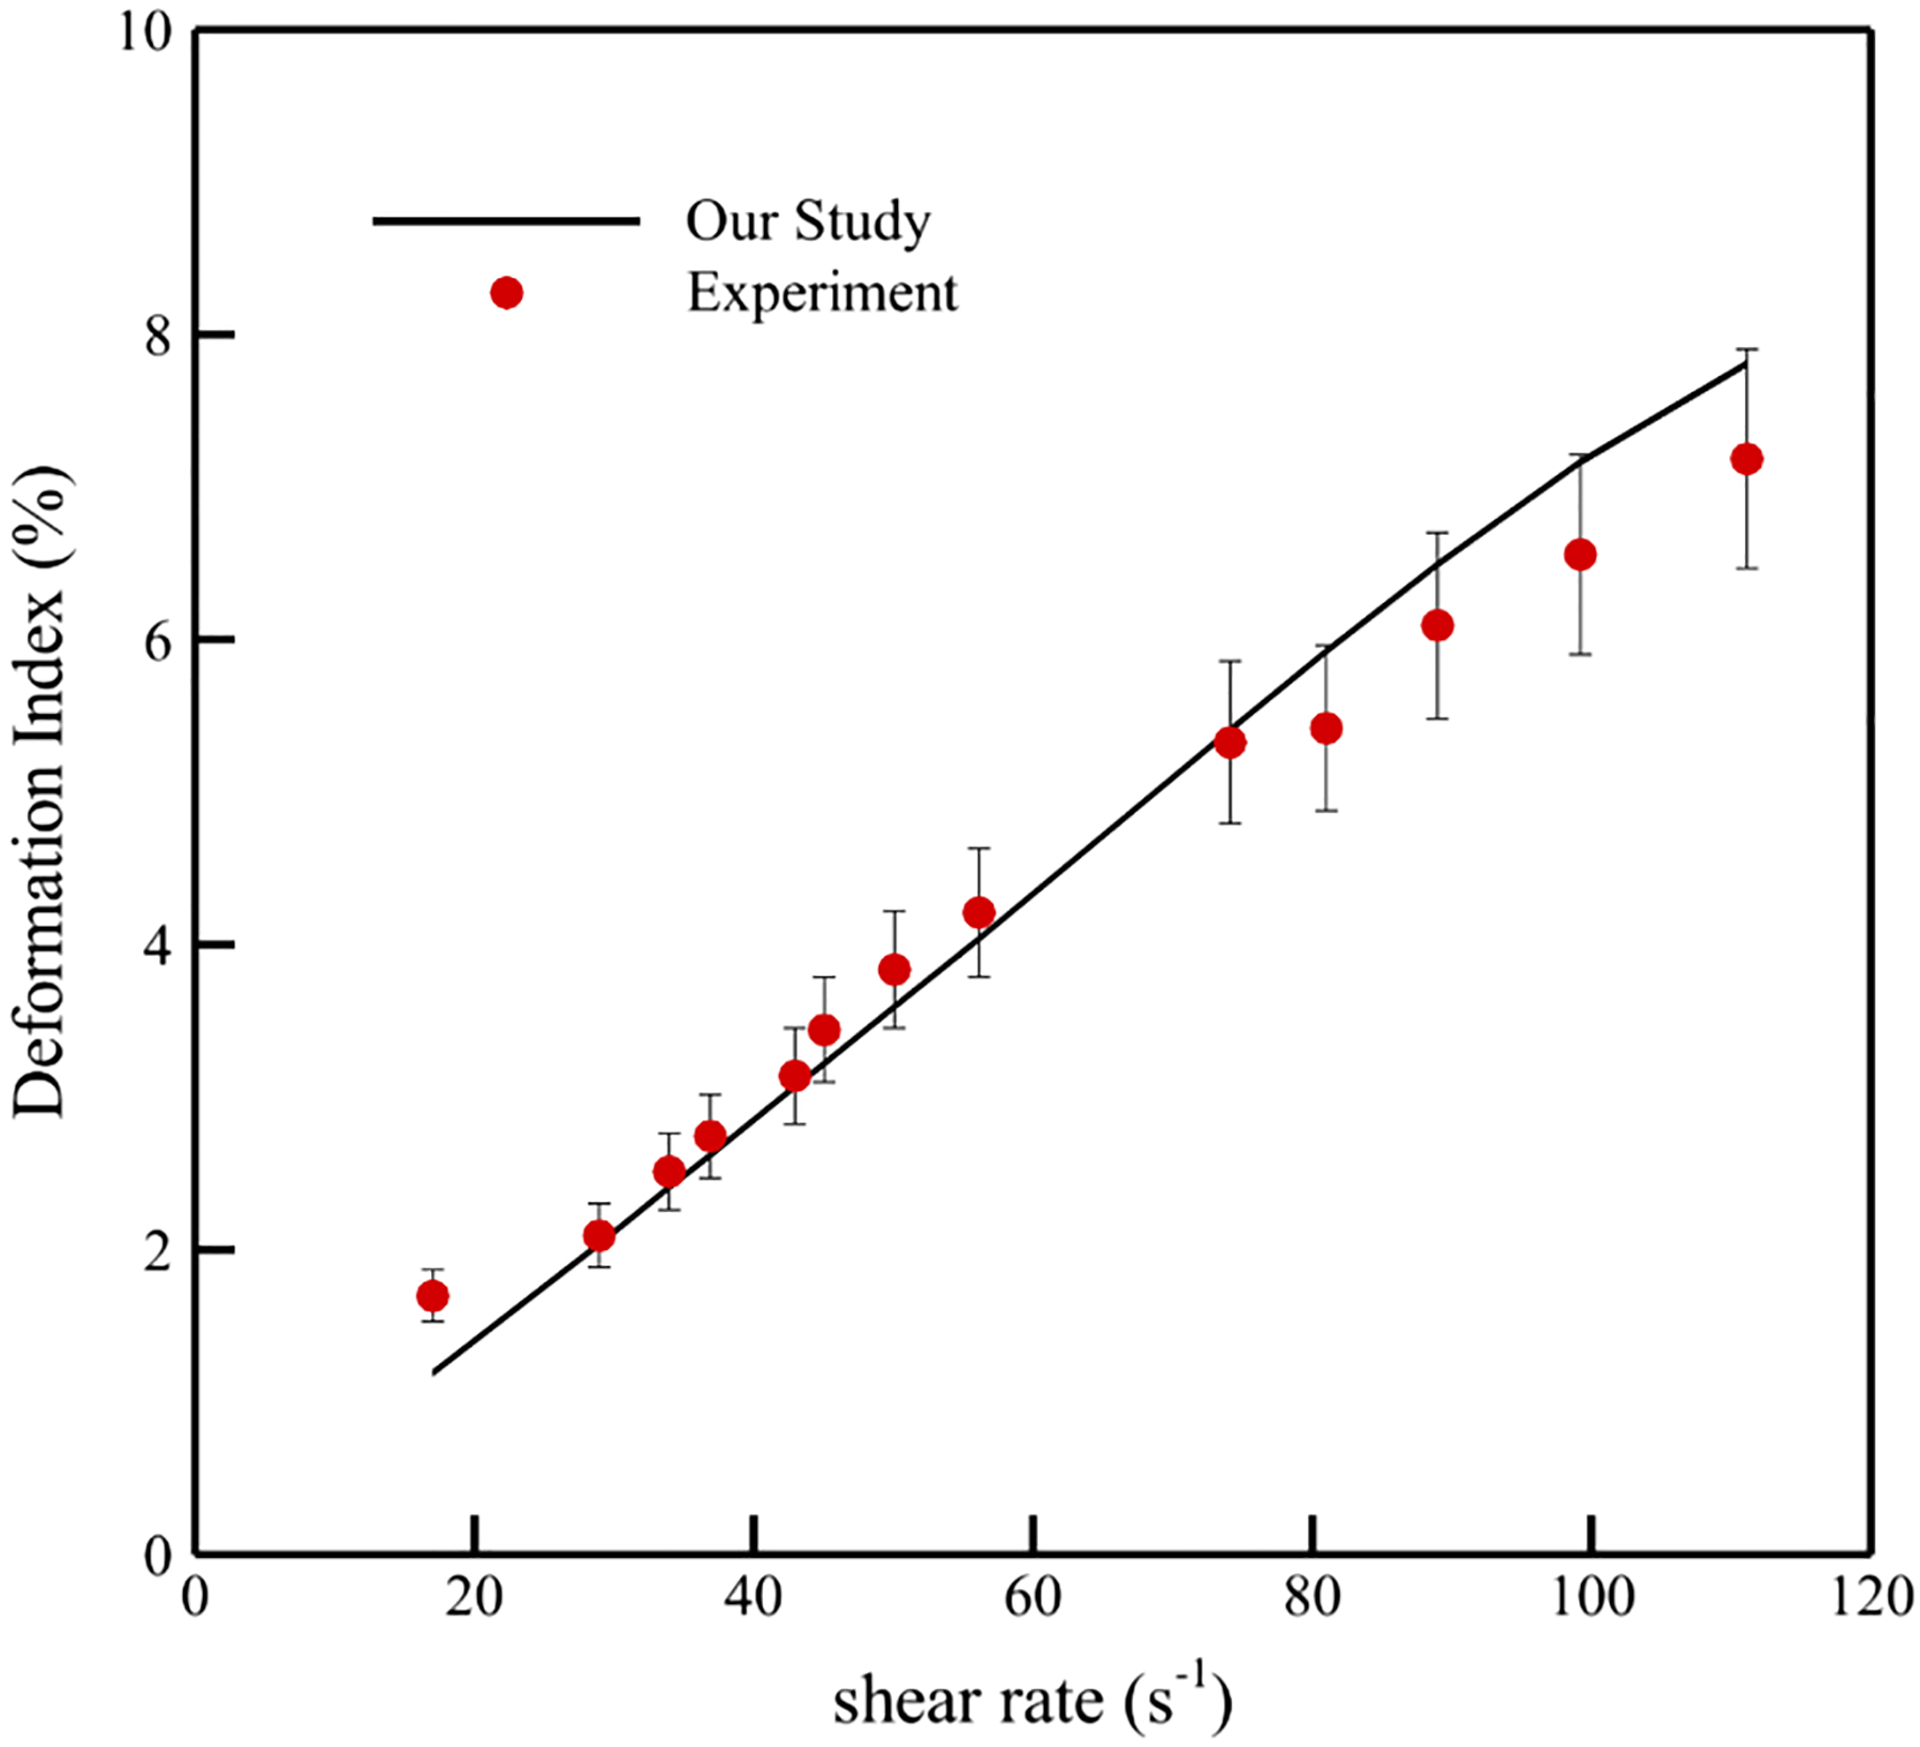
Comparison between deformation index obtained from numerical simulation and experimental data by Yao et al. (2001)
3.3. RBC under large deformation during squeezing in a microchannel
The geometry of this test case is shown in Fig. 8. In this problem, the RBC undergoes large deformation during squeezing through micro-channels that are 2.7 μm high, 30 μm long and 3–6 μm wide.
Fig. 8.
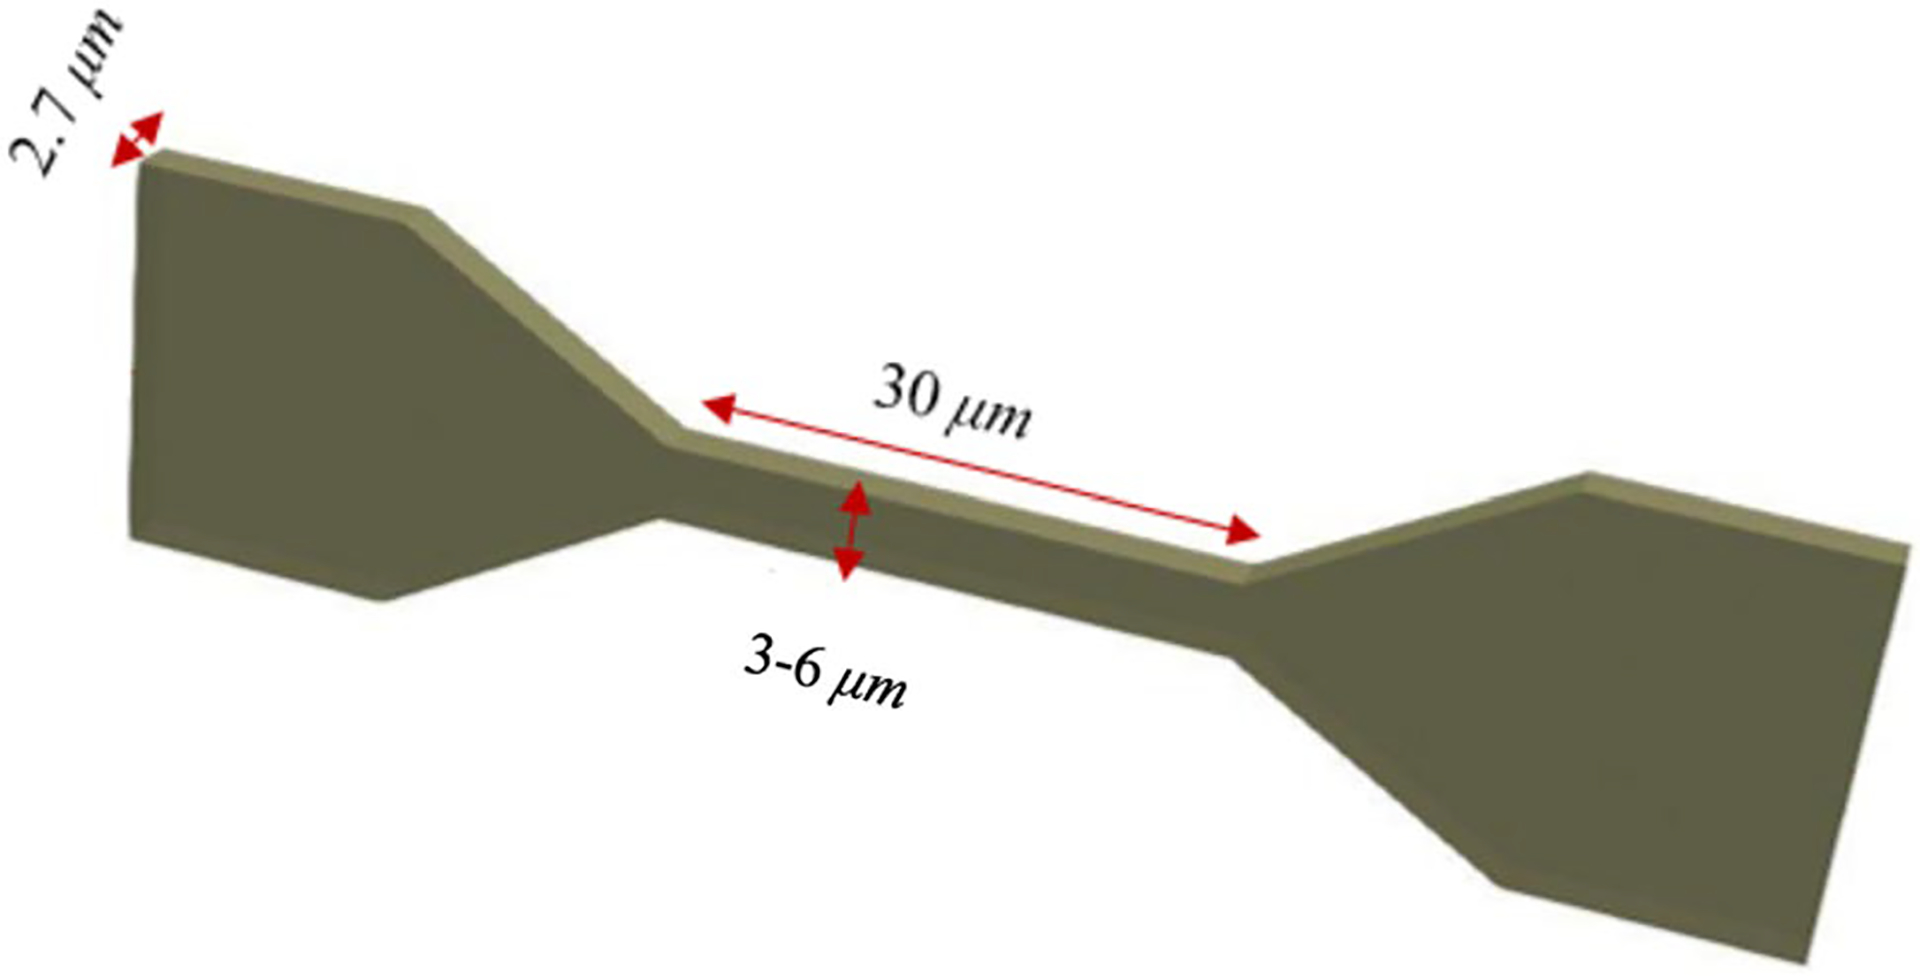
Computational domain together with the boundary conditions for an RBC squeezing through a micro-channel
Figure 9 shows a qualitative comparison between the numerical results and a similar experiment (Quinn 2011) for the RBC traversal across a 4 μm wide channel at three different locations. The color codes in Fig. 9 a show the fluid velocity magnitude on a slice in the middle of the channel. As it can be observed, when the cell enters and leave the constricted part (number 2 and 4), the velocity magnitude is less than other instances since the cell completely blocks the channel. Also, as the figure shows, the RBC shape is in acceptable agreement with the experimental ones (Quinn 2011).
Fig. 9.
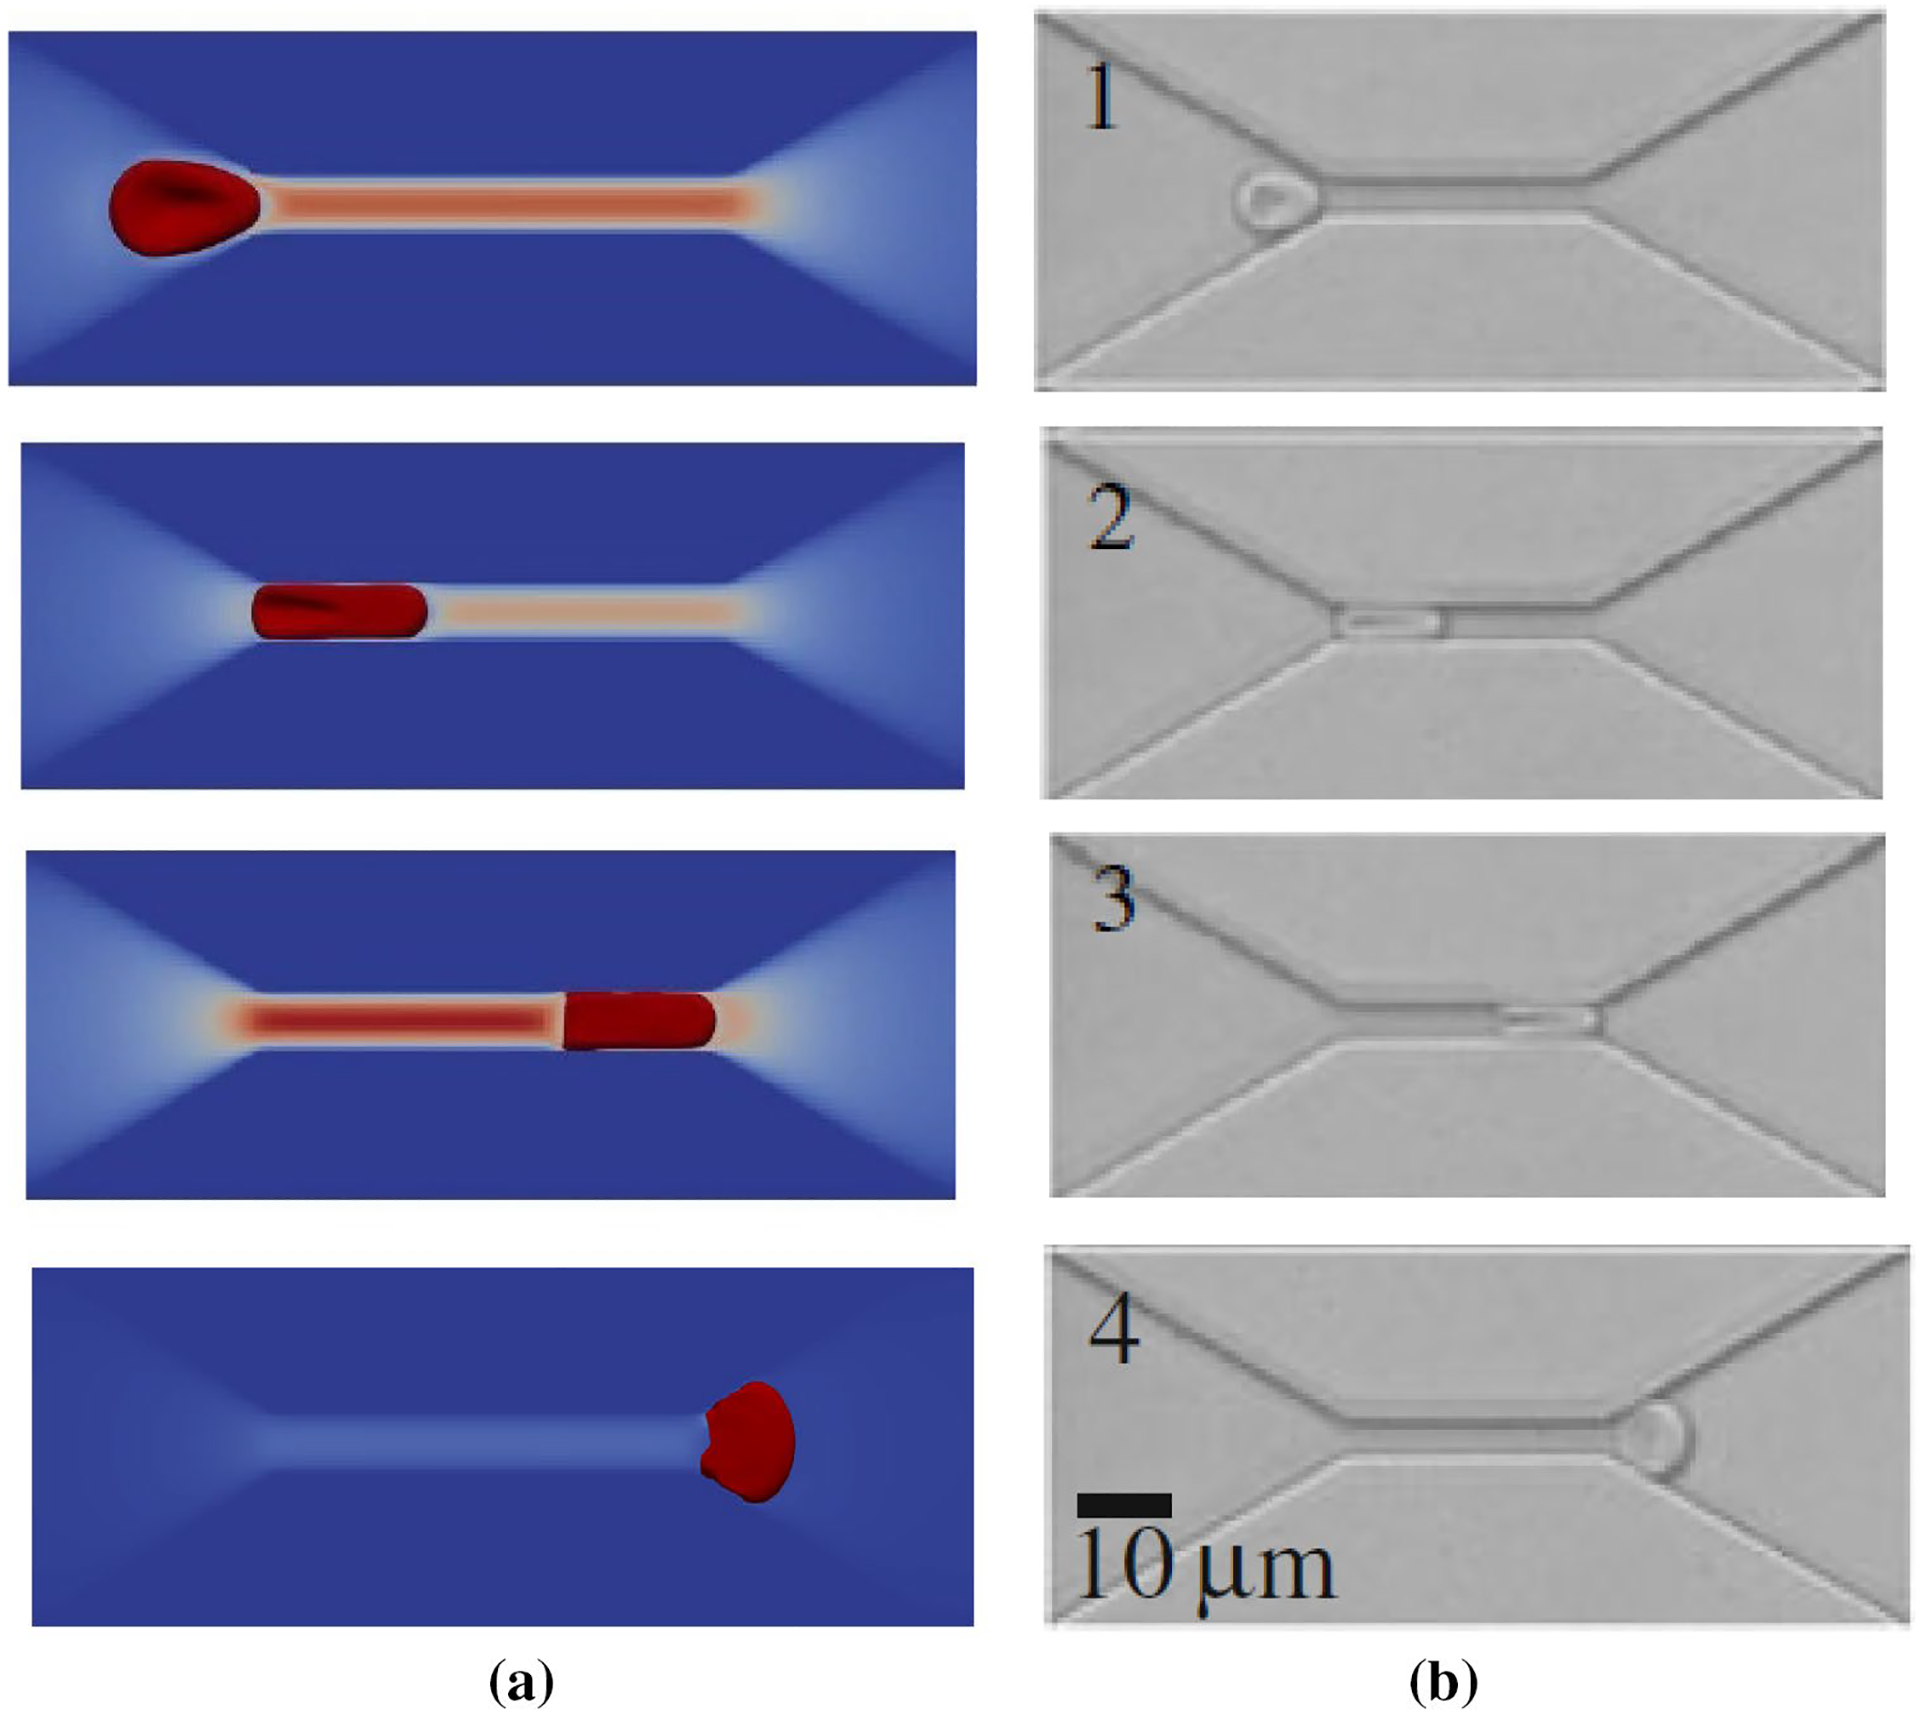
Schematic representation of a RBC traversing across a microfluidic channel, with a constriction 30 μm long, 4 μm wide and 2.7 μm high: a numerical simulation, b experimental study (Quinn 2011)
Figure 10 illustrates the RBC axial diameter measured at the center of the micro-channels with different widths. As the figure shows, relative error between numerical and experimental values is less than 10% for all the cases.
Fig. 10.
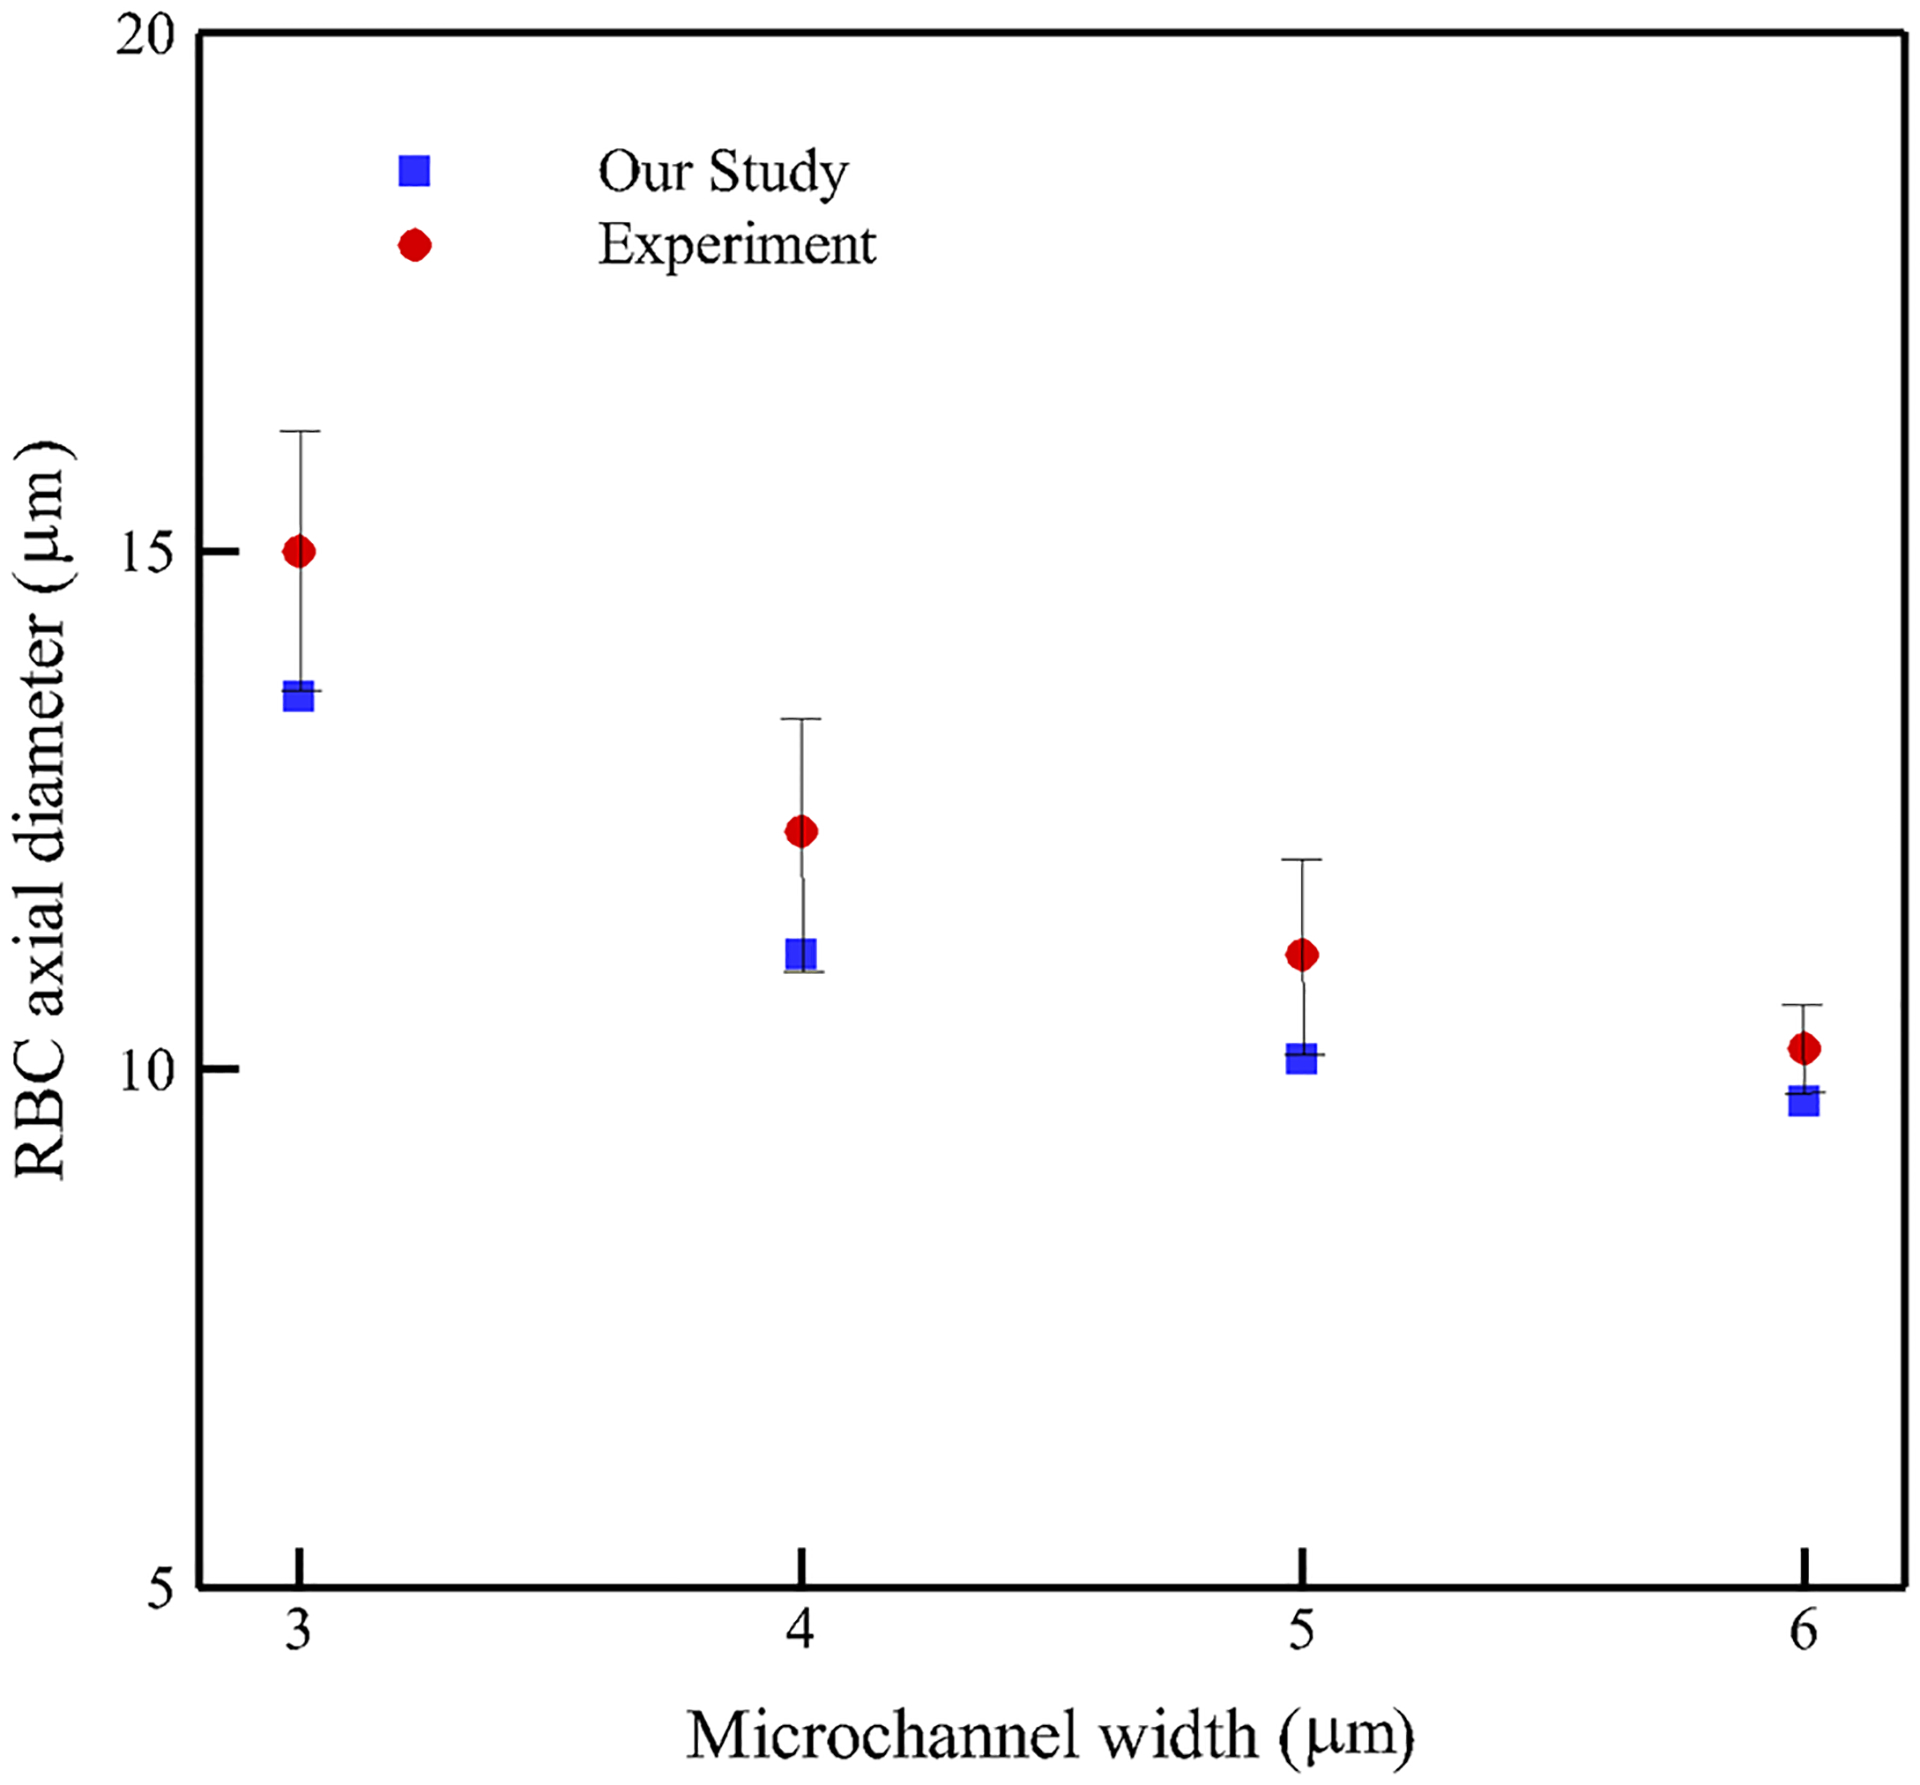
Simulated RBC lengths along with experimental ones (Quinn 2011) at the center of the microfluidic channel with different channel widths
3.4. RBC damage
In this problem, the geometry and boundary conditions are all similar to those used for the previous test case (Fig. 8). Here, the constriction length is 60 μm and its cross-section is 4 μm wide and 8 μm high. The purpose of solving this test case is to show the damage model ability in predicting the pore location in a swollen RBC traversing a micro-channel up to the rupture moment. As it was mentioned in the previous sections, we assume rupture occurs when the pore radius is above the spectrin length, 75 nm. It should be mentioned that a regular RBC will not experience any damage under these conditions (Abkarian et al. 2008). To create an inflated RBC, we generate a sphere with the same surface area as a regular RBC. While we hypothetically assume that mechanical properties of an inflated RBC and a healthy RBC are the same, inflated RBC is not stress-free and has more potential to get damaged. In Fig. 11, the RBC shape at the rupture moment captured in the experiment (Abkarian et al. 2008) is compared with the numerical results (Abkarian et al. 2008). It can be seen that the RBC shape in both studies is qualitatively close to each other. Also, the experimental results in (Abkarian et al. 2008) indicate that the pore is observed in the front of the RBC. Similarly in the numerical simulation, as Fig. 12 shows, the largest strain (1.2) is located in front of the RBC which has consistency with the experimental observations in Abkarian et al. (2008).
Fig. 11.

Inflated RBC shape at the lysis moment in a 60 μm long and 5 μm wide microchannel: a numerical simulation, b experimental results (Abkarian et al. 2008)
Fig. 12.
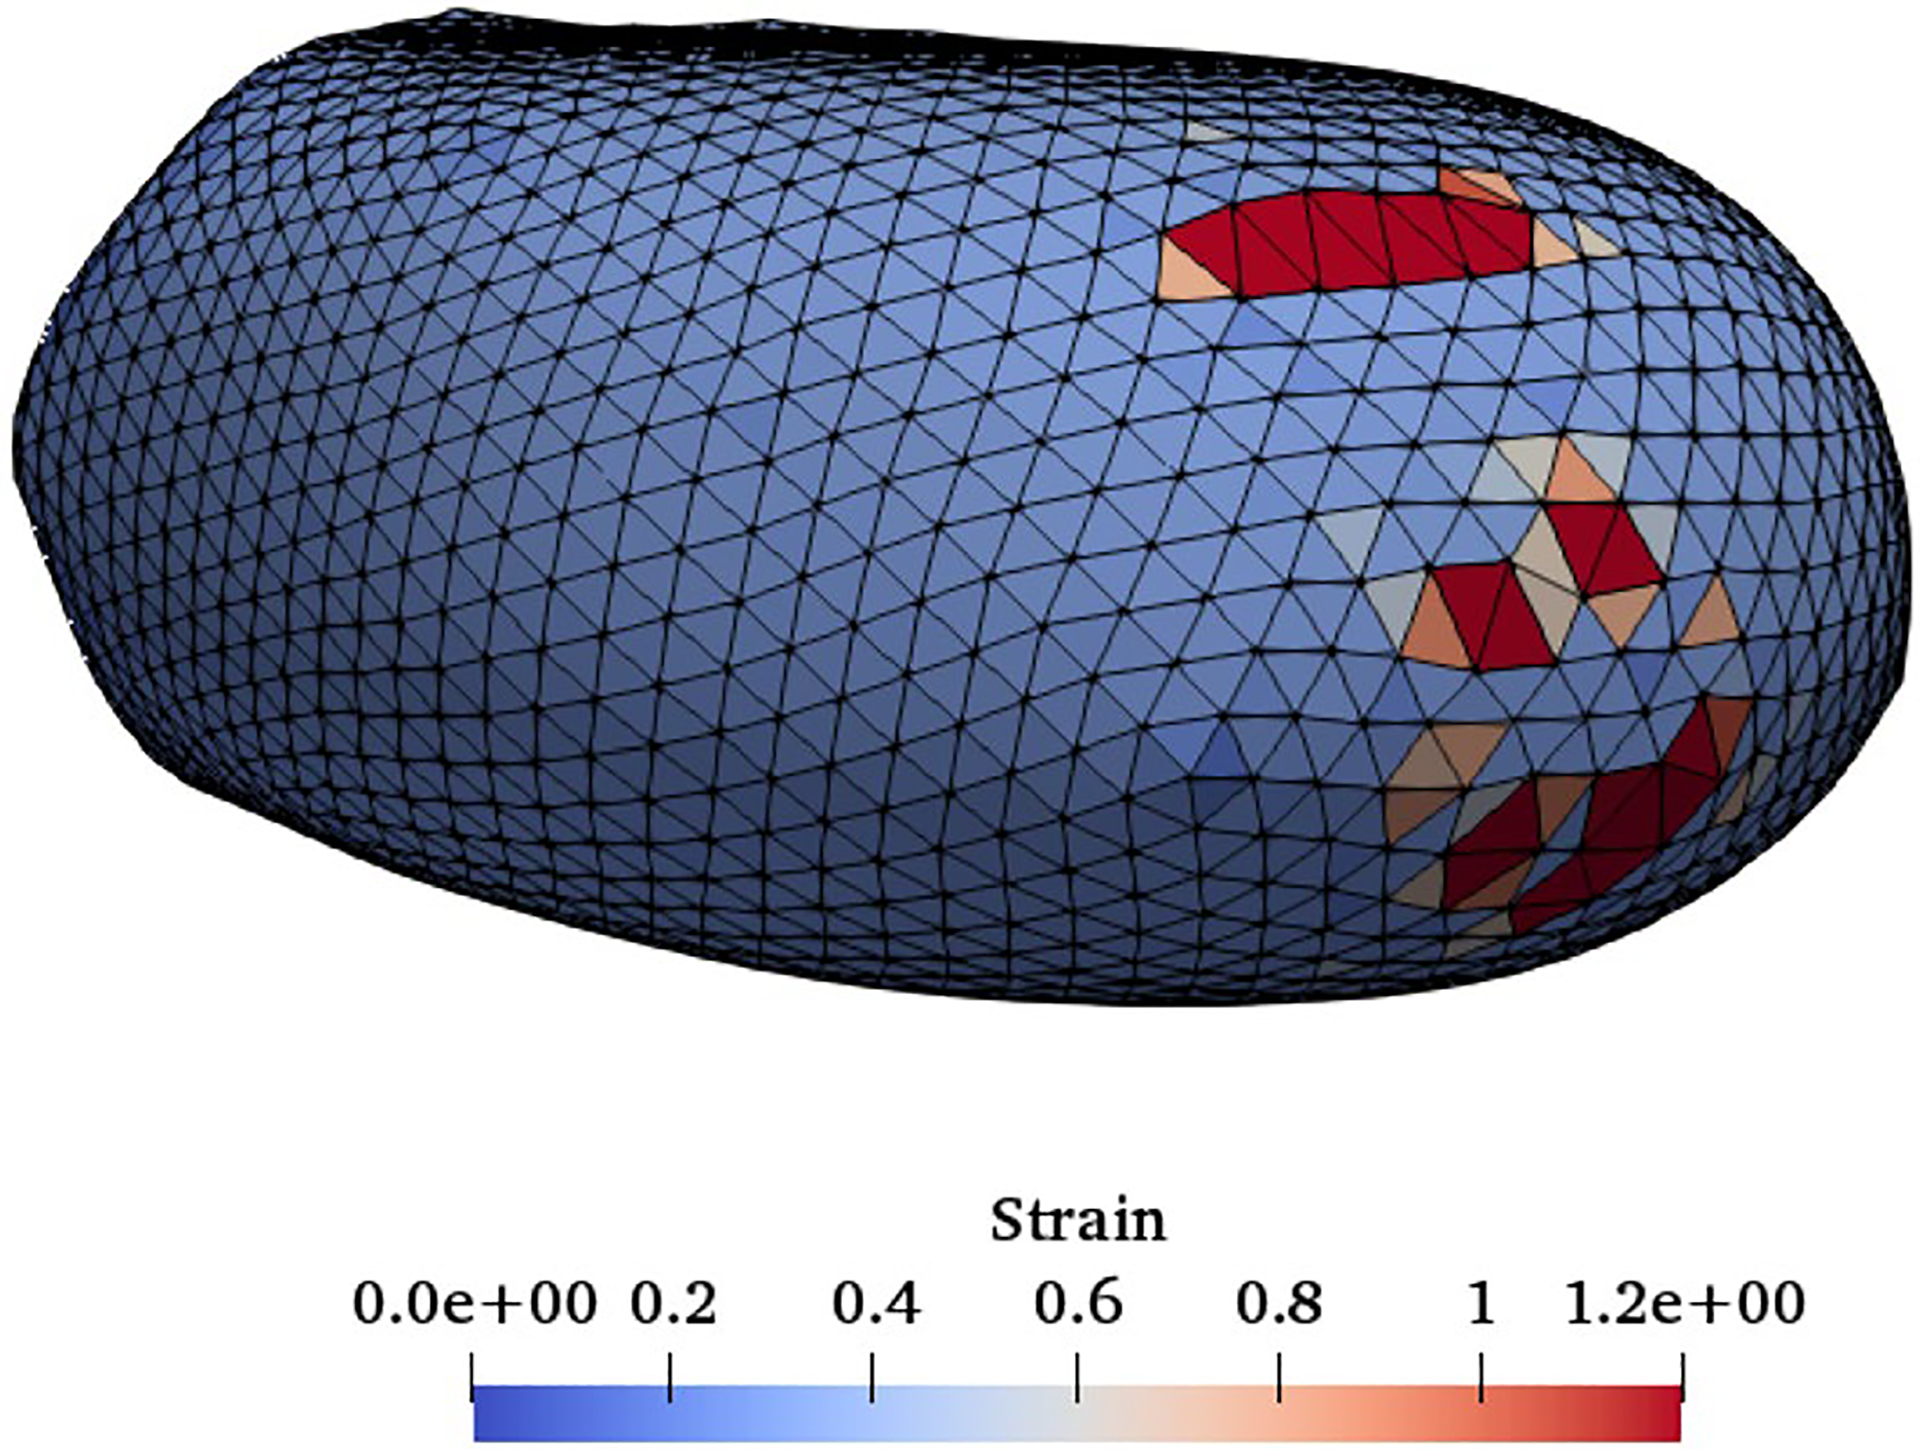
Front view of the strain distribution on the RBC at the rupture moment
3.5. Microfiltration
Having verified the FSI solver and damage model, here we apply our algorithm to assess the RBC damage during microfiltration. The geometry of the sieve is designed in accordance with Chien et al.’s study (1971). In their study, blood was obtained from healthy human subjects and then washed erythrocytes were suspended in 1 mm3 Ringer solution with concentration of 1.2 × 10⁵ to 1.8 × l05 cells/mm3. Mean pore diameters of the sieve pores varied between 2.2 μm and 4.4 μm. Furthermore, the average pore length was approximately 13 μm. In this experiment, the shear and device-induced hemolysis are quantified up to 74 cm Hg pressure gradient (Δp). To simulate the RBC deformation under these conditions and to simulate the problem at the cellular level, we consider only one pore of the sieve as depicted in Fig. 13. To relate the single RBC IH to the IH in the real device, we assume that all the RBCs in 1 mm3 solution (Chien et al. 1971) experience the same situation as the simulated RBC. Therefore, device IH is exactly the same as the single RBC.
Fig. 13.
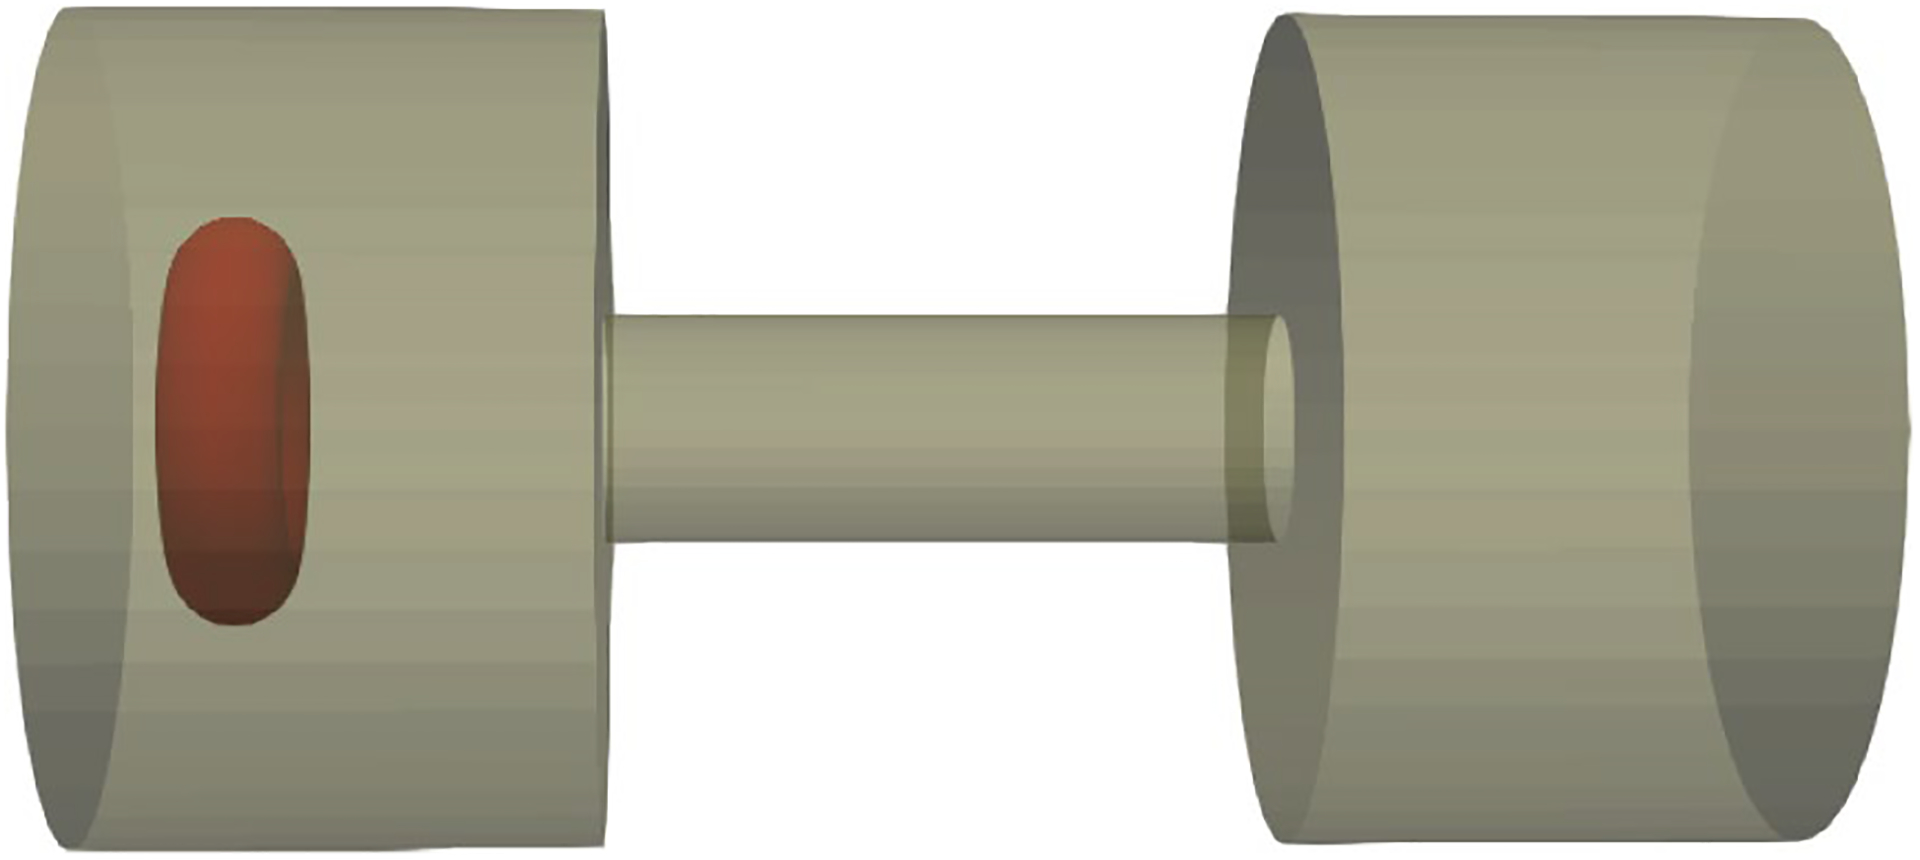
Modeling microfilteration at cellular scale
Figure 14 shows the RBC deformation at three different instances for Δp = 50 cm Hg during passage through a micropore with 2.2 μm. As the figure shows, the RBC is stretched as much as the length of the micropore and then it leaves the pore. Figure 15 shows the hemolysis index (IH) in the real device for different sieve pore diameters at different pressure gradients. To calculate the IH for a single RBC shown in Fig. 14, after finding the RBC deformation at each time step, the IH is calculated using Eqs. (11)–(13). As Fig. 15 shows, IH increases by increasing the filtration pressure and decreasing the sieve pore size. Also, Fig. 15 compares the hemolysis index obtained by numerical algorithm and Chien et al.’s study (1971). As the graph shows, our model predicts a plateau for the pore size of 2.2 above 25 cm Hg which means that our model predicts that above 25 cm Hg, the RBCs experiences rupture. Inconsistencies between numerical results and experimental data can be related to simplification in our sub-models. For instance, our damaged model is a correlation obtained from coarse-grained molecular dynamics (CGMD) for lipid membrane under equibiaxial stretching tests, while in the microfilter the RBCs experiences more complex loading conditions which are not necessarily equibiaxial. Also, we assumed that RBC nanopores are circular while they may not be always circular. Moreover, we related the Hb leakage from a single RBC to all RBCs in the device by assuming that all the RBCs in the solution experience the same conditions which is not a realistic assumption. Actually, the RBCs deformation depends on their location with respect to sieve pore. Also, in the real device, there are lots of the RBCs which will have distinct effects on each other’s motion and deformation.
Fig. 14.

RBC deformation during squeezing through one pore of the microfilter at three different instances for Δp = 50 cm Hg
Fig. 15.
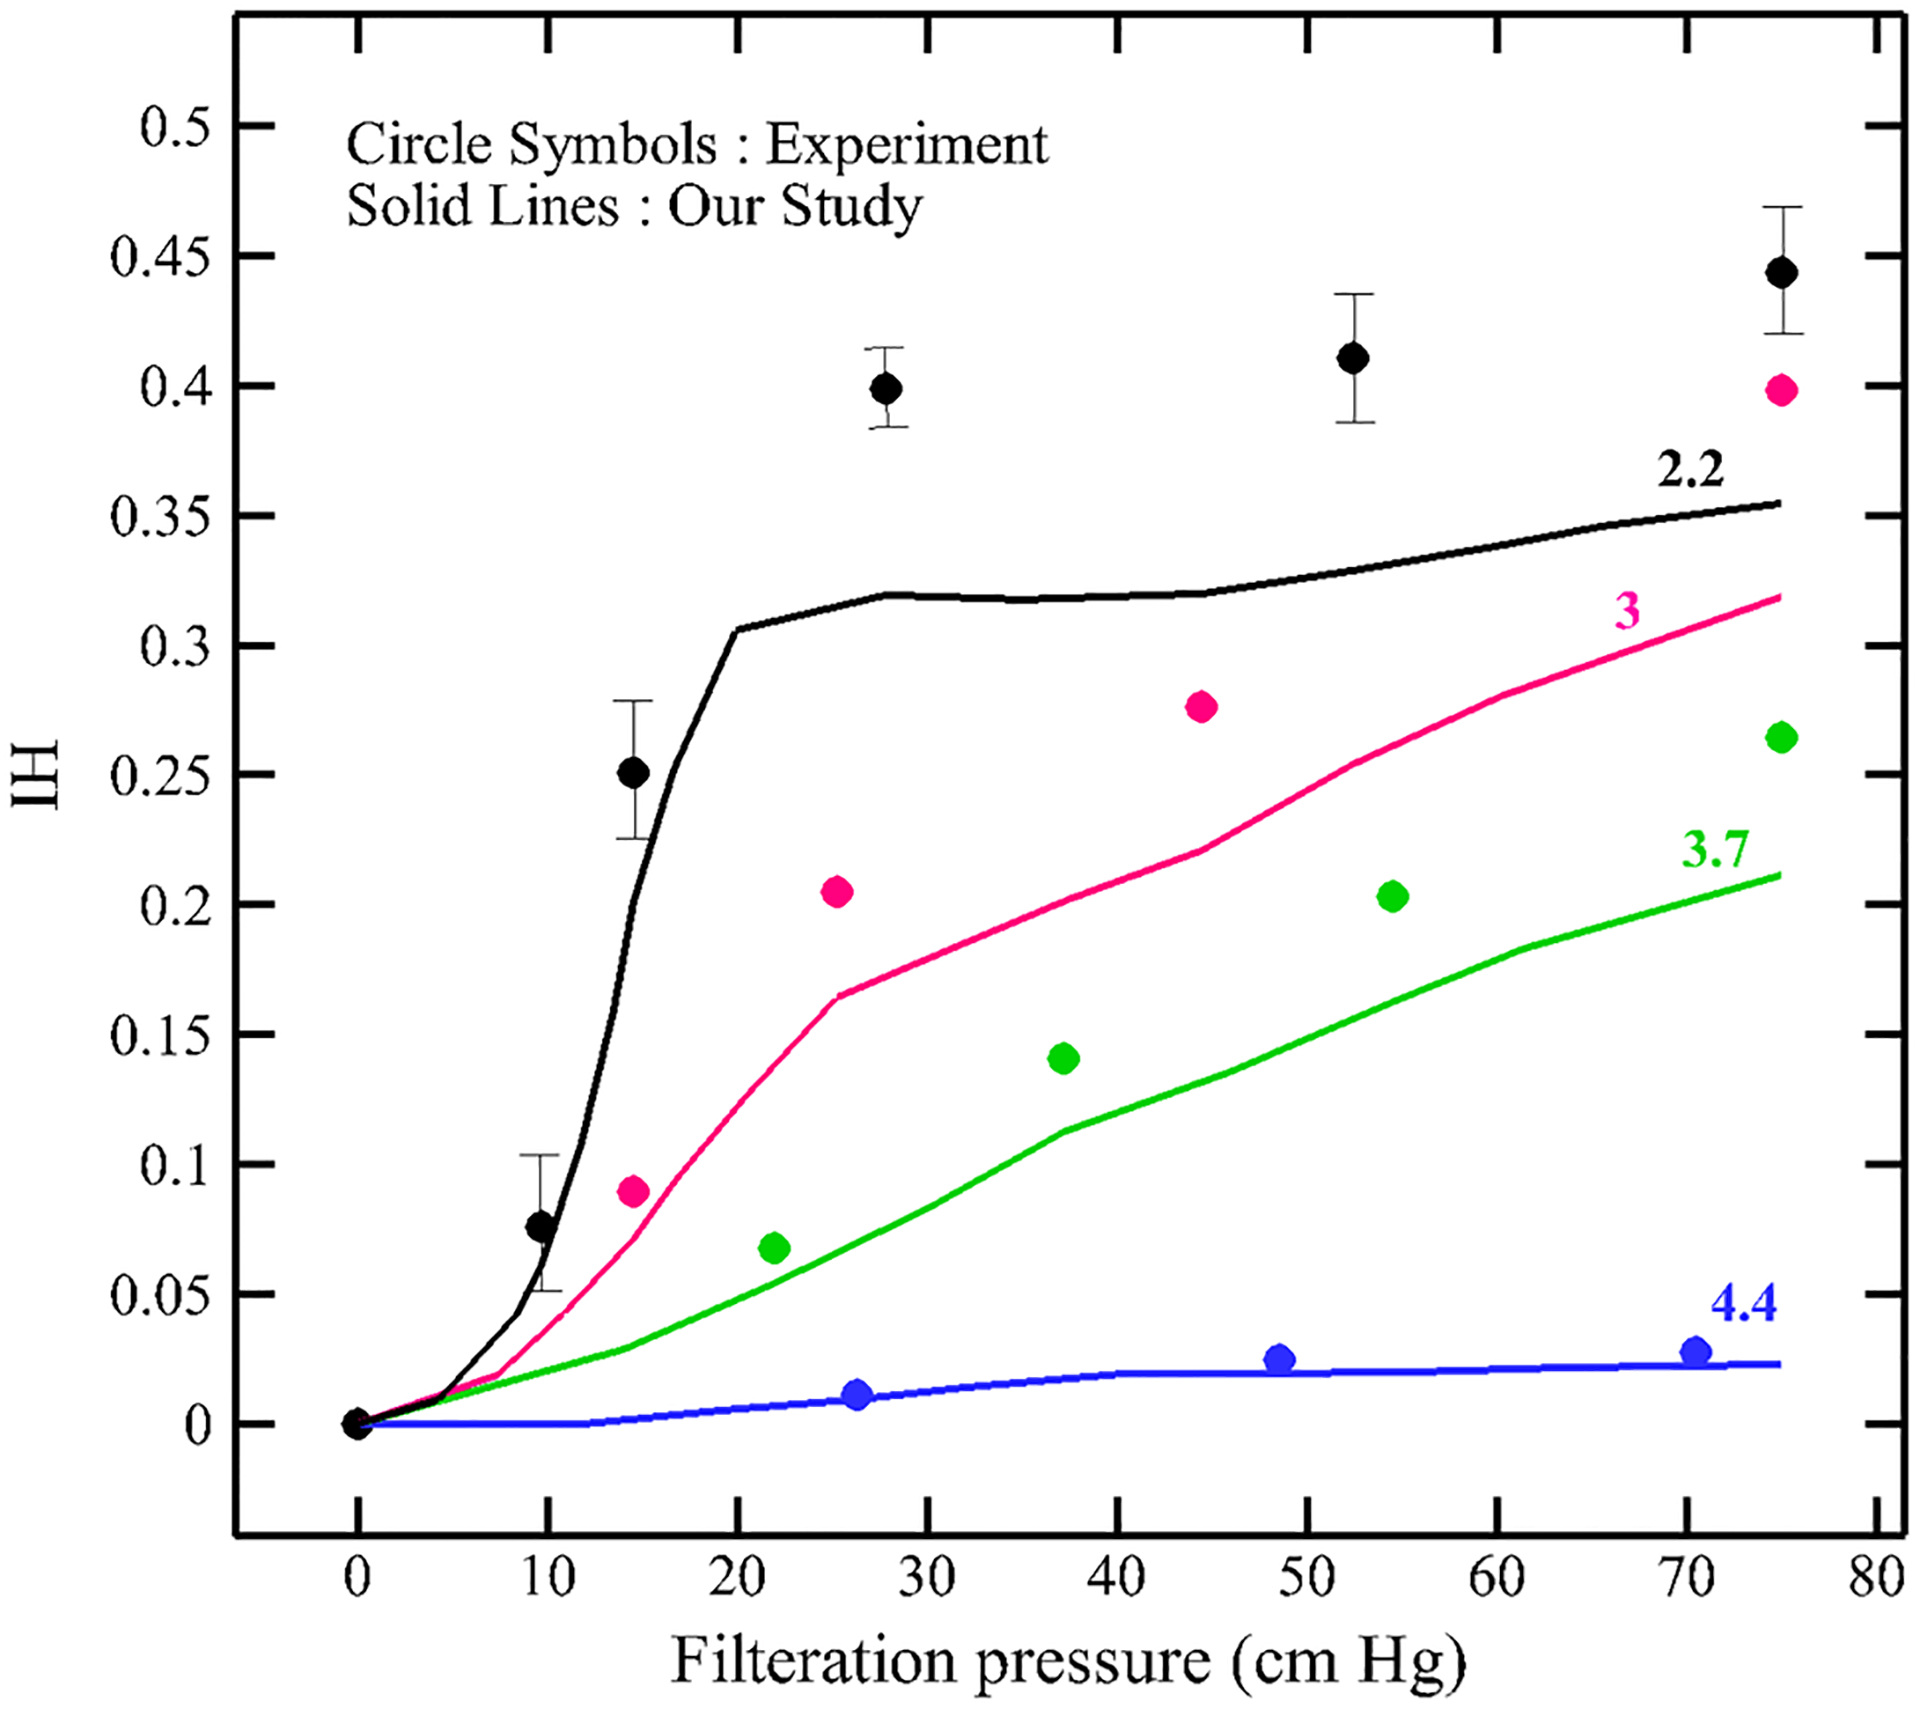
Effect of filtration pressure and sieve pore size on hemolysis index
4. Conclusion
We extended our previous strain-based model to predict hemolysis during microfiltration. In contrast to the existing hemolysis models, this model does not have any empirical parameters and it can produce reasonable results under different operating conditions. The proposed algorithm is used to model RBC sublytic damage leading to Hb release during passing through a sieve containing micropores with radius as small as 1/4 of the RBC large diameter. Hemolysis in this type of sieves is generated due to high deformation induced by combination of high shear rate and geometry device. The LBM is coupled with a SN model of the RBC using an IBM. For calculating the pore radius, we used the sub-cellular correlation from our previous paper on assessing hemolysis induced by pure high shear rates. For validating the numerical platform, different tests are examined. All the results align with the available data in the literature. The study is completed by analyzing the effects of filtration pressure and sieve pore size on the hemolysis Index. Similar to the corresponding experimental studies, our results show that the RBC transient damage increases with increasing filtration pressure and decreasing sieve pore size. However, the experiment is incapable of quantifying the RBC pore size due to rapid squeezing, so the proposed algorithm can quantify it. Therefore, it seems that our multiscale approach can be used as a tool for predicting hemolysis and optimizing the hematologic design of real biomedical devices. To achieve more accurate prediction, this model still needs further improvements to provide more interesting insight for hemolysis prediction in medical devices. For example, instead of using a simple damage model, a localized coarse-grained molecular dynamics (CGMD) model at the high stress region on the RBC can be concurrently linked with SN membrane model to characterize pore formation and growth as well as to study hemoglobin release. This project is currently being studied in our group.
Acknowledgements
This work was supported by National Institutes of Health (NIH) Grant number R01HL131750.
References
- Aaron N, Jacobson L (2015) Left ventricular assist device In: Jacobson L, Okuda Y, Godwin S (eds) SimWars simulation case book: emergency medicine. Cambridge University Press, Cambridge, pp 104–107. 10.1017/CBO9781107111011.026 [DOI] [Google Scholar]
- Abkarian M, Faivre M, Stone HA (2006) High-speed microfluidic differential manometer for cellular-scale hydrodynamics. Proc Natl Acad Sci 103(3):538–542 [DOI] [PMC free article] [PubMed] [Google Scholar]
- Abkarian M, Faivre M, Horton R, Smistrup K, Best-Popescu CA, Stone HA (2008) Cellular-scale hydrodynamics. Biomed Mater 3(3):34011–34013 [DOI] [PubMed] [Google Scholar]
- Al Jarallah AS, Duncan WJ, Broecker L, Allen L, Cornel G (1997) The Hemopump as a left ventricular assist device in pediatric applications: initial Canadian applications. Can J Cardiol 13(5):489–494 [PubMed] [Google Scholar]
- Arora D (2005) Computational hemodynamics: hemolysis and viscoelasticity. Rice University, Houston [Google Scholar]
- Arora D, Behr M, Pasquali M (2004) A tensor-based measure for estimating blood damage. Artif Organs 28(11):1002–1015 [DOI] [PubMed] [Google Scholar]
- Arora D, Behr M, Pasquali M (2006) Hemolysis estimation in a centrifugal blood pump using a tensor-based measure. Artif Organs 30(7):539–547 [DOI] [PubMed] [Google Scholar]
- Chen S, Doolen GD (1998) Lattice Boltzmann method for fluid flows. Annu Rev Fluid Mech 30(1):329–364 [Google Scholar]
- Chen Y, Sharp MK (2011) A strain-based flow-induced hemolysis prediction model calibrated by in vitro erythrocyte deformation measurements. Artif Organs 35(2):145–156 [DOI] [PubMed] [Google Scholar]
- Chien S, Luse SA, Bryant CA (1971) Hemolysis during filtration through micropores: a scanning electron microscopic and hemorheologic correlation. J Microvasc Res 3:183–203 [DOI] [PubMed] [Google Scholar]
- Davidson MG, Deen WM (1988) Hydrodynamic theory for the hindered transport of flexible macromolecules in porous membranes. J Memb Sci 35(2):167–192 [Google Scholar]
- Den Otter WK (2009) Free energies of stable and metastable pores in lipid membranes under tension. J Chem Phys 131(20):205101–205109 [DOI] [PubMed] [Google Scholar]
- Doster W, Longeville S (2007) Microscopic diffusion and hydrodynamic interactions of hemoglobin in red blood cells. Biophys J 93(4):1360–1368 [DOI] [PMC free article] [PubMed] [Google Scholar]
- Ezzeldin HM, de Tullio MD, Vanella M, Solares SD, Balaras E (2015) A strain-based model for mechanical hemolysis based on a coarse-grained red blood cell model. Ann Biomed Eng 43(6):1398–1409 [DOI] [PubMed] [Google Scholar]
- Faghih MM, Sharp MK (2019) Modeling and prediction of flow-induced hemolysis: a review. Biomech Model Mechanobiol 18(4):845–881 [DOI] [PubMed] [Google Scholar]
- Farinas M-I, Garon A, Lacasse D, N’dri D (2006) Asymptotically consistent numerical approximation of hemolysis. J Biomech Eng 128(5):688. [DOI] [PubMed] [Google Scholar]
- FDA (2013) Critical path Computational fluid dynamics (CFD)/blood damage project. Fda [Google Scholar]
- Giersiepen M, Wurzinger LJ, Opitz R, Reul H (1990) Estimation of shear stress-related blood damage in heart valve prostheses-in vitro comparison of 25 aortic valves. Int J Artif Organs 13(5):300–306 [PubMed] [Google Scholar]
- Grigioni M, Morbiducci U, D’Avenio G, Di Benedetto G, Del Gaudio C (2005) A novel formulation for blood trauma prediction by a modified power-law mathematical model. Biomech Model Mechanobiol 4(4):249–260 [DOI] [PubMed] [Google Scholar]
- Heuser G, Opitz R (2017) A Couette viscometer for short time shearing of blood. Biorheology 17(1–2):17–24 [DOI] [PubMed] [Google Scholar]
- Hung TC et al. (1991) Effects of long-term Novacor artificial heart support on blood rheology. ASAIO Trans 37(3):M312–M313 [PubMed] [Google Scholar]
- Kormos RL, Borovetz HS, Griffith BP, Hung TC (1987) Rheologic abnormalities in patients with the Jarvik-7 total artificial heart. ASAIO Trans 33(3):413–417 [PubMed] [Google Scholar]
- Koshiyama K, Wada S (2011) Molecular dynamics simulations of pore formation dynamics during the rupture process of a phospholipid bilayer caused by high-speed equibiaxial stretching. J Biomech 44(11):2053–2058 [DOI] [PubMed] [Google Scholar]
- Leontiadou H, Mark AE, Marrink SJ (2004) Molecular dynamics simulations of hydrophilic pores in lipid bilayers. Biophys J 86(4):2156–2164 [DOI] [PMC free article] [PubMed] [Google Scholar]
- Liu WK et al. (2006) Immersed finite element method and its applications to biological systems. Comput Methods Appl Mech Eng 195(13–16):1722–1749 [DOI] [PMC free article] [PubMed] [Google Scholar]
- Long CC, Marsden AL, Bazilevs Y (2014) Shape optimization of pulsatile ventricular assist devices using FSI to minimize thrombotic risk. Comput Mech 54(4):921–932 [Google Scholar]
- Mills JP, Qie L, Dao M, Lim CT, Suresh S (2004) Nonlinear elastic and viscoelastic deformation of the human red blood cell with optical tweezers. Mech Chem Biosyst 1(3):169–180 [PubMed] [Google Scholar]
- Pauli L, Nam J, Pasquali M, Behr M (2013) Transient stress-based and strain-based hemolysis estimation in a simplified blood pump. Int j Numer Method Biomed Eng 29(10):1148–1160 [DOI] [PMC free article] [PubMed] [Google Scholar]
- Quinn DJ et al. (2011) Combined simulation and experimental study of large deformation of red blood cells in microfluidic systems. Ann Biomed Eng 39(3):1041–1050 [DOI] [PMC free article] [PubMed] [Google Scholar]
- Rother RP, Bell L, Hillmen P, Gladwin MT (2005) The clinical sequelae of intravascular hemolysis and extracellular plasma hemoglobin: a novel mechanism of human disease. J Am Med Assoc 293(13):1653–1662 [DOI] [PubMed] [Google Scholar]
- Sohrabi S, Liu Y (2017) A cellular model of shear-induced hemolysis. Artif Organs 41(9):80–91 [DOI] [PMC free article] [PubMed] [Google Scholar]
- Sohrabi S, Zheng J, Finol EA, Liu Y (2014) Numerical simulation of particle transport and deposition in the pulmonary vasculature. J Biomech Eng 136(12):121010. [DOI] [PMC free article] [PubMed] [Google Scholar]
- Succi S (2001) The lattice Boltzmann equation for fluid dynamics and beyond. Oxford University Press, Oxford [Google Scholar]
- Tan J, Thomas A, Liu Y (2012) Influence of red blood cells on nanoparticle targeted delivery in microcirculation. Soft Matter 8(6):1934–1946 [DOI] [PMC free article] [PubMed] [Google Scholar]
- Tan J, Shah S, Thomas A, Ou-Yang HD, Liu Y (2013a) The influence of size, shape and vessel geometry on nanoparticle distribution. Microfluid Nanofluidics 232(3):502–514 [DOI] [PMC free article] [PubMed] [Google Scholar]
- Tan J, Wang S, Yang J, Liu Y (2013b) Coupled particulate and continuum model for nanoparticle targeted delivery. Comput Struct 122:128–134 [DOI] [PMC free article] [PubMed] [Google Scholar]
- Tan J, Keller W, Sohrabi S, Yang J, Liu Y (2016) Characterization of nanoparticle dispersion in red blood cell suspension by the lattice boltzmann-immersed boundary method. Nanomaterials 6(2):1–14 [DOI] [PMC free article] [PubMed] [Google Scholar]
- Tan J, Sohrabi S, He R, Liu Y (2018) Numerical simulation of cell squeezing through a micropore by the immersed boundary method. Proc Inst Mech Eng Part C J Mech Eng Sci 232(3):502–514 [DOI] [PMC free article] [PubMed] [Google Scholar]
- Taskin ME, Fraser KH, Zhang T, Wu C, Griffith BP, Wu ZJ (2012) Evaluation of Eulerian and Lagrangian models for hemolysis estimation. ASAIO J 58(4):363–372 [DOI] [PubMed] [Google Scholar]
- Tolpekina TV, Den Otter WK, Briels WJ (2004) Simulations of stable pores in membranes: System size dependence and line tension. J Chem Phys 121(10):154701–154905 [DOI] [PubMed] [Google Scholar]
- Tomasini MD, Rinaldi C, Tomassone MS (2010) Molecular dynamics simulations of rupture in lipid bilayers. Exp Biol Med 235(2):181–188 [DOI] [PubMed] [Google Scholar]
- Vitale F et al. (2014) A multiscale, biophysical model of flow-induced red blood cell damage. AIChE J 60(4):1509–1516 [Google Scholar]
- Wood HG, Throckmorton AL, Untaroiu A, Song X (2005) The medical physics of ventricular assist devices. Rep Prog Phys 68(3):545–576 [Google Scholar]
- Wu J, Yun BM, Fallon AM, Hanson SR, Aidun CK, Yoganathan AP (2011) Numerical investigation of the effects of channel geometry on Platelet activation and blood damage. Ann Biomed Eng 39(2):897–910 [DOI] [PMC free article] [PubMed] [Google Scholar]
- Yao W et al. (2001) Low viscosity Ektacytometry and its validation tested by flow chamber. J Biomech 34(11):1501–1509 [DOI] [PubMed] [Google Scholar]
- Yeleswarapu KK, Antaki JF, Kameneva MV, Rajagopal KR (1995) A mathematical model for shear-induced hemolysis. Artif Organs 19(7):576–582 [DOI] [PubMed] [Google Scholar]
- Yu H, Engel S, Janiga G, Thévenin D (2017) A review of hemolysis prediction models for computational fluid dynamics. Artif Organs 41(7):603–621 [DOI] [PubMed] [Google Scholar]
- Závodszky G, van Rooij B, Azizi V, Hoekstra A (2017) Cellular level in-silico modeling of blood rheology with an improved material model for red blood cells. Front Physiol 8:563. [DOI] [PMC free article] [PubMed] [Google Scholar]
- Zhang T et al. (2012) Study of flow-induced hemolysis using novel couette-type blood-shearing devices. Artif Organs 35(12):1180–1186 [DOI] [PubMed] [Google Scholar]
- Zou Q, He X (1997) On pressure and velocity boundary conditions for the lattice Boltzmann BGK model. Phys Fluids 9(6):1591–1598 [Google Scholar]


