Abstract
Bronchial thermoplasty induces atrophy of the airway smooth muscle layer, but the mechanism whereby this improves patient health is unclear. In this study, we use computed tomography (CT) to evaluate the effects of bronchial thermoplasty on airway volume 12 months post-procedure.
10 consecutive patients with severe asthma were evaluated at baseline by the Asthma Control Questionnaire (ACQ), and high-resolution CT at total lung capacity (TLC) and functional residual capacity (FRC). The CT protocol was repeated 4 weeks after the left lung had been treated by bronchial thermoplasty, but prior to right lung treatment, and then again 12 months after both lungs were treated. The CT data were also used to model the implications of including the right middle lobe (RML) in the treatment field.
The mean patient age was 62.7±7.7 years and forced expiratory volume in 1 s (FEV1) 42.9±11.5% predicted. 12 months post-bronchial-thermoplasty, the ACQ improved, from 3.4±1.0 to 1.5±0.9 (p=0.001), as did the frequency of oral steroid-requiring exacerbations (p=0.008).
The total airway volume increased 12 months after bronchial thermoplasty in both the TLC (p=0.03) and the FRC scans (p=0.02). No change in airway volume was observed in the untreated central airways. In the bronchial thermoplasty-treated distal airways, increases in airway volume of 38.4±31.8% at TLC (p=0.03) and 30.0±24.8% at FRC (p=0.01) were observed. The change in distal airway volume was correlated with the improvement in ACQ (r=−0.71, p=0.02). Modelling outputs demonstrated that treating the RML conferred no additional benefit.
Bronchial thermoplasty induces long-term increases in airway volume, which correlate with symptomatic improvement.
Short abstract
CT scanning was used to evaluate patients undergoing bronchial thermoplasty. CT demonstrated that treatment increased airway volume, and this persisted for 12 months and correlated with improved symptoms. https://bit.ly/350YNBD
Introduction
Hypertrophy of the airway smooth muscle layer is one of the cardinal features of severe asthma [1]. Bronchial thermoplasty damages this layer using radiofrequency energy, and histological studies demonstrate resultant smooth muscle atrophy [2, 3]. There has been uncertainty, however, regarding how these changes produce the clinical benefits observed after bronchial thermoplasty, which include improved symptoms, fewer exacerbations and reduced medication requirement [4–8]. In particular, studies of spirometry after bronchial thermoplasty have shown either no change or small improvements in the forced expiratory volume in 1 s (FEV1) [4–8]. The scenario in which bronchial thermoplasty improves patient health without clear physiological change has been labelled a clinical paradox [9].
Evidence of physiological improvement after bronchial thermoplasty is now emerging. Plethysmograph studies show a reduction in gas trapping after bronchial thermoplasty, and magnetic resonance imaging (MRI) studies suggest that poorly ventilated regions of the lung are recruited after bronchial thermoplasty [10–12]. It is likely that reversal of these ventilation defects is driven by direct dilation of conducting airways. We have previously used computed tomography (CT) to evaluate airway volume and have demonstrated an increase in airway volume 4 weeks after bronchial thermoplasty [13]. This correlated with a reduction in symptoms and an improvement in airway resistance [14]. A similar increase in airway volume after bronchial thermoplasty was predicted by our mathematical model of lung function [15].
The reduction in airway smooth muscle mass has been shown to persist for 12 months post-bronchial thermoplasty [3]. We therefore hypothesise that increases in airway volume will also persist long term. In this study we use CT to evaluate the effects of bronchial thermoplasty on airway volume 12 months post-procedure. Secondly, whilst the right middle lobe (RML) is not usually treated during bronchial thermoplasty owing to concerns about inducing airway stenosis, extension of bronchial thermoplasty to the RML has been recently suggested to be feasible and potentially effective [16, 17]. Therefore, we have used our CT tools and our mathematical model to evaluate the potential additional benefit of treating the RML [9, 15].
Methods
Participants
Participants were drawn from a tertiary hospital severe asthma clinic. To be considered for bronchial thermoplasty, patients needed to be using inhaled triple therapy and have poorly controlled symptoms with frequent oral steroid requiring exacerbations. All participants had been thoroughly evaluated and met the European Respiratory Society/American Thoracic Society (ERS/ATS) definition of severe asthma [18]. Alternative respiratory conditions such as COPD or bronchiectasis had been excluded. Each patient had been previously evaluated for treatment with monoclonal antibody therapy.
Ethics approval and consent to participate
This study was prospectively approved by the Peninsula Health Human Research Ethics Committee. All patients provided written, informed consent prior to participation.
Setting and procedure
The centre had 5 years of experience in performing bronchial thermoplasty. All procedures were conducted under general anaesthesia with patients routinely observed in hospital overnight post-procedure. For the purposes of this study, the scheduling of the bronchial thermoplasty procedures was altered in a novel way in order to achieve one treated lung (left side) and one untreated lung (right side). The left lower lobe was treated in the first bronchial thermoplasty session, and then the left upper lobe in the second session. Imaging studies were conducted at baseline, and then again 4 weeks after completion of bronchial thermoplasty treatment to the left lung, and prior to treatment of the right lung (which acted as a control). Following the second set of imaging, the right lower and upper lobes were treated together in the final bronchial thermoplasty session. Imaging studies were then repeated 12 months after completion of all bronchial thermoplasty procedures. A timeline illustrating treatments and assessments is presented in figure 1.
FIGURE 1.
Timeline of treatments and assessments. BT: bronchial thermoplasty; CT: computed tomography; ACQ: Asthma Control Questionnaire; RX: bronchial thermoplasty.
Imaging studies
Non-contrast CT scanning was performed on a 128-slice Siemens Definition AS+ scanner with a helical slice thickness of 0.6 mm, rotation time of 0.6 s, detector coverage of 38.4 mm, and tube voltage of 100 kV, consistent with the previously published technique for functional respiratory imaging [19]. A typical scan was completed in <5 s. Two breath-hold scans were performed on each occasion – one at full inspiration (total lung capacity (TLC)), and the other at functional residual capacity (FRC). Immediately prior to the CT scan, the patient was coached in the manoeuvres required for the breath-hold, and a member of the research team was present during the scan, observing the patient from the control room and providing instruction. All imaging was performed in a stable state, pre-bronchodilator, and prior to peri-procedural oral steroid administration. The average estimated radiation exposure for each CT scanning session (comprising two scans) was 4.6 mSv. As part of the baseline scanning, an emphysema score was determined using the TLC scan and counting the percentage of intrapulmonary voxels with a density of −1024 to −950 HU.
Post-acquisition, CT images were analysed independently by FLUIDDA (Kontich, Belgium) and blinded to the findings in any previous scans. The high-resolution images were imported into Mimics, a commercial medical imaging processing software package (Materialise, Leuven, Belgium), which converted the CT images into patient-specific, 3D computer models of the lung lobes and the airway dimensions. Subsequent analysis was then performed by FLUIDDA, who reported lobar volume and airway volume for each lobe of each lung. The airways were partitioned into two compartments, namely: (1) the airways distal to the lobar orifice down to 1.5 mm in size, which are potentially treatable by bronchial thermoplasty – labelled the distal airways; and (2) the central airways, proximal to the lobar orifice, which are not treated by bronchial thermoplasty.
Clinical measurements
The following data were recorded for all patients: age, gender, weight, height, asthma medication usage, asthma exacerbation history, lung function parameters and the 5-item Asthma Control Questionnaire (ACQ) [20]. Written permission to use the ACQ was provided by its author, Elizabeth Juniper. Key clinical outcome parameters included changes measured at 6 and 12 months in: 1) ACQ; 2) pre-bronchodilator FEV1; 3) Short-acting β-agonist (SABA) usage (measured in puffs/day); 4) daily maintenance oral corticosteroid (OCS) dose (measured in mg·day-1 of prednisolone); and 5) the number of oral steroid-requiring exacerbations of asthma reported in the previous 6 months. Patient assessments were performed by experienced clinical research nursing and scientific staff and were conducted independently of the procedural team. Spirometry was performed using the Jaegar Masterscreen Body (Carefusion, Hochberg, Germany), and tests were conducted in the morning, having withheld bronchodilators since the previous evening. The laboratory equipment was calibrated on the morning of testing, and all tests were conducted to ERS/ATS standards [21]. The diffusing capacity of the lung for carbon monoxide (DLCO) was also tested, and at least two acceptable manoeuvres within 3 mL·min−1·mmHg−1 of each other were required. The predicted value equations used were taken from the Global Lung Initiative [22].
Modelling
We adapted a previously developed mathematical model of bronchial thermoplasty to consider the potential role of RML treatment [9]. The airway tree structure is generated using a statistical model fitted to extensive structural airway data. This dataset consists of 675 individual airways from n=25 fatal asthma lung donors. The measurements of these airways, in terms of epithelial basement membrane perimeter, airway wall area, airway smooth muscle area and anatomical level, are used to inform a statistical model of airway structure at each airway order, as analysed previously [9]. Within this airway tree structure, we calculate volume, flow and impedance (including resistance) within intra-parenchymal airways. Twenty independent simulations are then performed, at varying doses of contractile agonist, and the response in airway volume and resistance determined. The simulations are then repeated with a 75% reduction in airway smooth muscle mass, which has been demonstrated to approximate the effects of bronchial thermoplasty [23]. Bronchial thermoplasty simulations are first performed with airways normally treated by bronchial thermoplasty, and then repeated to evaluate the effect of extending bronchial thermoplasty to the RML.
Ethics
Prospective approval to undertake this study was provided by the Peninsula Health Human Research Ethics Committee and no patient was enrolled without having given informed consent.
Statistical analysis
SPSS version 25 (IBM corporation, Armonk, NY, USA) was used for all statistical analyses. Normally distributed data are reported as mean±sd, and analysis of variance was used to compare repeated measures. Non-parametric data are reported as median (interquartile range) and Friedman's test was used to compare repeated data. Statistical significance was taken at p<0.05.
Results
Baseline characteristics
Ten consecutive patients (seven female, three male) aged 62.2±7.7 years consented to participate. The mean ACQ score was 3.4±1.0. All patients were using triple inhaler therapy, mean beclomethasone equivalent inhaled steroid dose 1500±850 µg·day−1. Eight of 10 patients were treated with maintenance OCS. All 10 patients had previously been evaluated for monoclonal antibody therapy. Six did not meet Australian funding guidelines (e.g. low eosinophil count), three had previously been treated with a biological agent which had subsequently been ceased because of lack of effect, and one patient continued to have severe poorly controlled asthma despite 12 months continuing therapy with mepolizumab. The average daily requirement for SABA therapy was 11 (18.5) puffs per day. The average frequency of OCS requiring exacerbations in the 6 months prior to bronchial thermoplasty was 2 (2). The mean pre-bronchodilator FEV1 was 42.9±11.5% predicted, with an average improvement of 9.6±9.2% after salbutamol. The mean vital capacity was 72.1±12.8% predicted, and the forced expiratory ratio was 47.4±10.7%. Amongst the group, there were five never-smokers, and five ex-smokers. The mean DLCO per unit lung volume was 83.3±32.7% predicted, and the mean CT emphysema score, measured at −950 HU, was 3.3±5.0%.
Clinical response to bronchial thermoplasty
An average of 117±21 radiofrequency activations were delivered to the left lung, 82±23 to the right lung and 199±41 in total. Patients' symptoms improved as bronchial thermoplasty was progressively deployed, from an ACQ score of 3.4±1.0 at baseline, to 2.1±0.9 with only the left lung treated, and then 1.4±1.0 6 weeks after both lungs were treated (p=0.001). Thereafter the ACQ remained stable to the 12 months assessment (table 1). The overall improvement in ACQ was substantive at more than three times the minimal clinically significant change [24].
TABLE 1.
Clinical response to bronchial thermoplasty
| Parameter | Baseline | 6 months post-procedure | 12 months post-procedure | p-value |
| ACQ score | 3.4±1.0 | 1.8±0.9 | 1.5±0.9 | 0.001 |
| FEV1 % pred | 42.9±11.5 | 46.8±5.8 | 48.2±13.3 | 0.350 |
| SABA puffs per day | 11.0 (18.5) | 3.25 (7.75) | 2.5 (6.25) | 0.080 |
| OCS mg·day−1 | 5.0 (6.75) | 0 (3.75) | 0 (6.25) | 0.005 |
| Exacerbations per 6 months | 2.0 (2) | 0 (1.25) | 0 (1.0) | 0.008 |
Data are presented as mean±sd or median (interquartile range), unless otherwise stated. ACQ: Asthma Control Questionnaire; FEV1: forced expiratory volume in 1 s; SABA: short-acting β-agonist; OCS: oral corticosteroid (prednisolone). p: analysis of variance or Friedman's test. All p-values are significant between baseline and 6 months and not thereafter.
Significant improvements were also observed in the frequency of oral corticosteroid-treated exacerbations (p=0.008) and in the requirement for maintenance OCS (p=0.005) (table 1). Five of eight patients taking maintenance OCS were weaned completely from steroids at 12 months. There were trends towards reduction in requirement for SABA and improvement in FEV1; neither reached statistical significance.
Imaging results
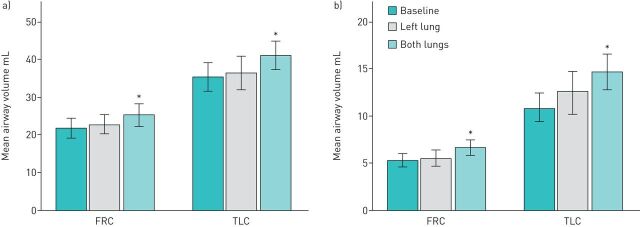
The total volume of air within the airways was measured at both TLC and FRC at each of the three assessments, namely baseline, one lung treated and 12 months after both lungs were treated. The results are shown graphically in figure 2a. A progressive increase in airway volume is observed. At TLC, the total airway volume increased from 35.4±11.9 mL at baseline to 41.2±11.9 mL at 12 months (p=0.03), representing an increase of 18.6±19.5% on baseline values. At FRC, the total airway volume increased from 21.8±8.6 mL to 25.3±9.4 mL (p=0.02), representing an increase of 18.3±13.5%.
FIGURE 2.
Changes in total airway volume (a) and distal airway volume (b) compared across three examinations. FRC: functional residual capacity; TLC: total lung capacity. *: p<0.05.
The airways were partitioned into the central component, the trachea and major bronchi, which were not treated by bronchial thermoplasty, whilst the remaining airways, which were potentially treated by bronchial thermoplasty, were labelled distal airways. There were no significant changes in central airway volume after bronchial thermoplasty in either the TLC or FRC scans. On the other hand, the distal airways increased substantially in volume by 38.4±31.8% at TLC (p=0.03) and 30.0±24.8% at FRC (p=0.01) (figure 3b). Thus, the increase in total airway volume after bronchial thermoplasty resulted from an increase in volume in the distal airways.
FIGURE 3.
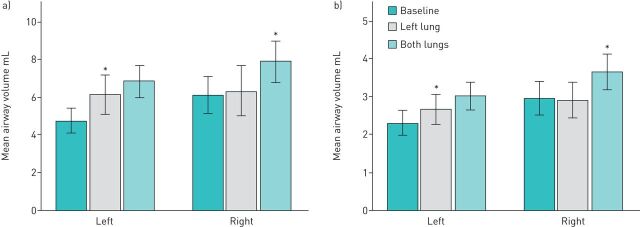
The effect of bronchial thermoplasty on airway volume for right and left lungs at total lung capacity (a) and functional residual capacity (b). *: p<0.05.
The increase in airway volume was not due to an increase in total lung volume. At TLC, the total lung volume measured by CT scanning was 4.91±1.55 L at baseline and at 12 months was 4.98±1.25 L. At FRC, the total lung volume at baseline was 3.63±1.12 L and at 12 months was 3.50±1.15 L (p=0.6).
The effect of bronchial thermoplasty on the individual lungs was then examined (figure 3). This was performed to demonstrate the time course of the changes in airway volume. On the right side, over the period of time when the right lung was not treated, no changes were observed between the baseline and mid-treatment scans (p=1.00 at both TLC and FRC). The improvement on the right side was not observed until the final scan (p=0.03 for both TLC and FRC scans). On the left side, significant increases in distal airway volume were observed 4 weeks after bronchial thermoplasty (at TLC: p=0.022, at FRC: p=0.004). However, a further increase was evident 12 months later, suggesting the effects of bronchial thermoplasty were not yet fully established 4 weeks after treatment of the left lung.
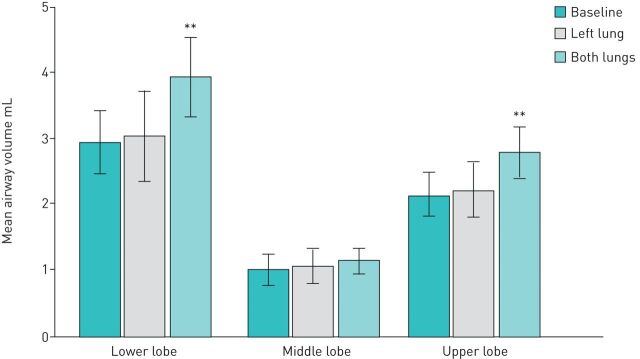
The effects of bronchial thermoplasty were also examined on the individual lobes of the right lung at TLC (figure 4). No changes were observed in the distal airway volume in the untreated RML. The right upper lobe distal airway volume was 2.15±1.07 mL at baseline, 2.23±1.34 mL after the left lung was treated (not significant) and 2.79±1.19 mL after bronchial thermoplasty to the right lung (p=0.01). The right lower lobe distal airway volume measured 2.95±1.52 mL at baseline, 3.05±2.16 mL after left lung treatment (not significant) and 3.94±1.94 mL 12 months after bronchial thermoplasty (p=0.01).
FIGURE 4.
Changes in distal airway volume in the three lobes of the right lung at three time points. **: p=0.01.
Correlation between change in distal airway volume and change in symptoms
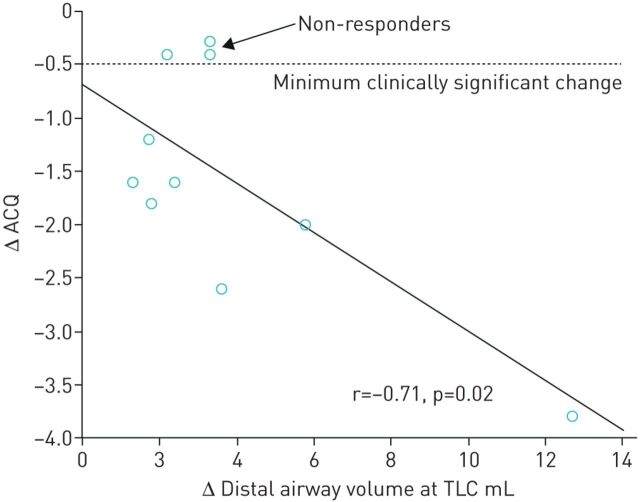
The potential relationship between the change in distal airway volume and the change in symptoms, as assessed by ACQ score, from baseline to 12 months after bronchial thermoplasty, was explored using Pearson correlation (figure 5). The negative slope in this relationship is apparent, with r=−0.71 (p=0.02), suggesting the greater the increase in distal airway volume after bronchial thermoplasty, the greater the improvement in patient symptoms.
FIGURE 5.
Change in distal airway volume after bronchial thermoplasty versus change in Asthma Control Questionnaire (ACQ). TLC: total lung capacity.
Modelling the potential effect of RML treatment
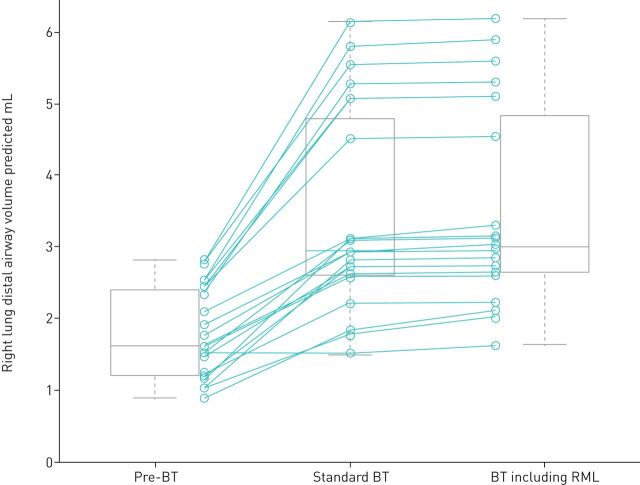
Using the mathematical model described, the volume of air in the distal airways of the right lung at baseline was calculated and is displayed in figure 6. The effects on distal airway volume of 20 simulations of standard bronchial thermoplasty (RML excluded) are then shown. Distal airway volume is seen to increase in the same fashion as was observed in the in vivo CT studies. A second set of simulations was then performed with the addition of treatment to the RML in the treatment field (figure 6). However, no further increase in airway volume was apparent in the second set of simulations.
FIGURE 6.
Changes in simulated airway volume comparing efficacy of standard bronchial thermoplasty (BT) with bronchial thermoplasty including right middle lobe (RML) treatment. Simulated distal airway volumes in the right lung from the mathematical model comparing the efficacy of standard bronchial thermoplasty with bronchial thermoplasty that also includes RML treatment, for a fatal asthma population.
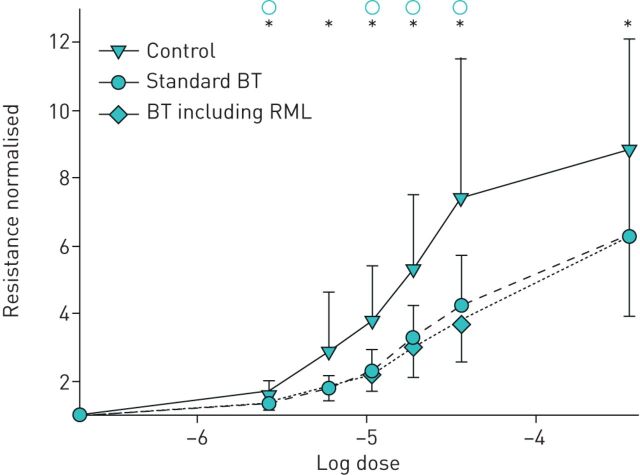
This analysis was extended by constructing dose–response curves (resistance) during a simulated bronchial challenge. Using this approach, a dose–response curve can be described for (1) subjects with asthma prior to treatment, (2) asthmatics after standard bronchial thermoplasty and (3) asthmatics after extended bronchial thermoplasty including RML treatment. Figure 7 shows that bronchial thermoplasty shifts the dose–response curve such that, for any given agonist contractile stimulation, there is significantly less airway resistance. However, the dose–response curves are effectively identical whether RML is included or excluded from bronchial thermoplasty.
FIGURE 7.
Simulated dose–response curves comparing efficacy of standard bronchial thermoplasty (BT) with bronchial thermoplasty including right middle lobe (RML) treatment. Simulated dose–response curves from the mathematical model comparing efficacy of standard bronchial thermoplasty with bronchial thermoplasty that also includes RML treatment, for a fatal asthma population. Resistance is normalised to a reference value for clarity of comparison (zero dose for each simulation). Error bars are standard error. * and ○ indicate statistical significance at p<0.05 by paired t-test for untreated versus standard bronchial thermoplasty and bronchial thermoplasty including RML, respectively.
Discussion
In this study we show that bronchial thermoplasty causes airway dilatation in the airways treated and that the effects persist for 12 months post-procedure. The findings agree with the observations made in a larger group of 18 patients studied 4 weeks after bronchial thermoplasty to one lung only [13]. Furthermore, the changes mirror the original preclinical work undertaken by Brown using CT scanning in healthy dogs studied before and after bronchial thermoplasty [25]. The correlation between the improvement in airway volume and the improvement in patient symptoms provides reassurance that the observations are relevant to our understanding of the pathophysiological changes after bronchial thermoplasty.
The observation that bronchial thermoplasty causes airway dilatation is also consistent with plethysmographic studies, which have shown reductions in both airway resistance and gas trapping after bronchial thermoplasty [10, 14]. These findings are logical since we know from histological studies that there is airway smooth muscle atrophy 12 months after bronchial thermoplasty, and it would therefore be expected that this would lead to a reduction in airway wall tension with resultant increase in airway calibre [2]. Subsequent downstream improvement in regional ventilation after bronchial thermoplasty could be quantified by hyperpolarised gas MRI, with new data emerging in this group of patients [11, 12].
Until now, clinicians have primarily relied upon an improvement in patient symptoms to establish whether a patient had responded to bronchial thermoplasty. Clinical studies have demonstrated that at least 15% of patients fail to gain symptomatic benefit after bronchial thermoplasty [5, 7, 8]. However, it has been difficult to understand exactly what is happening in those patients who fail to respond to treatment. Using CT scanning to measure airway volume is likely to be a useful future tool for clinicians to verify objectively whether patients have responded to therapy, and therefore facilitate greater insight into the clinical characteristics of the non-responder group. Even in this current cohort of 10 patients, three patients would be classified as non-responders based on an improvement in ACQ of <0.5 units (minimal clinically significant change) – yet all three patients showed improvements in distal airway volume after treatment (figure 5). These three patients all had improvements in other clinical parameters – for example all three experienced reduction in asthma exacerbations after bronchial thermoplasty, and two of three showed improvement in FEV1 at 12 months compared to baseline. This suggests that improvement in ACQ may not be the perfect measure of response to bronchial thermoplasty. The future availability of other objective measures, such as CT-derived airway volumes, may lead us to redefine the frequency of non-response.
By convention, the RML is not included in the treatment field when the patient undergoes bronchial thermoplasty, for fear of causing stenosis at the, often narrow, origin to the RML. However, since the number of radiofrequency activations has been implicated as a predictor of successful treatment, some interventionalists have sought to improve the success rate by including treatment of the RML [17, 26]. In this study, we use a mathematical model of airway response to bronchial thermoplasty to assess whether RML treatment will be beneficial. The model output suggests that including the RML in the treatment field for bronchial thermoplasty has little to no effect on airway volume or resistance during bronchial challenge. This is also intuitively correct, given the size of the RML and small airway volume (1.02±0.72 mL). If we assume that the RML expands in the same proportion as the upper and lower lobes (∼30%), the RML volume would increase by only 0.18 mL, or 2.9% of the total airway volume in the right lung, suggesting there is little benefit in treating the RML.
A potential limitation of this study is the small sample size. However, the stability of the CT measurements when repeated over time in untreated portions of the lung is very reassuring (figures 3 and 4). The fact that statistically significant changes are observed in a small sample suggests that a consistent and sizeable effect is being demonstrated. These results are also in concordance with our larger study evaluating 18 patients after a single lung is treated [13]. Ultimately, the authors hope to continue using the CT method in larger numbers of patients in order to gain further insight into patients previously labelled as non-responders.
Conclusions
Bronchial thermoplasty induces long-term increases in airway volume, which correlate with symptomatic improvement.
It is unlikely that there is any additional clinical benefit in treating the RML.
This CT scan method shows promise as a tool for the future objective evaluation of responses to bronchial thermoplasty.
Acknowledgements
The authors would like to acknowledge the support-in-kind from Peninsula Health.
Footnotes
Support statement: D. Langton was the recipient of a post-graduate research scholarship from Monash University; and P.B. Noble was supported by a Western Australian Department of Health Merit Award, and a Medical and Health Research Infrastructure Fund. Studies examining physiological mechanisms of bronchial thermoplasty are supported by NHMRC of Australia (APP1180854). No industry funding was received.
Author contributions: D. Langton designed this study, recruited all patients, performed all bronchial thermoplasty procedures and analysed the data. C. Banks performed all patient assessments. G.M. Donovan performed the model simulations and assisted with data analysis. G.M. Dononvan, P.B. Noble, V. Plummer and F. Thien assisted with manuscript preparation and intellectual input in relation to study outcomes and findings.
Availability of data and materials: The datasets used during the current study are available from the corresponding author on reasonable request
Conflict of interest: D. Langton has nothing to disclose.
Conflict of interest: C. Banks has nothing to disclose.
Conflict of interest: P.B. Noble has nothing to disclose.
Conflict of interest: V. Plummer has nothing to disclose.
Conflict of interest: F. Thien has nothing to disclose.
Conflict of interest: G.M. Donovan has nothing to disclose.
References
- 1.James A, Bai R, Mauad T, et al. Airway smooth muscle thickness in asthma is related to severity but not duration of asthma. Eur Respir J 2009; 34: 1040–1045. doi: 10.1183/09031936.00181608 [DOI] [PubMed] [Google Scholar]
- 2.Pretolani M, Dombret MC, Thabut G, et al. Reduction of airway smooth muscle mass by bronchial thermoplasty in patients with severe asthma. Am J Respir Crit Care Med 2014; 190: 1452–1454. doi: 10.1164/rccm.201407-1374LE [DOI] [PubMed] [Google Scholar]
- 3.Pretolani M, Bergqvist A, Thabut G, et al. Effectiveness of bronchial thermoplasty in patients with severe refractory asthma: clinical and histopathological correlations. J Allergy Clin Immunol 2017; 139: 1176–1185. doi: 10.1016/j.jaci.2016.08.009 [DOI] [PubMed] [Google Scholar]
- 4.Cox G, Thomson N, Rubin A, et al. Asthma control during the year after bronchial thermoplasty. N Engl J Med 2007; 356: 1327–1237. doi: 10.1056/NEJMoa064707 [DOI] [PubMed] [Google Scholar]
- 5.Castro M, Rubin A, Laviolette M, et al. Effectiveness and safety of bronchial thermoplasty in the treatment of severe asthma. A multicentre, randomized, double-blind, sham-controlled clinical trial. Am J Respir Crit Care Med 2010; 181: 116–124. doi: 10.1164/rccm.200903-0354OC [DOI] [PMC free article] [PubMed] [Google Scholar]
- 6.Pavord I, Cox G, Thomson N, et al. Safety and efficacy of bronchial thermoplasty in symptomatic, severe asthma. Am J Respir Crit Care Med 2007; 176: 1185–1191. doi: 10.1164/rccm.200704-571OC [DOI] [PubMed] [Google Scholar]
- 7.Chupp G, Laviolette M, Cohn L, et al. Long-term outcomes of bronchial thermoplasty in subjects with severe asthma: a comparison of 3-year follow-up results from two prospective multicenter studies. Eur Respir J 2017; 50: 1700017. doi: 10.1183/13993003.00017-2017 [DOI] [PMC free article] [PubMed] [Google Scholar]
- 8.Langton D, Wang W, Sha J, et al. Predicting the response to bronchial thermoplasty. J Allergy Clin Immunol Pract 2020; 8: 1253–1260. doi: 10.1016/j.jaip.2019.10.034 [DOI] [PubMed] [Google Scholar]
- 9.Donovan G, Elliot J, Green F, et al. Unravelling a clinical paradox: why does bronchial thermoplasty work in asthma? Am J Respir Cell Mol Biol 2018; 59: 355–362. doi: 10.1165/rcmb.2018-0011OC [DOI] [PubMed] [Google Scholar]
- 10.Langton D, Ing A, Bennetts K, et al. Bronchial thermoplasty reduces gas trapping in severe asthma. BMC Pulm Med 2018; 18: 155. doi: 10.1186/s12890-018-0721-6 [DOI] [PMC free article] [PubMed] [Google Scholar]
- 11.Thomen R, Shashadri A, Quirk J, et al. Regional ventilation changes in severe asthma after bronchial thermoplasty with 3He MR imaging and CT. Radiology 2015; 274: 250–259. doi: 10.1148/radiol.14140080 [DOI] [PMC free article] [PubMed] [Google Scholar]
- 12.Hall C, Quirk J, Goss C, et al. Single-session bronchial thermoplasty guided by 129Xe magnetic Resonance Imaging: A pilot randomized clinical trial. Am J Respir Crit Care Med 2020; 202: 524–534. doi: 10.1164/rccm.201905-1021OC [DOI] [PMC free article] [PubMed] [Google Scholar]
- 13.Langton D, Sloan G, Banks C, et al. Bronchial thermoplasty increases airway volume measured by functional respiratory imaging. Respir Res 2019; 20: 157. doi: 10.1186/s12931-019-1132-9 [DOI] [PMC free article] [PubMed] [Google Scholar]
- 14.Langton D, Bennetts K, Noble P, et al. Bronchial thermoplasty reduces airway resistance. Respir Res 2020; 21: 76. doi: 10.1186/s12931-020-1330-5 [DOI] [PMC free article] [PubMed] [Google Scholar]
- 15.Langton D, Noble PB, Thien F, et al. Understanding the mechanism of bronchial thermoplasty using airway volume assessed by computed tomography. ERJ Open Res 2019; 5: 00272-2019. doi: 10.1183/23120541.00272-2019 [DOI] [PMC free article] [PubMed] [Google Scholar]
- 16.Mayse ML, Laviolette M, Rubin AS, et al. Clinical pearls for bronchial thermoplasty. J Bronchol 2007; 14: 115–123. doi: 10.1097/LBR.0b013e318054dbed [DOI] [Google Scholar]
- 17.Eisenmann S, Schutte W, Oezkan F, et al. Bronchial thermoplasty including the right middle lobe bronchus significantly improves lung function and quality of life in patients suffering from severe asthma. Lung 2019; 197: 493–499. doi: 10.1007/s00408-019-00240-5 [DOI] [PubMed] [Google Scholar]
- 18.Chung FK, Wenzel SE, Brozek JL, et al. International ERS/ATS guidelines on definition, evaluation and treatment of severe asthma. Eur Respir J 2014; 43: 343–373. doi: 10.1183/09031936.00202013 [DOI] [PubMed] [Google Scholar]
- 19.De Backer JW, Vos WG, Vinchurkar SC, et al. Validation of computational fluid dynamics in CT-based airway models with SPECT/CT. Radiology 2010; 257: 854–862. doi: 10.1148/radiol.10100322 [DOI] [PubMed] [Google Scholar]
- 20.Juniper EF, O'Byrne PM, Guyatt GH, et al. Development and validation of a questionnaire to measure asthma control. Eur Respir J 1999; 14: 902–907. doi: 10.1034/j.1399-3003.1999.14d29.x [DOI] [PubMed] [Google Scholar]
- 21.Miller MR, Hankinson J, Brusasco V, et al. ATS/ERS Task Force: standardisation of spirometry. Eur Respir J 2005; 26: 319–338. doi: 10.1183/09031936.05.00034805 [DOI] [PubMed] [Google Scholar]
- 22.Cooper BG, Stocks J, Hall GL, et al. The Global Lung Function Initiative (GLI) Network: bringing the world's respiratory reference values together. Breathe 2017; 13: e56–e64. doi: 10.1183/20734735.012717 [DOI] [PMC free article] [PubMed] [Google Scholar]
- 23.Donovan G, Elliot E, Green F, et al. Reply to: Comment on “Unraveling a Clinical paradox: Why does Bronchial Thermoplasty Work in Asthma?”. Am J Respir Cell Mol Biol 2019; 61: 661–663. doi: 10.1165/rcmb.2019-0137LE [DOI] [PubMed] [Google Scholar]
- 24.Juniper EF, Svensson K, Mörk AC, et al. Measurement properties and interpretation of three shortened versions of the asthma control questionnaire. Respir Med 2005; 99: 553–558. doi: 10.1016/j.rmed.2004.10.008 [DOI] [PubMed] [Google Scholar]
- 25.Brown R, Wizeman W, Danek C, et al. In vivo evaluation of the effectiveness of bronchial thermoplasty with computed tomography. J App Physiol 2005; 98: 1603–1606. doi: 10.1152/japplphysiol.01210.2004 [DOI] [PubMed] [Google Scholar]
- 26.Langton D, Sha J, Ing A, et al. Bronchial thermoplasty: activations predict response. Respir Res 2017; 18: 134. doi: 10.1186/s12931-017-0617-7 [DOI] [PMC free article] [PubMed] [Google Scholar]


