

Supplemental Digital Content is available in the text.
Key Words: radiomics, coronavirus disease, lung infection, machine learning
Abstract
Objective:
This study aimed to use the radiomics signatures of a machine learning-based tool to evaluate the prognosis of patients with coronavirus disease 2019 (COVID-19) infection.
Methods:
The clinical and imaging data of 64 patients with confirmed diagnoses of COVID-19 were retrospectively selected and divided into a stable group and a progressive group according to the data obtained from the ongoing treatment process. Imaging features from whole-lung images from baseline computed tomography (CT) scans were extracted and dimensionality reduction was performed. Support vector machines were used to construct radiomics signatures and to compare differences between the 2 groups. We also compared the differences of signature scores in the clinical, laboratory, and CT image feature subgroups and finally analyzed the correlation between the radiomics features of the constructed signature and the other features including clinical, laboratory, and CT imaging features.
Results:
The signature has a good classification effect for the stable group and the progressive group, with area under curve, sensitivity, and specificity of 0.833, 80.95%, and 74.42%, respectively. Signature score differences in laboratory and CT imaging features between subgroups were not statistically significant (P>0.05); cough was negatively correlated with GLCM Entropy_angle 90_offset4 (r=−0.578), but was positively correlated with ShortRunEmphhasis_AllDirect_offset4_SD (r=0.454); C-reactive protein was positively correlated with Cluster Prominence_ AllDirect_offset 4_ SD (r=0.47).
Conclusion:
The radiomics signature of the whole lung based on machine learning may reveal the changes of lung microstructure in the early stage and help to indicate the progression of the disease.
In December 2019, Wuhan city in Hubei province of China became the focus of the world owing to an outbreak of pneumonia-like coronavirus disease 2019 (COVID-19).1–3 Epidemiological evidence suggested that the virus was likely of a zoonotic origin linked to the city’s seafood market.4 However, the exact source of this new virus is not completely clear. The gene sequence of the virus from COVID-19 patients was highly homologous to that which exists in bats. In addition, this virus is also similar to the coronavirus that causes severe acute respiratory syndrome (SARS).5,6 The disease is highly contagious.7 As of April 4, 2020, the confirmed patients infected with COVID-19 climbed above 1 million globally. These figures are being updated daily and expected to increase further.
The sixth edition of China’s guidelines on COVID-19 pneumonia diagnosis and treatment includes a description of the clinical symptoms and laboratory tests as a part of the clinical diagnostic criteria.8 According to these criteria, the patients with COVID-19 are divided into mild, moderate, severe, and critical cases, among whom the mild ones often have a better prognosis. This is partly because COVID-19 disease progression is self-limiting in nature. Severe and critical patients have a higher risk of suffering from acute respiratory distress syndrome, which leads to a poor prognosis.9 Computed tomography (CT) imaging examination as an important evaluation method for COVID-19 pneumonia has been included in the clinical classification system. However, clinicians and researchers alike should pay particular attention to the fact that there is no imaging abnormality in mild patients in the early stage, and even the moderate cases are often atypical. Besides, the radiology findings may also overlap with those seen in pneumonia caused by different pathogens. Currently, the majority of moderately affected patients in China, especially those outside Hubei provinces, are likely to deteriorate into severe or critical cases if they are not treated on time. Therefore, technology should be developed and utilized for accurate disease assessment among these patients to support the rational allocation of medical resources.
In recent years, on the basis of the tenets of precision medicine, radiomics as an interdisciplinary technique has gained widespread use in the field of medicine. For instance, it has been used to monitor the progression of lung tumors, including predicting benign and malignant tumor differentiation and tumor typing, gene expression, and modeling therapeutic prognosis.10–12 These studies further suggested that radiomics can be used to determine the heterogeneity of lung tumors. Given these previous uses, the question of whether radiomics can equally be used for lung assessment in COVID-19 infection and disease development prediction becomes crucial and thus worth exploring. Furthermore, the appearance of pneumonia on CT is different from boundary-clear solid tumors, and the boundary of inflammation is sometimes unclear. This is often compounded by the limited grayscale spectrum visible to the human eye when CT images are viewed during pulmonary windowing. It is, therefore, possible that there may be some potential lesion areas in the adjacent areas of the consolidation that cannot be observed by the unaided eye. It is crucial to improve visual resolution in the early COVID-19 pneumonia imaging that often has no abnormal findings. On top of this, a comprehensive evaluation of the condition of the whole lung is very crucial because the disease also involves both pulmonary interstitial and parenchymal inflammation. Consequently, it becomes imperative that patients with COVID-19 pneumonia undergo whole-lung evaluation to further clarify the severity of the disease and its evolution.
Machine learning, as an important part of imaging data analysis, can use specific data-feature algorithms to extract a large amount of quantitative information from imaging data, thus identifying clinically valuable imaging patterns that human readers cannot recognize.13 Therefore, we hypothesized that radiomics based on machine learning can carry out heterogeneous analyses of the whole lung to facilitate the quantitative assessment of disease severity and predict disease progression trends. This may reveal the relationship between early microstructural changes in the lung and disease course, providing new biological insights into disease mechanisms.
METHODS
Data Sources and the Study Population
This study was approved by the relevant institutional review board and the local ethics committees. All investigations were conducted in accordance with the Helsinki Declaration. Because of the retrospective nature of the study, the local ethics committee did not require written informed consent. The researchers retrospectively obtained the imaging and clinical data of 64 patients diagnosed with COVID-19 infection from January 21 to February 19, 2020. Inclusion criteria were as follows: (1) nucleic acid test positivity and (2) 2 or more CT scans done. On the basis of the results of 2 serial CT scans, these patients were divided into stable groups (n=21) and progressive groups (n=43), shown in Figures 1 and 2. Six negative patients were included in the stable groups.
FIGURE 1.
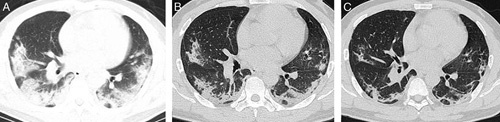
CT chest image of patients in the stable group. Man, 48 years old, fever for 6 days accompanied by chills, cough expectoration, with close contact history with COVID-19-confirmed patients. A, CT examination on the day of admission; an axial CT image shows two lungs with multiple, scattered consolidative opacities, and a striking peripheral distribution in the 2 lower lobes. B, Eight days later, an axial CT image shows the lesions to be partially absorbed and the extent of distribution reduced. C, Seventeen days later, an axial CT image shows that the distribution of lesions was further reduced, and 2 lungs with multiple, scattered rough strips, which suggested pulmonary fibrosis.
FIGURE 2.
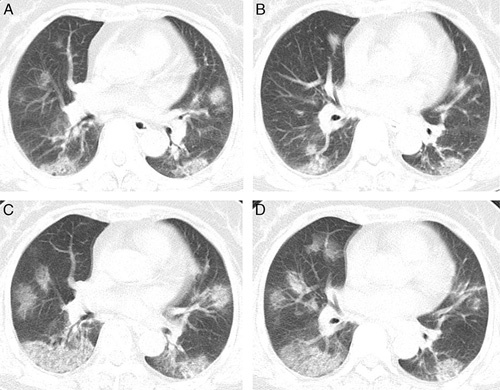
CT chest image of patients in the progression group. Woman, 67 years old, fever for 2 days, with close contact history with a COVID-19-confirmed patient. A and B, CT examination on the day of admission; an axial CT image showed diffusely subpleural distributed ground-glass opacities. C and D, Three days later, an axial CT image showed the disease progression, appearing increased to a greater extent and consolidation compared with baseline chest CT.
CT Scanning Parameters
A Siemens SOMATOM Perspective 16-row helix or China Lianying UCT 550 helix scanner was utilized for CT imaging using a single inspiratory phase for chest CT scans. To reduce motion-related artifacts, each patient received breath-holding guidance; the CT images were obtained during one breath-holding period. For CT acquisition, the tube voltage was set at 110 or 100 kVp automatic tube current regulation technology.
CT Imaging Grade Assessment
On the basis of current clinical practice and a previous study’s findings on the scope and presentation of the lesions, it has been recommended that the CT manifestations of COVID-19 infection be divided into 3 stages, namely, early, advanced, and severe,14 and the details of CT images in 3 stages can be found in supplementary materials, Supplemental Digital Content 1 (http://links.lww.com/JTI/A174). In this study, we defined the progressive group as follows: (1) increased ground-glass opacity (GGO) lesions and (2) newly occurring lesions exceeded the potential cumulative range. All images were evaluated independently by 2 experienced radiologists; where there were differences of opinion, the final opinion was reached after consultations between them (Dr Li has 11 y of experience in the interpretation of CT images, whereas Dr Gong has 26 y of experience).
Segmentation and Preprocessing of the Whole Lung
Each lung window image of the first CT scan of all cases was imported into the LK software (Lunk Intelligence Kit, version 2.0, GE Healthcare) in DICOM format for automatic full-lung cutting. The 3-dimensional (3D) lung images were manually modified by 2 experienced neuroradiologists (radiologist A and radiologist B, with 5 and 15 y of chest-imaging experience, respectively) who were blinded to the clinical data using the ITK-SNAP software (http://www.itksnap.org). This was accomplished by the following steps: (1) removal of the miscut trachea and vascular shadows; (2) correction of the cutting error at the junction of the heart and lung; and (3) correction of the incomplete cut area caused by pulmonary fibrosis or consolidation, resulting in a full 3D image of the lung. The 3D, full lung images were imported into the QAK software (Quantitative Analysis Kit, version 1.2, GE Healthcare) for image preprocessing. First, all images were resampled to a resolution of 1×1×1 mm by linear interpolation to eliminate the anisotropy effect on the features. The Gaussian filter was then applied to reduce noise, which also helps to minimize external interference factors. Finally, intensity standardization was performed to limit the grayscale of all images to 0 to 32 so that they can be compared without bias.15 The process of segmentation for the whole lung is shown in Figure 3.
FIGURE 3.
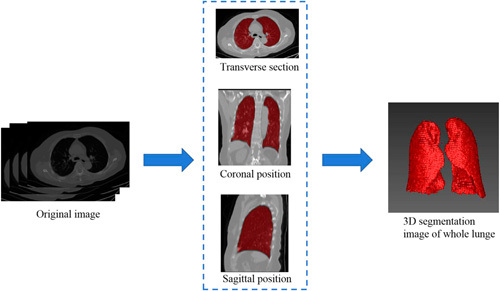
Process of segmentation for the whole lung. The chest image of CT is imported into AI software to segment the whole lung, and a 3-dimensional image of the whole lung is obtained.
Radiomics Feature Selection
Preprocessed images use QAK software to extract radiomics features, including histograms, shape factors, gray-scale symbiosis matrix (GLCM), run-time matrix (RLM), and gray-scale region matrix features (GLZSM), which are features of cancer heterogeneity and may reflect changes in image structure.16 We used the features that were most robust against the manual correction among different radiologists (19) to ensure the robustness and repeatability of radiomics features. The Spearman rank correlation test was used to calculate the correlation coefficient (CC) for each feature, between features set-A (from radiologist A) and feature set-B (from radiologist B). Features with CC>0.8 were considered robust features. Also, because of the existence of a “curse of dimensionality”, often makes data reduction or feature selection necessary to obtain meaningful results from the pattern recognition analysis.17 Therefore, this study first uses the minimum redundancy maximum correlation (mRMR) algorithm to screen the extracted features.18 The maximum correlation program aims to select the features that are most relevant to the actual pneumonia progression. Meanwhile, the minimum redundancy process ensures that the selected features have minimal redundancy in other features. Therefore, an optimal feature set with high correlation and low redundancy was obtained using the mRMR method. Finally, the least absolute shrinkage and selection operator (LASSO) algorithm was used to select the selected features to construct the radiomics signature. We used the bootstrapping method for feature selection for mRMR and LASSO algorithms throughout the dimension reduction process.
Radiomics Signature Establishment and Evaluation
Machine learning involves building data-derived signatures and methods to improve signature accuracy, performance, or predictive power, which is an important component of radiomics.19,20 Therefore, in this study, support vector machines (SVM) were used to construct radiomics signature. We used K(K-1)/2 binary SVM models using the one-versus-one coding design, where K is the number of unique class labels (levels) from MATLAB. We applied the one-leave-out cross-validation method for differentiation between training and test data because of the limited number of available patients. For example, we assigned one case as the test case and used the remaining 63 cases as the training data for the SVM classifier. The SVM model was used to calculate the radiomics score (rad-score) to reflect the progression of new coronavirus pneumonia. Finally, the receiver operating characteristic (ROC) curve was used to evaluate the accuracy of the radiomics signature. A 2-class rad-score analysis of CT typical manifestations, clinical typical manifestations, and laboratory examination of all cases was carried out to assess whether it was associated with disease progression. At the same time, the correlation analysis of the detection characteristic and radiomics features was carried out to further evaluate the ability of the signature to identify disease progression.
Statistical Analysis
The Statistical Package for Social Sciences (SPSS) version 22.0 and GraphPad Prism6 software packages were used for statistical analysis. The Kolmogorov-Smirnov test was used for the normality testing of the measurement data. The normally distributed data were evaluated using the independent-sample t test, whereas the non-normal distribution data were evaluated using the Mann-Whitney U test. The differences between categorical variables were tested using the χ2 test. All analyses were controlled for age and sex. Results P<0.05 were considered significant.
RESULTS
Clinical Data
The baseline data of the patients in the stable and the progressive groups included descriptive statistics, typical clinical manifestations, laboratory test results, and CT imaging findings (Table 1). The number of lesions in the stable group and the progressive group was statistically different (P<0.05).
TABLE 1.
Clinical Characteristics of Patients in the Stable and Progressive Groups
| Variables | Stable Group (n=43), n (%) | Progressive Group (n=21), n (%) | P |
|---|---|---|---|
| Descriptive statistics | |||
| Age (y) | 46±13 | 47±14 | 0.83 |
| BMI (kg/m2) | 23.7±3 | 24.9±3.4 | 0.189 |
| Sex | |||
| Male | 19 (44.2) | 10 (47.6) | 0.796 |
| Female | 24 (55.8) | 11 (52.4) | |
| The period between the onset of initial symptoms and the first scan (d) | 4.2±2 | 3.4±1.4 | 0.065 |
| The period between 2 CT scans (d) | 5.9±2.4 | 4.8±2.0 | 0.054 |
| Hospitalization time (d) | 13.2±4.3 | 14.1±5.7 | 0.466 |
| Initial symptoms | |||
| Fever | |||
| None | 7 (16.3) | 1 (4.8) | 0.133 |
| Low (37.3-38°C) | 21 (48.8) | 14 (66.7) | |
| Moderate (38.1-39°C) | 9 (20.9) | 6 (28.6) | |
| High (≥39.1°C) | 6 (14) | 0 (0) | |
| Cough | |||
| None | 19 (38.5) | 7 (33.3) | 0.407 |
| Yes | 24 (61.5) | 14 (66.7) | |
| Chest pain | |||
| None | 41 (95.3) | 21 (100) | 0.315 |
| Yes | 2 (4.7) | 0 (0) | |
| Diarrhea | |||
| No | 35 (81.4) | 18 (85.7) | 0.667 |
| Yes | 8 (18.6) | 3 (14.3) | |
| Laboratory test data | |||
| White blood cell count | |||
| Normal | 29 (67.4) | 14 (66.7) | 0.951 |
| Abnormal | 14 (32.6) | 7 (33.3) | |
| Lymphocyte count | |||
| Normal | 33 (76.7) | 14 (66.7) | 0.391 |
| Abnormal | 10 (23.3) | 7 (33.3) | |
| C-reactive protein | |||
| Normal | 13 (30.2) | 6 (28.6) | 0.891 |
| Abnormal | 30 (69.8) | 15 (71.4) | |
| Liver function | |||
| Normal | 37 (86) | 18 (85.7) | 0.971 |
| Abnormal | 6 (14) | 3 (14.3) | |
| Myocardial enzymes | |||
| Normal | 41 (95.3) | 20 (95.2) | 0.984 |
| Abnormal | 2 (4.7) | 1 (4.8) | |
| Chest CT imaging data | |||
| Number of lesions | |||
| Negative | 6 (14) | 0 (0) | 0.042* |
| Solitary | 4 (9.3) | 6 (28.6) | |
| Multiple | 33 (76.7) | 15 (71.4) | |
| Location of lesions (n) | 0.256 | ||
| Pleura | 9 (20.9) | 2 (9.5) | |
| Others | 34 (79.1) | 19 (90.5) | |
| Ground-glass opacity (n) | |||
| None | 8 (18.6) | 1 (4.8) | 0.135 |
| Yes | 35 (81.4) | 20 (95.2) | |
| Minor mesh change (n) | |||
| None | 33 (76.7) | 15 (71.4) | 0.645 |
| Yes | 10 (23.3) | 6 (28.6) | |
| Thick and large shadow | |||
| None | 26 (60.5) | 14 (66.7) | 0.63 |
| Yes | 17 (39.5) | 7 (33.3) | |
*Mean P<0.05.
BMI indicates body mass index.
Establishment and Evaluation of Imaging Labels
By mRMR and LASSO algorithms, seven best features were finally left, including 3 features of GLCM, 2 features of RLM, and 1 feature of the form factor and 1 texture feature (Table 2). The specific dimensionality-reduction process and feature introduction are included in the supplementary materials, Supplemental Digital Content 1 (http://links.lww.com/JTI/A174). On the basis of the ROC curve, the results demonstrate that using the SVM classifier shows that area under curve, sensitivity, and specificity were 0.833, 80.95%, and 74.42%, respectively. The rad-score of the signature calculated according to the SVM formula was significantly different between the stable group and the progression group (P <0.05) (Fig. 4).
TABLE 2.
Classification and Weight Value of the Features
| Category | Feature | Weight Value |
|---|---|---|
| GLCM | InverseDifferenceMoment_AllDirection_offset4_SD | −0.3071 |
| GLCMEntropy_angle90_offset4 | 0.7943 | |
| Correlation_angle0_offset7 | −1.1446 | |
| RLM | LongRunLowGreyLevelEmphasis_AllDirection_offset4_SD | 2.4542 |
| ShortRunEmphasis_AllDirection_offset4_SD | −0.5895 | |
| Texture parameter | ClusterProminence_AllDirection_offset4_SD | −1.182 |
| Form factor parameter | Maximum3DDiameter | 0.5136 |
FIGURE 4.
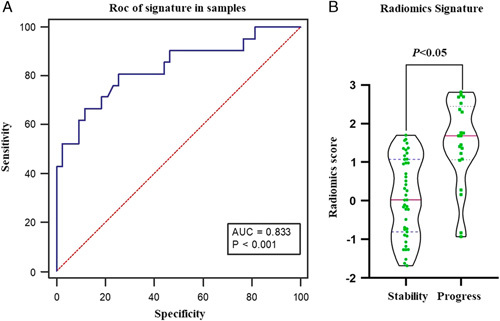
Diagnostic performance of radiomics signature. A, Diagnostic accuracy of the fractional values calculated by the SVM classifier in the study queue. B, Violin distribution of the scores calculated by the SVM classifier in the stable and progression groups. AUC indicates area under curve.
Detection Index Stratification Analysis and Correlation with Radiomics Features
There was a significant difference in rad scores among the C-reactive protein subgroups. The differences between other test features including laboratory and CT imaging indicators were not statistically significant (P>0.05) (Table 3). A correlation analysis of the radiomics features of constructing signature with the detection index showed a negative correlation between cough and GLCM Entropy_angle90_offset4 (r=−0.578), positive correlation with ShortRunEmphasis_AllDirection_offset4_SD (r=0.454), and positive correlation with C-reactive protein (CRP) with ClusterProminence_AllDirection_ offset4_SD (r=0.47) (Fig. 5).
TABLE 3.
Statistical Analysis of Radiomics Scores in the Clinical Features Subgroup
| Check Features | Characteristic Subgroup | P | ||
|---|---|---|---|---|
| White blood cell count | Normal | Abnormal | 0.295 | |
| 0.43±1.24 | 0.78±1.2 | |||
| Lymphocyte count | Normal | Abnormal | 0.16 | |
| 0.68±1.24 | 0.18±1.15 | |||
| C-reactive protein | Normal | Abnormal | 0.034* | |
| 1.05±1.32 | 0.33±1.14 | |||
| Liver function | Normal | Abnormal | 0.768 | |
| 0.56±1.19 | 0.43±1.52 | |||
| Myocardial enzymes | Normal | Abnormal | 0.086 | |
| 0.49±1.22 | 1.74±0.49 | |||
| Number of lesions | Negative | Solitary | Multiple | 0.631 |
| 0.35±1.44 | 0.15±2.49 | 0.13±3.2 | ||
| Location of lesions | None | Pleura | Others | 0.465 |
| −0.04±1.36 | 0.58±1.39 | 0.61±1.18 | ||
| Ground-glass opacity | None | Yes | 0.288 | |
| 0.18±1.44 | 0.62±1.18 | |||
| Minor mesh change | None | Yes | 0.488 | |
| 0.28±1.19 | 0.59±1.24 | |||
| Thick and large shadow | None | Yes | 0.782 | |
| 0.52±1.2 | 0.62±1.34 | |||
| Consolidation | None | Yes | 0.947 | |
| 0.55±1.24 | 0.53±1.24 | |||
*Mean P<0.05.
FIGURE 5.
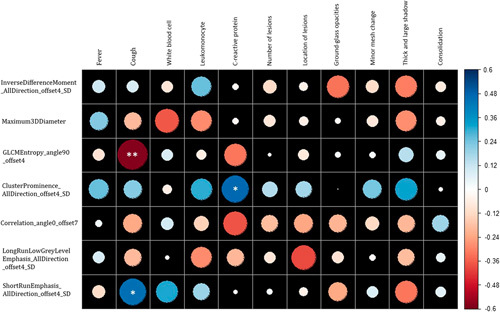
Correlation analysis of radiomics features and clinical characteristics. The circle size represents the value of the correlation coefficient. * P<0.05 and **P<0.01.
DISCUSSION
This study showed that machine learning-based radiomics signatures from the whole lung could distinguish between stable and progressive patients in the early stage, who usually showed fever or respiratory symptoms (eg, cough, myalgia, fatigue). In addition, these results suggest that the microstructure of the lungs may have changed before the point at which they can be visually detected on the CT images, including among those patients who may have shown normal lung imaging. Besides, cough and CRP abnormalities may be 2 extrinsic hallmarks of this microstructural change in the lungs. The cough and CRP abnormalities may help to better identify and to direct focus on the risk of potential progression in the patient population.
This was especially significant when the disease was in the progressive stage, whereby the lung infection becomes rapidly aggravated and develops into the bilateral opacities distribution.21 The changes during the progressive stage could lead to the variabilities of different stages of the disease between the groups; thus, we should try our best to find out the cause of this change. Age is a related factor in lung structural changes.22 Also, in this outbreak, age is considered to be one of the key elements of disease occurrence and progression. Death from COVID-19 occurs commonly among the elderly, in whom the disease may develop or progress faster.23 However, it could also be caused by underlying diseases. It has been reported that middle-aged and elderly patients with underlying diseases such as hypertension or diabetes are more prone to respiratory failure and have a poor prognosis,24,25 which may also point to the effects of underlying diseases or comorbidities on the whole lung. In the current study, age has not been shown to be a key factor in disease progression. Further analysis found an interesting phenomenon, whereby the age of our study cohort was generally younger than the age of typical patients with COVID-19. This was probably because most of our cases were not in the epidemic center region (Wuhan) and were dominated by input-type individual cases that were mostly younger people working in Hubei or Wuhan. As a result, age (advanced) did not become a key factor in predicting disease progression in our study.
We carried out a 2-class analysis of all the features of the whole-lung imaging scores, and the results showed that there were no statistically significant differences, suggesting that the current disease manifestations as detected by clinical, laboratory tests, and imaging examinations did not indicate early disease progression. However, the radiomics analysis of the whole lung can distinguish between the stable group and the progressive group of COVID-19 pneumonia patients, which further suggested that pulmonary heterogeneity was different between the 2 groups. According to the latest research,26 patients with COVID-19 pneumonia mainly showed pulmonary infiltrative lesions on CT imaging. Similar observations were also found in asymptomatic patients and those with false-negative nucleic acid test results. Therefore, on the basis of radiomics technology, CT is a sensitive tool for screening and assessing the severity of the disease among patients with COVID-19.27
In patients with COVID-19 pneumonia, cough often manifests as an early clinical symptom.28 Coughing is a natural reflexive defense action of the human body that removes secretions and foreign bodies from the respiratory tract. Histologic examination of the lung tissue from the COVID-19 pneumonia patients revealed that COVID-19 caused diffuse alveolar injury and mucoid exudation. These findings suggest that the patient’s cough may have emerged as a result of infection with the COVID-19. In this study, we noted that there are 2 radiomics features associated with cough, the entropy in the GLCM category. In a previous oncological study,29 this characteristic often indicated the heterogeneity of the tumor, a feature also confirmed for the whole lung in this study. The ShortRun Emphasis in the other RLM category mainly reflects the roughness and directionality of the texture. The directional texture will normally have a longer course at some angle. In the medical field, it represents the loss of regular structure after tissue injury.30 The lung imaging findings in patients with COVID-19 infection typically include multifocal bilateral GGO with patchy consolidations that are prominently distributed to the sub pleura periphery and to the posterior parts or lower lobes. The consolidations, often accompanied by pulmonary fibrosis, are commonly caused by the thickening of the GGO within the interlobular and intralobular septum during disease progression.31 Therefore, this characteristic of ShortRunEmphasis appears to suggest that such changes occur early. In addition, this study showed that CRP is also associated with specific imaging features. CRP is a sensitive marker and an indicator of inflammation in the body, especially in viral pneumonia.32 In COVID-19 pneumonia, mononuclear inflammatory infiltration composed of lymphocytes is mainly interstitial.33 The upregulation of CRP is a relevant indicator of changes in the whole-lung microstructure. It directly correlates with the extent of pulmonary inflammatory infiltration and thus may be responsible for the association of CRP with imaging features.
The study has several limitations. We used a smaller sample size based on the number of patients available to us and also fulfilling the inclusion criteria. The use of machine learning in CT scan reading and disease staging may require a larger sample size in the future to validate the present results. Also, this is a single-center study and, in particular, the collection of cases was not from the epicenter of the epidemic. However, it is important to note that all patients had a traceable positive history of exposure to the epicenter in Wuhan city. In addition, the disease progression period of the study used only short-term follow-up data. Usually, short-term imaging performance is consistent with the severity of COVID-19.34 Finally, feature selection was performed before 10-fold cross validation, and this may introduce bias, and prevent the area under curve reported here from being a reliable measure of generalization accuracy of the model. A larger validation on an independent testing dataset is necessary.
Our study provides an early way to identify the progression of COVID-19 pneumonia disease. Conclusions drawn from the data of this study may enable the clinicians to rationally identify those COVID-19 patients with potential risk for disease progression. Besides, these preliminary results are beneficial toward future integration of AI in the diagnosis and evaluation of COVID-19 pneumonia and providing a new biological perspective.
Supplementary Material
Supplemental Digital Content is available for this article. Direct URL citations appear in the printed text and are provided in the HTML and PDF versions of this article on the journal's website, www.thoracicimaging.com.
Footnotes
The authors declare no conflicts of interest.
REFERENCES
- 1.Huang C, Wang Y, Li X, et al. Clinical features of patients infected with 2019 novel coronavirus in Wuhan, China. Lancet. 2020;395:497–506. [DOI] [PMC free article] [PubMed] [Google Scholar]
- 2.Li Q, Guan X, Wu P, et al. Early transmission dynamics in Wuhan, China, of novel coronavirus-infected pneumonia. N Engl J Med. 2020;382:1199–1207. [DOI] [PMC free article] [PubMed] [Google Scholar]
- 3.World Health Organization. Novel coronavirus (2019-nCoV). Situation report 22. Geneva, Switzerland: World Health Organization; 2020. Available at: wwwwhoint/docs/default-source/coronavirus/situation-reports/20200211-sitrep-22-ncovpdf?sfvrsn=fb6d49b1_2 Accessed February 11, 2020.
- 4.Lu H, Stratton CW, Tang YW. Outbreak of pneumonia of unknown etiology in Wuhan China: the Mystery and the Miracle. J Med Virol. 2020;92:401–402. [DOI] [PMC free article] [PubMed] [Google Scholar]
- 5.Ji W, Wang W, Zhao X, et al. Homologous recombination within the spike glycoprotein of the newly identified coronavirus may boost cross-species transmission from snake to human. J Med Virol. 2020. Doi: 10.1002/jmv.25682. [DOI] [PMC free article] [PubMed] [Google Scholar]
- 6.Lu R, Zhao X, Li J, et al. Genomic characterization and epidemiology of 2019 novel coronavirus: implications for virus origins and receptor binding. Lancet. 2020;395:565–574. [DOI] [PMC free article] [PubMed] [Google Scholar]
- 7.World Health Organization. “Situation Report-49.” 2020. Available at: www.who.int/docs/default-source/coronaviruse/situation-reports/20200309-sitrep-49-covid-19.pdf?sfvrsn=70dabe61_4. Accessed May 10, 2020.
- 8.China NHCOTPSRO. Diagnosis and Treatment Protocol for Novel Coronavirus Pneumonia (5th interim edition). Available at: www.nhc.gov.cn/jkj/s3577/202003/4856d5b0458141fa9f376853224d41d7/files/4132bf035bc242478a6eaf157eb0d979.pdf.
- 9.Li K, Wu J, Wu F, et al. The clinical and chest CT features associated with severe and critical COVID-19 pneumonia. Invest Radiol. 2020;55:327–331. [DOI] [PMC free article] [PubMed] [Google Scholar]
- 10.Refaee T, Wu G, Ibrahim A, et al. The emerging role of radiomics in COPD and lung cancer. Respiration. 2020;99:99–107. [DOI] [PMC free article] [PubMed] [Google Scholar]
- 11.Pang T, Guo S, Zhang X, et al. Automatic lung segmentation based on texture and deep features of HRCT images with interstitial lung disease. Biomed Res Int. 2019;2019:2045432. [DOI] [PMC free article] [PubMed] [Google Scholar]
- 12.Wilson R, Devaraj A. Radiomics of pulmonary nodules and lung cancer. Transl Lung Cancer Res. 2017;6:86–91. [DOI] [PMC free article] [PubMed] [Google Scholar]
- 13.Awan SE, Sohel F, Sanfilippo FM, et al. Machine learning in heart failure: ready for prime time. Curr Opin Cardiol. 2018;33:190–195. [DOI] [PubMed] [Google Scholar]
- 14.Radiology Branch of Chinese Medical Association. Radiological diagnosis of new coronavirus infected pneumonitis: expert recommendation from the Chinese Society of Radiology (First edition). Chin J Radiol. 2020;54:E001. [Google Scholar]
- 15.Sun R, Limkin EJ, Vakalopoulou M, et al. A radiomics approach to assess tumor-infiltrating CD8 cells and response to anti-PD-1 or anti-PD-L1 immunotherapy: an imaging biomarker, retrospective multicohort study. Lancet Oncol. 2018;19:1180–1191. [DOI] [PubMed] [Google Scholar]
- 16.Mayerhoefer ME, Materka A, Langs G, et al. Introduction to Radiomics. J Nucl Med. 2020;61:488–495. [DOI] [PMC free article] [PubMed] [Google Scholar]
- 17.Ashburner J. Computational anatomy with the SPM software. Magn Reson Imaging. 2009;27:1163–1174. [DOI] [PubMed] [Google Scholar]
- 18.Mukaka MM. Statistics corner: a guide to appropriate use of correlation coefficient in medical research. Malawi Med J. 2012;24:69–71. [PMC free article] [PubMed] [Google Scholar]
- 19.Watson DS, Krutzinna J, Bruce IN, et al. Clinical applications of machine learning algorithms: beyond the black box. BMJ. 2019;364:l886. [DOI] [PubMed] [Google Scholar]
- 20.Chen R, Liu X, Jin S, et al. Machine learning for drug-target interaction prediction. Molecules. 2018;23:pii: E2208. [DOI] [PMC free article] [PubMed] [Google Scholar]
- 21.Pan F, Ye T, Sun P, et al. Time course of lung changes on chest CT during recovery from 2019 novel coronavirus (COVID-19) pneumonia. Radiology. 2020;295:715–721. [DOI] [PMC free article] [PubMed] [Google Scholar]
- 22.Skloot GS. The effects of aging on lung structure and function. Clin Geriatr Med. 2017;33:447–457. [DOI] [PubMed] [Google Scholar]
- 23.Wang W, Tang J, Wei F. Updated understanding of the outbreak of 2019 novel coronavirus (2019-nCoV) in Wuhan, China. J Med Virol. 2020;92:441–447. [DOI] [PMC free article] [PubMed] [Google Scholar]
- 24.Kui L, Fang YY, Deng Y, et al. Clinical characteristics of novel coronavirus cases in tertiary hospitals in Hubei Province. Chin Med J (Engl). 2020;133:1025–1031. [DOI] [PMC free article] [PubMed] [Google Scholar]
- 25.Zhou L, Liu HG. Early detection and disease assessment of patients with novel coronavirus pneumonia. Zhonghua Jie He He Hu Xi Za Zhi. 2020;43:167–170. [DOI] [PubMed] [Google Scholar]
- 26.Shi H, Han X, Jiang N, et al. Radiological findings from 81 patients with COVID-19 pneumonia in Wuhan, China: a descriptive study. Lancet Infect Dis. 2020;20:425–434. [DOI] [PMC free article] [PubMed] [Google Scholar]
- 27.Lee EYP, Ng MY, Khong PL. COVID-19 pneumonia: what has CT taught us? Lancet Infect Dis. 2020;20:384–385. [DOI] [PMC free article] [PubMed] [Google Scholar]
- 28.Song F, Shi N, Shan F, et al. Emerging Coronavirus 2019-nCoV Pneumonia. Radiology. 2020;295:210–217. [DOI] [PMC free article] [PubMed] [Google Scholar]
- 29.Chaddad A, Tanougast C. Texture analysis of abnormal cell images for predicting the continuum of colorectal cancer. Anal Cell Pathol (Amst). 2017;2017:8428102. [DOI] [PMC free article] [PubMed] [Google Scholar]
- 30.Shu ZY, Shao Y, Xu YY, et al. Radiomics nomogram based on MRI for predicting white matter hyperintensity progression in elderly adults. J Magn Reson Imaging. 2020;51:535–546. [DOI] [PubMed] [Google Scholar]
- 31.Pan F, Ye T, Sun P, et al. Time course of lung changes on chest CT during recovery from 2019 Novel Coronavirus (COVID-19) Pneumonia. Radiology. 2020;295:715–721. [DOI] [PMC free article] [PubMed] [Google Scholar]
- 32.Karhu J, Ala-Kokko TI, Vuorinen T, et al. Interleukin-5, interleukin-6, interferon-induced protein-10, procalcitonin and C-reactive protein among mechanically ventilated severe community-acquired viral and bacterial pneumonia patients. Cytokine. 2019;113:272–276. [DOI] [PMC free article] [PubMed] [Google Scholar]
- 33.Xu Z, Shi L, Wang Y, et al. Pathological findings of COVID-19 associated with acute respiratory distress syndrome. Lancet. 2020;8:420–422. [DOI] [PMC free article] [PubMed] [Google Scholar]
- 34.Chung M, Bernheim A, Mei X, et al. CT imaging features of 2019 Novel Coronavirus (2019-nCoV). Radiology. 2020;295:202–207. [DOI] [PMC free article] [PubMed] [Google Scholar]
Associated Data
This section collects any data citations, data availability statements, or supplementary materials included in this article.
Supplementary Materials
Supplemental Digital Content is available for this article. Direct URL citations appear in the printed text and are provided in the HTML and PDF versions of this article on the journal's website, www.thoracicimaging.com.