Abstract
Objective
To employ diffusion imaging connectome methods to explore network development in the contralesional hemisphere of children with perinatal stroke and its relationship to clinical function. We hypothesized alterations in global efficiency of the intact hemisphere would correlate with clinical disability.
Methods
Children with unilateral perinatal arterial (n = 26) or venous (n = 27) stroke and typically developing controls (n = 32) underwent 3T diffusion and T1 anatomical MRI and completed established motor assessments. A validated atlas coregistered to whole-brain tractography for each individual was used to estimate connectivity between 47 regions. Graph theory metrics (assortativity, hierarchical coefficient of regression, global and local efficiency, and small worldness) were calculated for the left hemisphere of controls and the intact contralesioned hemisphere of both stroke groups. Validated clinical motor assessments were then correlated with connectivity outcomes.
Results
Global efficiency was higher in arterial strokes compared to venous strokes (p < 0.001) and controls (p < 0.001) and was inversely associated with all motor assessments (all p < 0.012). Additional graph theory metrics including assortativity, hierarchical coefficient of regression, and local efficiency also demonstrated consistent differences in the intact hemisphere associated with clinical function.
Conclusions
The structural connectome of the contralesional hemisphere is altered after perinatal stroke and correlates with clinical function. Connectomics represents a powerful tool to understand whole brain developmental plasticity in children with disease-specific cerebral palsy.
Perinatal stroke causes hemiparetic cerebral palsy (HCP) and lifelong disability.1,2 Most common are neonatal AIS and arterial presumed perinatal ischemic stroke, which are typically large artery occlusions, and periventricular venous infarction (PVI), a subcortical lesion that occurs earlier in gestation.2 Such strokes usually injure the developing motor system, resulting in contralateral HCP.3
How the motor system develops following such early unilateral injury is increasingly understood. Animal studies complemented by human brain mapping have informed models of developmental plasticity.4–8 Alterations throughout the contralesional, intact hemisphere are increasingly being linked to clinical function.5,9–15 Missing from these models is an understanding of how network connectivity influences function. Recent resting-state fMRI studies suggest alterations in functional connectivity are measurable but have been limited to selected structures in modest samples.16–18
Combining diffusion MRI (dMRI) with mathematical modeling referred to as graph theory may facilitate exploration of the brain connectome. By estimating the restriction of the diffusion of water, structural connections across regions can be inferred19 including specific connections (i.e., tractography).20 We have used such methods to study how sensorimotor tract development is altered following perinatal stroke.9,10 Other studies have investigated whole-brain tractography in heterogenous cerebral palsy populations.21,22 Combining whole-brain tractography with anatomical nodes and graph theory can generate estimates of the structural or white matter (WM) connectome23,24 but has not been utilized in children with perinatal stroke.24
We employed dMRI and graph theory to explore alterations in the contralesional connectome and their relationship to function in children with perinatal stroke.
Methods
This was a population-based, retrospective, controlled cohort study.
Standard protocol approvals, registrations, and patient consents
This study was approved by the University of Calgary Conjoint Health Research Ethics Board. Written informed parental consent and participant assent were obtained.
Participants
Children with perinatal stroke were identified from the Alberta Perinatal Stroke Project, a large population-based research cohort.25 Inclusion criteria were (1) MRI-confirmed unilateral perinatal stroke and disabling HCP, (2) aged 6–19 years, and (3) 3T research MRI with T1 anatomical and diffusion-weighted images. Exclusion criteria were (1) diagnosis of a neurodevelopmental or neurologic condition unrelated to stroke, (2) MRI contraindication, and (3) excess head motion leading to unreadable MRI scans.
Participants were classified into stroke type based on timing, symptomology, and neuroimaging by a pediatric stroke neurologist (A.K.) using established criteria as either arterial ischemic stroke (AIS) or PVI.31 The arterial group was also stratified by vascular classification and basal ganglia involvement.3
Healthy typically developing controls (TDCs) of comparable age and sex were recruited from the general population using the same exclusion criteria.
Neuroimaging acquisition
Participants completed a standardized MRI protocol using a 3T GE (Cleveland, OH) MR750w pediatric research scanner with a 32-channel head coil. High-resolution T1-weighted images were acquired in the axial plane (1 mm isotropic voxels, repetition time [TR] 8.6 ms, echo time [TE] 3.2 ms, flip angle 11°, field of view 256 mm, acquisition time 5:10). An axial diffusion spin-echo echoplanar imaging scan was also acquired (32 diffusion directions; b = 0 s/mm2 [×3], 750 s/mm2; 2.5 mm isotropic voxels; 60 slices; TR 11,500 ms, TE 69 ms, acquisition time 6:45).
Image processing
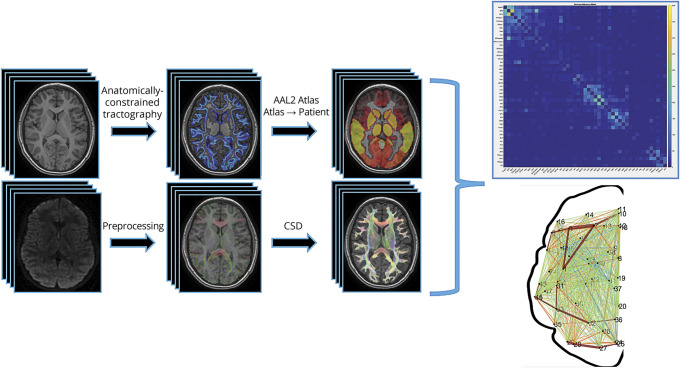
The processing steps for both anatomical and diffusion scans are outlined in figure 1. All processing code will be made readily available to qualified researchers upon reasonable request.
Figure 1. Neuroimaging pipeline.
Image processing steps employed a combination of SPM12, FSL, and MRtrix to optimize results in brains with larger lesions. AAL2 = automated anatomic labeling 2; CSD = constrained spherical deconvolution.
Anatomical scans were parcellated using the Statistical Parametric Mapping (SPM12, fil.ion.ucl.ac.uk/spm/) segmentation tool into WM, gray matter (GM), CSF, bone, and soft tissue/air. FMRIB Software Library (FSL)'s FIRST was used to isolate subcortical structures.26 This subcortical segmentation allowed us to use anatomically constrained tractography (ACT) to confine our streamlines to WM and through subcortical structures such as the thalamus.27 Each relevant volume was combined to one 5-tissue-type probability map image of WM, GM, subcortical GM, CSF, and lesion (optional). Once the 5-tissue-type image was created, a GM–WM interface image was generated to serve as the boundary between these 2 tissues and constrain our tracts to WM. Anatomical volumes were linearly transformed to diffusion space using FSL's linear registration tool (FLIRT).28 All masks and volumes were manually quality checked slice by slice by 2 researchers (B.T.C., A.H.).
Diffusion scans underwent eddy current and small motion correction using FSL's eddy_correct. Following preprocessing, diffusion scans were manually quality checked for various artifacts (i.e., severe motion or echoplanar imaging distortions). Whole-brain probabilistic tractography was performed using MRtrix3's tckgen with constrained spherical deconvolution (CSD) and ACT with the suggested tractography measures (step size = 1 mm, angle threshold = 45°, FOD amplitude threshold = 0.05, 1 million streamlines).27,29 FSL's FMRIB nonlinear image registration tool (FNIRT) transformed the automated anatomic labeling 2 (AAL2) atlas to each participant's diffusion space.30 For patients with stroke, we calculated the inverse warp from diffusion space to AAL2 space, using a mask of the lesion, to get accurate registrations of the AAL2 back into each patient's diffusion space.
Connectome matrix
A symmetric, weighted 120 × 120 node connectivity matrix was then generated using MRtrix3's tck2connectome by combining the whole-brain tracts and the AAL2 atlas. Weights were defined as number of streamlines that began or ended in a node. Subcerebellar nodes (i.e., cerebellar lobules and vermes) were excluded, leaving a symmetric 94 × 94 node connectivity matrix. Due to wide variations in volumes as a result of differing stroke locations, we isolated only the contralesional hemisphere in participants with stroke and compared that to the left, or dominant, hemisphere in controls in accordance with prior studies.11 This resulted in a 47 × 47 symmetric, undirected, weighted matrix. We then used a threshold to remove any nodes that had 15 streamlines or less to remove potentially spurious connections. The matrix was then loaded into the graph-theoretical network analysis toolbox (GRETNA), which employs the brain connectivity toolbox to generate graph theory metrics.31,32
Graph theory outcomes
A summary of the graph theory metrics used can be found in table 1. Global metrics of the WM connectome were calculated using the brain connectivity toolbox and GRETNA.31,32 All metrics were calculated using a weighted and undirected connectome matrix of the contralesional hemisphere in participants with stroke and the left hemisphere in controls. A lay summary of these metrics are included here for clarity, with detailed formal definitions provided in table 1.
Table 1.
Graph theory outcome definitions
Hierarchical topology in the network was explored using assortativity and the hierarchical coefficient of regression (HCR).31,33,34 Assortativity assessed the network's preference for nodes to connect to other nodes with similar degree (i.e., total number of nodal connections). The HCR was derived as the coefficient of linear regression between the clustering coefficient (i.e., the tendency for nodes to cluster into highly connected groups) and nodal degree, as outlined in Wang et al.31 and Ravasz and Barabási.34 The HCR provides a rudimentary sense of the network's potential hierarchical organization. Efficiency in the network was examined at both the global and local levels. Global efficiency estimated how information exchanges in parallel across a system where all nodes are capable of exchanging information, based on the inverse of the average path length (table 1). Local efficiency characterizes how efficient the communication is among neighboring nodes once a node is removed from the network—a test of resiliency in the network. Small-worldness topology underscores specific properties in networks, and is typically associated with a proportional relationship between the distance (path length) and how nodes are connected (degree) in the network, e.g., the level of interconnectivity in subnetworks of a network.31 This is referred to as sigma here.
Clinical motor outcomes
Participants completed comprehensive clinical motor assessments by certified, blinded, pediatric occupational therapists. The Assisting Hand Assessment (AHA) is an evidence-based, validated measure of bimanual upper-extremity function in children with HCP.35 Use of the affected hand is scored during a play-based assessment, leading to scores on 22 bimanual actions such as amount of use, grasp and release, and coordination. Total scores are expressed as AHA logit units with a maximum score of 100. The Melbourne Assessment of Unilateral Upper Limb Function (MUUL) is a 16-item test assessing grasping, reaching, and manipulation with unilateral upper limb movement in children with HCP with scores expressed out of 100.36 The Box and Block Test is a measure of unilateral gross manual dexterity testing both the affected (BBTA) and unaffected (BBTU) hands.37 The score is the number of blocks moved from one side of a box, over a partition, to placement in an adjacent box within 60 seconds. Higher scores on the AHA, MUUL, BBTA, and BBTU indicate better performance. The Jebsen Taylor Hand Function test assesses affected (JTHFA) and unaffected (JTHFU) upper extremity function using daily living activities, such as turning over playing cards, stacking checkers pieces, or picking up small common objects and putting them in a container.38 Scores are calculated as the total time required to complete all tasks (with lower scores reflecting better function).
Analysis
Distribution normality was assessed using the Shapiro-Wilk test of normality. Graph theory parametric mean group differences were explored using an analysis of variance, whereas nonparametric group differences were examined using a Kruskal-Wallis test. Bonferroni correction was used for multiple comparison correction. 95% Confidence intervals (CIs) and estimates of effect sizes (partial eta squared [η2]) were included for parametric, normally distributed data. Clinical motor assessments were correlated with graph theory outcomes using either a Pearson (r) or Spearman (rs) correlation depending on normality of the data. Age, sex, and lesion size were considered as potential covariates. Based on outcome means and variances from similar studies, we estimated our retrospective sample of convenience was at least 90% powered to address our primary hypothesis.9,10,13 Statistical Package for Social Sciences (SPSS) 25 was used for all analyses.
Data availability
Deidentified neuroimaging data will be available to qualified researchers upon a reasonable request.
Results
Population
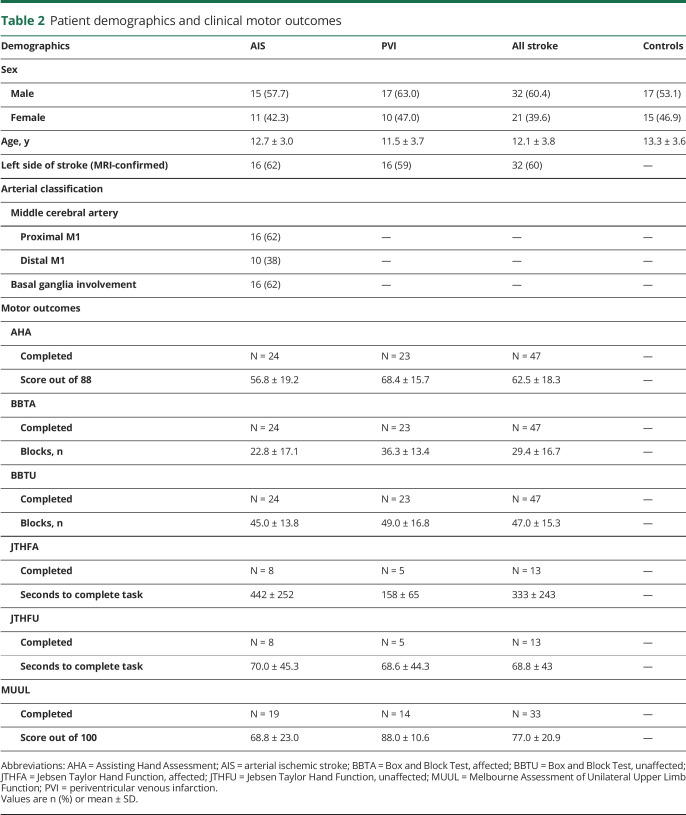
The study population is summarized in table 2. The final sample consisted of 85 participants: 26 with AIS (42% female; mean 12.7 ± 4.0 years; range 6.6–19.0), 27 with PVI (37% female; mean 11.5 ± 3.7 years; range 6.6–19.7), and 32 TDCs (47% female; mean 13.3 ± 3.6 years; range 6.5–19.0). Five participants were excluded due to poor scan quality from motion artifacts. The 3 groups did not differ in terms of age or sex distribution. Stroke arterial classifications and clinical motor assessment outcomes are listed in table 2.
Table 2.
Patient demographics and clinical motor outcomes
Connectivity metrics between groups
Age was not associated with any graph theory metric for individual groups and collapsed across groups (all p > 0.05). There was also no difference in graph theory outcomes and sex (all p > 0.05). An association was observed between global and local efficiency and lesion size (rs = 0.508, p < 0.001 and rs = 0.497, p < 0.001, respectively).
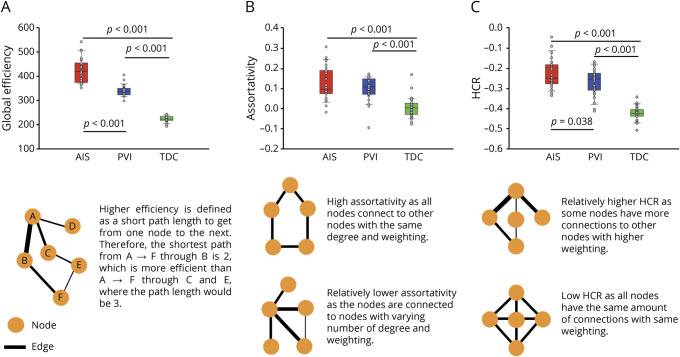
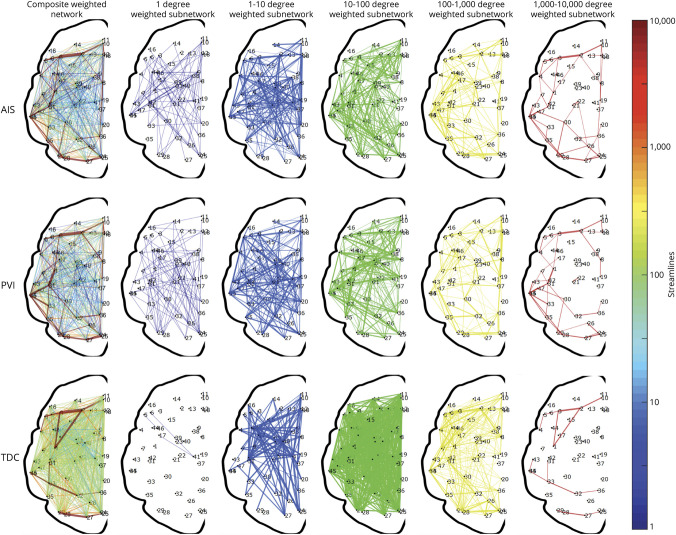
Group differences in graph theory connectivity metrics are summarized in figure 2. A visual representation of all connections between nodes at various degrees is shown in figure 3.
Figure 2. Global graph theory differences between stroke groups and controls.
(A) Assortativity in arterial ischemic stroke (AIS) was significantly higher than in periventricular venous infarction (PVI) and typically developing controls (TDCs) and PVI assortativity was higher than in TDCs. (B) AIS values for hierarchical coefficient of regression (HCR) were higher than in PVI and TDCs, and PVI derived HCR was higher than in TDCs. (C) Global efficiency in AIS was higher than in PVI and TDCs. PVI global efficiency was higher than in TDC. The orange circles in the depictions represent nodes and the black lines represent the edges, where thicker lines represent higher weighting.
Figure 3. Visual representation of the weighted, undirected networks for a random child selected from the arterial ischemic stroke (AIS), periventricular venous infarction (PVI), and typically developing control (TDC) groups.
The weighted, undirected networks for each child is presented as both a composite graph (far left column) and segregated subnetworks based on network degree. Each subnetwork is displayed for node degrees ndegree = 10x for x = 0,1,…,5. Exponential steps between node degrees provide an appropriate visualization across the total number of streamlines representing each graph.
Global efficiency was different across groups (F2,82 = 304.9, p < 0.001, η2 = 0.889; figure 2A). AIS had the highest global efficiency (mean 423.8 ± 49.5) and was significantly higher than PVI (mean 340.0 ± 23.0; p < 0.001 [CI 62.9–104.8]) and TDC (mean 222.8 ± 12.4; p < 0.001 [CI 180.9–221.1]). PVI was also significantly higher in global efficiency compared to TDC (p < 0.001 [CI 97.2–137.1]).
Secondary graph theory outcomes also demonstrated consistent differences between groups. Assortativity differed among the 3 groups (H = 40.0, p < 0.001, figure 2B) such that the TDC group (mean 0.004 ± 0.048) demonstrated lower assortativity compared to both AIS (mean 0.128 ± 0.08; p < 0.001) and PVI (mean 0.099 ± 0.06; p < 0.001) groups. Local efficiency also differed across groups (H = 69.9; p < 0.001). AIS (mean 690.3 ± 121) had higher local efficiency compared to both PVI (mean 542.6 ± 50; p = 0.003) and TDCs (mean 238.3 ± 15; p < 0.001). PVI local efficiency was also higher than in TDCs (p < 0.001).
The HCR was also different across groups (F2,82 = 93.2, p < 0.001, η2 = 0.694; figure 2C) such that AIS (mean −0.23 ± 0.07) was higher than both PVI (mean −0.27 ± 0.07; p = 0.038 [CI 0.00–0.08]) and TDC (mean −0.42 ± 0.030; p < 0.001 [CI 0.16–0.23]). PVI HCR values were also higher than in TDCs (p < 0.001). Small worldness ratio (sigma) was also different between groups (H = 60.101; p < 0.001) where both PVI (mean 1.77 ± 0.11) and AIS (mean 1.72 ± 0.12) were higher than TDCs (mean 0.99 ± 0.01; both p < 0.001).
Connectivity metrics and clinical motor function
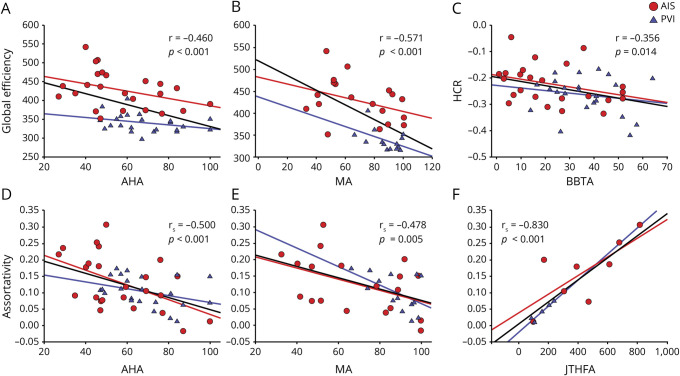
The relationship between graph theory metrics and clinical assessment scores is summarized in figure 4. Strong, consistent associations were observed between contralesional hemisphere connectivity metrics and measures of clinical motor function.
Figure 4. Global graph theory metrics of the contralesional hemisphere relate to clinical function.
Global efficiency was inversely related to Assisting Hand Assessment (AHA) and Melbourne Assessment (MA) (A and B, respectively). The hierarchical coefficient of regression (HCR) was inversely related to the Box and Block Test of the affected hand (BBTA) (C). Assortativity was inversely related to AHA and MA (D and E, respectively) and positively related to Jebsen Taylor Hand Function test of the affected hand (JTHFA) (F). AIS = arterial ischemic stroke; PVI = periventricular venous infarction.
A consistent negative association was observed between the primary outcome of global efficiency and motor function measures including AHA (r = −0.460, p = 0.001), BBTA (r = −0.374, p = 0.010), JTHFA (r = 0.673, p = 0.012), and MUUL (r = −0.571, p = 0.001).
Secondary graph theory metrics demonstrated similar relationships with motor outcome measures. A consistent inverse association was observed between assortativity and all measures of clinical motor function: AHA (rs = −0.500, p < 0.001), JTHFA (rs = 0.830, p < 0.001), and MUUL (rs = −0.478, p = 0.005), indicating that better performance was associated with lower assortativity values. Local efficiency was also inversely associated with function including AHA (rs = −0.491, p < 0.001), BBTA (rs = −0.409, p = 0.004), JTHFA (rs = 0.731, p = 0.005), and MUUL (rs = −0.570, p = 0.001).
The HCR was negatively associated with BBTA (r = 0.356, p = 0.014) but not the other clinical function measures. Importantly, no association was observed between contralesional hemisphere connectivity measures and clinical function of the unaffected hand (BBTU and JTHFU).
Discussion
Using graph theory to estimate the structural connectome, we have identified developmental network alterations in the contralesional hemisphere of children with perinatal stroke. Strong and consistent correlations between these metrics and behavioral measures of sensorimotor function suggest clinical relevance. Such WM connectomics appears to be a powerful tool to better understand brain development following injury early in life.
Our efforts focused on the structural connectome of the intact, contralesional hemisphere for carefully considered methodologic, neurophysiologic, and clinical reasons. The essential role of the contralesional hemisphere in determining clinical outcome from perinatal stroke has been definitively established by both preclinical and human brain mapping studies.4,6,7,39 Due to the variability in size and location of stroke lesions, isolating the contralesional hemisphere also facilitates comparisons to the healthy, typically developing brain. Examining our current sample at school age also likely allows exploration of the effects of the earliest years of development where plasticity has likely been maximal. That age was not strongly associated with our graph theory metrics may be in part explained by our participants having reached a more static phase of their motor development following perinatal injury.4 This highlights the potential of both earlier and longitudinal study designs to shed more light on the true developmental trajectory of the connectome we have described. Our demonstration of altered structural connectivity in the contralesional hemisphere appears to be consistent with the rapidly growing list of individual functional anatomical alterations including sensorimotor cortices and pathways, cerebellar and thalamic volumes, cortical metabolism, myelination, and others.5,9–15 Finally, the contralesional hemisphere is also the target of multiple noninvasive therapeutic neuromodulation trials, emphasizing the value of being able to measure the structural connectome both for target identification and to explore the possible mechanisms of interventional plasticity.39–43
A strength of our methods is the focus not only on perinatal stroke but also specific subtypes, differing in mechanisms, lesion locations, and timing. Many imaging studies of cerebral palsy have suffered from studying more heterogenous samples rather than such specific disease states. Accordingly, our results may be able to suggest more precise differences in network organization and development in children following each type of perinatal stroke, all of whom have the similar clinical syndrome of HCP. In keeping with this specificity by disease, a consistent pattern was observed in the degree and direction of difference in all graph theory connectivity metrics when comparing stroke groups to controls whereby patients with PVI demonstrated consistently intermediate differences from AIS (figure 2). Although somewhat speculative, one logical explanation may relate to the much larger, combined cortical–subcortical injuries of AIS as compared to smaller subcortical PVI lesions. The precise impact of these on developmental connectivity in the contralesional hemisphere remains unknown but is perhaps consistent with known differences in clinical outcomes where deficits in more complex brain functions including language and cognition occur almost exclusively in the AIS subset or patients with perinatal stroke.
With consideration of these disease-specific differences, the net effects of perinatal stroke on contralateral connectivity demonstrated similar patterns across groups. Both AIS and PVI demonstrated higher assortativity, suggesting nodes in the network preferred to link up with nodes having similar connectivity patterns. We also observed strong inverse relationships with their clinical function and how assortative the network appeared to be. Local efficiency was also highest among AIS compared to PVI and TDC while still being higher than controls in PVI. Higher local efficiency was associated with poorer function across all 4 clinical outcomes. The contralesional network also appeared to have more small-world connectivity as compared to TDC, which appears to be inversely related with clinical function. The HCR analyses revealed that children with perinatal stroke tended to have less negative coefficients of regression, indicating a lower inherent association between connectivity and clustering in stroke groups. That there was only one significant association with clinical outcomes may suggest the HCR is less clinically relevant than the other graph theory metrics investigated. Overall the contralesional structural network appears to become more segregated following perinatal stroke, though more precise mechanisms remain unknown.
To assess network integration in the contralesional hemisphere, we investigated how global efficiency might develop following perinatal stroke. Here, global efficiency was highest in AIS and lowest in TDC. This does not mean that TDC networks lack global efficiency, but rather that this metric is elevated after perinatal stroke. Consistently, the degree of this higher efficiency was strongly inversely related with clinical function. One might think a network being more “efficient” would be beneficial for clinical function. However, this inverse relationship has been described in the literature, particularly in the contralesional hemisphere. Studies using transcranial magnetic stimulation have described not only contralateral corticospinal tract (CST) projections, but also ipsilateral CST projections following early brain injury.5,6 Zewdie et al.5 describe how children with more connectivity in the contralesional hemisphere, specifically ones with more ipsilateral projections from CST to their affected hand, tend to have poorer outcomes. Further, we recently demonstrated how a larger contralesional thalamus and ipsilesional cerebellum (from contralateral cortical projections) are associated with clinical sensorimotor disability.11,12
In turn, the apparent increase in efficiency of the contralesional hemisphere may be obscured within an overall increase in connectivity; it may not be more efficient per se, but rather an increase in the connectivity may allow the contralesional hemisphere to have shorter connections. Further, we also found a positive relationship between lesion size and efficiency metrics (rs = 0.508, p < 0.001), supporting the aforementioned hypothesis. This likely means that the term efficiency, in the case of the contralesional hemisphere after perinatal stroke, is somewhat of a misnomer, and that networks are not more efficient in terms of motor function, just more densely connected. This is evident when investigating only the highest degree nodes across each sample, as depicted in figure 3.
To our knowledge, this is the first article to assess structural graph theoretical outcomes in perinatal stroke. Graph theory approaches have been applied to connectivity analyses in adult stroke, but most have been focused on functional connectomics. For example, Crofts et al.44 describe differences in communicability, another graph theory metric that generalizes the shortest path, in the contralesional hemisphere following subcortical stroke, suggesting neuroplastic network changes remote from the lesion with some similarity to our current study. Although our diffusion scan parameters differed from some literature in adult patients (b = 750 s/mm2; 32 directions), we applied CSD tractography for 3 main reasons. First, Toselli et al.45 showed that CSD tracking algorithms can be successfully applied with similar imaging parameters. Second, since we used ACT to refine our tracts to only the WM, we limit the chance of spurious fibers influencing our results.27 Despite these precautions, it is possible that using CSD with our parameters may introduce inherent type 1 error, though the consistent structure–function relationships we observed appear to mitigate this concern. Lastly, larger b-value and number of diffusion directions are difficult to acquire in pediatric populations due to the longer scanning times. We are currently investigating how to improve our MRI to acquire better diffusion data without increasing scan duration. There are also additional ways to process our connectome data (i.e., binary vs weighted matrix). Using the weighted matrices has more clinical relevance as they take into consideration how many connections there are in the brain. We used a hard number of streamlines cutoff threshold, which may influence our results. However, we also repeated the analysis using cutoff values of 5, 10, and 15, that appeared to make no difference to the resulting graph metrics. In addition, a recent study highlighted the insignificance of removing weak connections prior to processing the matrix.46 Future investigations may use more advanced matrix manipulations to understand relationships at the node and connection (i.e., edge) level.
Our findings appear to be clinically relevant. The strengths of the relationships we observed between graph theory connectome metrics and clinical outcomes were strong and consistent. We employed a variety of validated clinical tests that assess the performance of both unimanual and bimanual tasks in children with unilateral cerebral palsy.35–38 These assessments are the gold standard of motor function testing in such children, with high external validity. Most correlations fell in the moderate to strong range (r > 0.5), suggesting potential clinical significance. The strength of these associations is notably stronger than most imaging biomarkers identified in this population by both our group and others.9–12,21,47 Interestingly, we did not observe an association between unaffected hand function and connectome metrics. We have previously shown that the unaffected limb is not always normal in children with perinatal stroke but this required detailed robotic assessments that did not correlate well with clinical measures.9 Future studies aimed at linking these metrics to real-world measures of function (such as actigraphy) and therapeutic change such as we have demonstrated in neuromodulation clinical trials may prove additional utility of this approach in understanding both developmental and interventional plasticity in the developing brain.40,41
There are several important limitations to our study. First, our sample had a large range in ages (6–19 years). While this is representative of the clinical population, it does introduce variability into our data, even though age did not correlate strongly with our graph theory outcomes. Our sample contained more male than female participants but this is consistent with the natural prevalence of perinatal stroke. We also restricted our sample to children with disabling cerebral palsy, reflecting a bias towards motor system injury but also the most clinically relevant population. We limited our investigation to the contralesional hemisphere and did not include lesion features into this analysis for both known clinical relevance and methodologic challenges. While the lesioned hemisphere is certainly relevant to the global network, adding specific lesion features to the current analysis created substantial additional levels of complexity with findings we were not yet capable of interpreting with confidence. We are currently investigating new methods to better distinguish the influence of individualized lesion characteristics within a battery of imaging outcomes that may inform this issue. Future studies with larger samples may be able to integrate the more complex lesioned hemisphere into models exploring both intrahemispheric and interhemispheric connectivity. While the increased power of larger samples might reveal more subtle relationships, our study would be considered large in terms of perinatal stroke populations and our post hoc power calculations suggested we were over 90% powered to address our primary hypotheses.
Graph theory structural connectome imaging is feasible in children with perinatal stroke. The WM network of the contralesional hemisphere is altered following focal unilateral brain injury at the beginning of life, the degree of which correlates with clinical disability. Specifically, global efficiency of the contralesional hemisphere appears to be greater in perinatal stroke compared to controls and is negatively associated with clinical motor function. Similar relationships were displayed with other graph theory metrics, such as assortativity, local efficiency, and HCR, consistent with widespread, clinically relevant developmental alterations in the developmental connectome after perinatal stroke. Connectomics represents a potentially valuable tool to better understand both developmental and interventional plasticity in children with cerebral palsy.
Acknowledgment
The authors thank the families and children who participated in this study.
Glossary
- AAL2
automated anatomic labeling 2
- ACT
anatomically constrained tractography
- AHA
Assisting Hand Assessment
- AIS
arterial ischemic stroke
- BBTA
Box and Block Test, affected
- BBTU
Box and Block Test, unaffected
- CI
confidence interval
- CSD
constrained spherical deconvolution
- CST
corticospinal tract
- dMRI
diffusion MRI
- FSL
FMRIB Software Library
- GM
gray matter
- GRETNA
graph-theoretical network analysis toolbox
- HCP
hemiparetic cerebral palsy
- HCR
hierarchical coefficient of regression
- JTHFA
Jebsen Taylor Hand Function, affected
- JTHFU
Jebsen Taylor Hand Function, unaffected
- MUUL
Melbourne Assessment of Unilateral Upper Limb Function
- PVI
periventricular venous infarction
- TDC
typically developing control
- TE
echo time
- TR
repetition time
- WM
white matter
Appendix. Authors

Study funding
This work was supported through the Heart and Stroke Foundation of Canada and the Canadian Institute of Health Research.
Disclosure
B.T. Craig was supported through a Vanier Canadian Graduate Scholarship. A. Hilderley, E. Kinney-Lang, X. Long, H.L. Carlson, and A. Kirton report no disclosures relevant to the manuscript. Go to Neurology.org/N for full disclosures.
References
- 1.Kirton A. Life after perinatal stroke. Stroke 2013;44:3265–3271. [DOI] [PubMed] [Google Scholar]
- 2.Dunbar M, Kirton A. Perinatal stroke: mechanisms, management, and outcomes of early cerebrovascular brain injury. Lancet Child Adolesc Health 2018;2:666–676. [DOI] [PubMed] [Google Scholar]
- 3.Kirton A, Deveber G, Pontigon AM, Macgregor D, Shroff M. Presumed perinatal ischemic stroke: vascular classification predicts outcomes. Ann Neurol 2008;63:436–443. [DOI] [PubMed] [Google Scholar]
- 4.Eyre JA. Corticospinal tract development and its plasticity after perinatal injury. Neurosci Biobehav Rev 2007;31:1136–1149. [DOI] [PubMed] [Google Scholar]
- 5.Zewdie E, Damji O, Ciechanski P, Seeger T, Kirton A. Contralesional corticomotor neurophysiology in hemiparetic children with perinatal stroke: developmental plasticity and clinical function. Neurorehabil Neural Repair 2016;31:261–271. [DOI] [PubMed] [Google Scholar]
- 6.Staudt M. (Re-)organization of the developing human brain following periventricular white matter lesions. Neurosci Biobehav Rev 2007;31:1150–1156. [DOI] [PubMed] [Google Scholar]
- 7.Martin JH. The corticospinal system: from development to motor control. Neuroscientist 2005;11:161–173. [DOI] [PubMed] [Google Scholar]
- 8.Carmel JB, Martin JH. Motor cortex electrical stimulation augments sprouting of the corticospinal tract and promotes recovery of motor function. Front Integr Neurosci 2014;8:51. [DOI] [PMC free article] [PubMed] [Google Scholar]
- 9.Kuczynski AM, Dukelow SP, Hodge JA, et al. Corticospinal tract diffusion properties and robotic visually guided reaching in children with hemiparetic cerebral palsy. Hum Brain Mapp 2018;39:1130–1144. [DOI] [PMC free article] [PubMed] [Google Scholar]
- 10.Kuczynski AM, Carlson HL, Lebel C, et al. Sensory tractography and robot-quantified proprioception in hemiparetic children with perinatal stroke. Hum Brain Mapp 2017;38:2424–2440. [DOI] [PMC free article] [PubMed] [Google Scholar]
- 11.Craig BT, Carlson HL, Kirton A. Thalamic diaschisis following perinatal stroke is associated with clinical disability. Neuroimage Clin 2019;21:101660. [DOI] [PMC free article] [PubMed] [Google Scholar]
- 12.Craig BT, Olsen C, Sarah M, Carlson HL, Xing-Chang W, Kirton A. Crossed cerebellar atrophy in perinatal stroke. Stroke 2019;50:175–177. [DOI] [PubMed] [Google Scholar]
- 13.Kuczynski AM, Dukelow SP, Semrau JA, Kirton A. Robotic quantification of position sense in children with perinatal stroke. Neurorehabil Neural Repair 2016;30:762–772. [DOI] [PubMed] [Google Scholar]
- 14.Carlson HL, MacMaster FP, Harris AD, Kirton A. Spectroscopic biomarkers of motor cortex developmental plasticity in hemiparetic children after perinatal stroke. Hum Brain Mapp 2017;38:1574–1587. [DOI] [PMC free article] [PubMed] [Google Scholar]
- 15.Yu S, Carlson HL, Mineyko A, et al. Bihemispheric alterations in myelination in children following unilateral perinatal stroke. Neuroimage Clin 2018;20:7–15. [DOI] [PMC free article] [PubMed] [Google Scholar]
- 16.Ilves N, Ilves P, Laugesaar R, et al. Resting-state functional connectivity and cognitive impairment in children with perinatal stroke. Neural Plast 2016;2016:2306406. [DOI] [PMC free article] [PubMed] [Google Scholar]
- 17.Saunders J, Carlson HL, Cortese F, Goodyear BG, Kirton A. Imaging functional motor connectivity in hemiparetic children with perinatal stroke. Hum Brain Mapp 2019;40:1632–1642. [DOI] [PMC free article] [PubMed] [Google Scholar]
- 18.Woodward KE, Carlson HL, Kuczynski A, Saunders J, Hodge J, Kirton A. Sensory-motor network functional connectivity in children with unilateral cerebral palsy secondary to perinatal stroke. Neuroimage Clin 2019;21:101670. [DOI] [PMC free article] [PubMed] [Google Scholar]
- 19.Basser PJ. Inferring microstructural features and the physiological state of tissues from diffusion-weighted images. NMR Biomed 1995;8:333–344. [DOI] [PubMed] [Google Scholar]
- 20.Basser PJ, Pajevic S, Pierpaoli C, Duda J, Aldroubi A. In vivo fiber tractography using DT-MRI data. Magn Reson Med 2000;44:625–632. [DOI] [PubMed] [Google Scholar]
- 21.Englander ZA, Pizoli CE, Batrachenko A, et al. Diffuse reduction of white matter connectivity in cerebral palsy with specific vulnerability of long range fiber tracts. Neuroimage Clin 2013;2:440–447. [DOI] [PMC free article] [PubMed] [Google Scholar]
- 22.Englander ZA, Sun J, Case L, Mikati MA, Kurtzberg J, Song AW. Brain structural connectivity increases concurrent with functional improvement: evidence from diffusion tensor MRI in children with cerebral palsy during therapy. Neuroimage Clin 2015;7:315–324. [DOI] [PMC free article] [PubMed] [Google Scholar]
- 23.Biggs N, Lloyd E, Wislon R. Graph Theory, 1736-1936. Oxford: Oxford University Press; 1986. [Google Scholar]
- 24.Fornito A, Zalesky A, Breakspear M. The connectomics of brain disorders. Nat Rev Neurosci 2015;16:159–172. [DOI] [PubMed] [Google Scholar]
- 25.Cole L, Dewey D, Letourneau N, et al. Clinical characteristics, risk factors, and outcomes associated with neonatal hemorrhagic stroke: a population-based case-control study. JAMA Pediatr 2017;171:230–238. [DOI] [PubMed] [Google Scholar]
- 26.Patenaude B, Smith SM, Kennedy DN, Jenkinson M. A Bayesian model of shape and appearance for subcortical brain segmentation. Neuroimage 2011;56:907–922. [DOI] [PMC free article] [PubMed] [Google Scholar]
- 27.Smith RE, Tournier JD, Calamante F, Connelly A. Anatomically-constrained tractography: improved diffusion MRI streamlines tractography through effective use of anatomical information. NeuroImage 2012;62:1924–1938. [DOI] [PubMed] [Google Scholar]
- 28.Jenkinson M, Bannister P, Brady M, Smith S. Improved optimization for the robust and accurate linear registration and motion correction of brain images. Neuroimage 2002;17:825–841. [DOI] [PubMed] [Google Scholar]
- 29.Tournier JD, Calamante F, Connelly A. MRtrix: diffusion tractography in crossing fiber regions. Int J Imaging Syst Technol 2012;22:53–66. [Google Scholar]
- 30.Tzourio-Mazoyer N, Landeau B, Papathanassiou D, et al. Automated anatomical labeling of activations in SPM using a macroscopic anatomical parcellation of the MNI MRI single-subject brain. Neuroimage 2002;15:273–289. [DOI] [PubMed] [Google Scholar]
- 31.Wang J, Wang X, Xia M, Liao X, Evans A, He Y. GRETNA: a graph theoretical network analysis toolbox for imaging connectomics. Front Hum Neurosci 2015;9:386. [DOI] [PMC free article] [PubMed] [Google Scholar]
- 32.Rubinov M, Sporns O. Complex network measures of brain connectivity: uses and interpretations. NeuroImage 2010;52:1059–1069. [DOI] [PubMed] [Google Scholar]
- 33.Newman MEJ. Assortative mixing in networks. Phys Rev Lett 2002;89:208701. [DOI] [PubMed] [Google Scholar]
- 34.Ravasz E, Barabási AL. Hierarchical organization in complex networks. Phys Rev E 2003;67:026112. [DOI] [PubMed] [Google Scholar]
- 35.Krumlinde-Sundholm L. Reporting outcomes of the Assisting Hand Assessment: what scale should be used? Dev Med Child Neurol 2012;54:807–808. [DOI] [PubMed] [Google Scholar]
- 36.Randall M, Johnson LM, Reddihough D. The Melbourne Assessment of Unilateral Upper Limb Function. Melbourne: Royal Children’s Hospital; 1999. [Google Scholar]
- 37.Mathiowetz V, Volland G, Kashman N, Weber K. Adult norms for the box and block test of manual dexterity. Am J Occup Ther 1985;39:386–391. [DOI] [PubMed] [Google Scholar]
- 38.Elizabeth Reedman S, Beagley S, Sakzewski L, Boyd RN. The Jebsen Taylor test of hand function: a pilot test-retest reliability study in typically developing children. Phys Occup Ther Pediatr 2016;36:292–304. [DOI] [PubMed] [Google Scholar]
- 39.Kirton A. Advancing non-invasive neuromodulation clinical trials in children: lessons from perinatal stroke. Eur J Paediatr Neurol 2017;21:75–103. [DOI] [PubMed] [Google Scholar]
- 40.Kirton A, Andersen J, Herrero M, et al. Brain stimulation and constraint for perinatal stroke hemiparesis: the PLASTIC CHAMPS Trial. Neurology 2016;86:1659–1667. [DOI] [PMC free article] [PubMed] [Google Scholar]
- 41.Kirton A, Ciechanski P, Zewdie E, et al. Transcranial direct current stimulation for children with perinatal stroke and hemiparesis. Neurology 2017;88:259–267. [DOI] [PubMed] [Google Scholar]
- 42.Gillick BT, Feyma T, Menk J, et al. Safety and feasibility of transcranial direct current stimulation in pediatric hemiparesis: a randomized controlled pilot study. Phys Ther 2014;95:337–349. [DOI] [PMC free article] [PubMed] [Google Scholar]
- 43.Gillick BT, Friel KM, Menk J, Rudser K. Therapeutic brain stimulation trials in children with cerebral palsy. In: Kirton A, Gilbert DL, eds. Pediatric Brain Stimulation Mapping and Modulating the Developing Brain [online], 1st ed. Philadelphia: Elsevier; 2016:475. Available at: booksite.elsevier.com/9780128020012/. Accessed December 1, 2019. [Google Scholar]
- 44.Crofts JJ, Higham DJ, Bosnell R, et al. Network analysis detects changes in the contralesional hemisphere following stroke. Neuroimage 2011;54:161–169. [DOI] [PMC free article] [PubMed] [Google Scholar]
- 45.Toselli B, Tortora D, Severino M, et al. Improvement in white matter tract reconstruction with constrained spherical deconvolution and track density mapping in low angular resolution data: a pediatric study and literature review. Front Pediatr [online serial] 2017;5:182. [DOI] [PMC free article] [PubMed] [Google Scholar]
- 46.Civier O, Smith RE, Yeh CH, Connelly A, Calamante F. Is removal of weak connections necessary for graph-theoretical analysis of dense weighted structural connectomes from diffusion MRI? Neuroimage 2019;194:68–81. [DOI] [PubMed] [Google Scholar]
- 47.Hodge J, Goodyear B, Carlson H, Wei XC, Kirton A. Segmental diffusion properties of the corticospinal tract and motor outcome in hemiparetic children with perinatal stroke. J Child Neurol 2017;32:550–559. [DOI] [PubMed] [Google Scholar]
Associated Data
This section collects any data citations, data availability statements, or supplementary materials included in this article.
Data Availability Statement
Deidentified neuroimaging data will be available to qualified researchers upon a reasonable request.


