Abstract
Objective
To characterize lesion evolution and neurodegeneration in retinal vasculopathy with cerebral leukoencephalopathy and systemic manifestations (RVCL-S) using multimodal MRI.
Methods
We prospectively performed MRI and cognitive testing in RVCL-S and healthy control cohorts. Gray and white matter volume and disruption of white matter microstructure were quantified. Asymmetric spin echo acquisition permitted voxel-wise oxygen extraction fraction (OEF) calculation as an in vivo marker of microvascular ischemia. The RVCL-S cohort was included in a longitudinal analysis of lesion subtypes in which hyperintense lesions on fluid-attenuated inversion recovery (FLAIR), T1-postgadolinium, and diffusion-weighted imaging were delineated and quantified volumetrically.
Results
Twenty individuals with RVCL-S and 26 controls were enrolled. White matter volume and microstructure declined faster in those with RVCL–S compared to controls. White matter atrophy in RVCL-S was highly linear (ρ = −0.908, p < 0.0001). Normalized OEF was elevated in RVCL-S and increased with disease duration. Multiple cognitive domains, specifically those measuring working memory and processing speed, were impaired in RVCL-S. Lesion volumes, regardless of subtype, progressed/regressed with high variability as a function of age, while FLAIR lesion burden increased near time to death (p < 0.001).
Conclusion
RVCL-S is a monogenic microvasculopathy affecting predominantly the white matter with regard to atrophy and cognitive impairment. White matter volumes in RVCL-S declined linearly, providing a potential metric against which to test the efficacy of future therapies. Progressive elevation of white matter OEF suggests that microvascular ischemia may underlie neurodegeneration in RVCL-S.
Retinal vasculopathy with cerebral leukoencephalopathy and systemic manifestations (RVCL-S) is a familial microvasculopathy leading to early vision loss and progressive neurocognitive deterioration in the fourth to sixth decades, ultimately fatal within ≈10 years of symptom onset.1 The autosomal dominant disease is caused by a C-terminal frameshift mutation in TREX1 (a 3′–5′ repair exonuclease 1),2 with 40 families identified worldwide (M.K.L. and J.P.A., unpublished, 2018-2020). In 2016, a multicenter study defined the genetic and clinicopathologic spectra of the disease on the basis of aggregate data in 78 TREX1 mutation carriers from 11 unrelated families, proposing diagnostic criteria to increase recognition and to facilitate future studies.3
Despite recent progress, disease mechanisms in RVCL-S remain poorly defined. The TREX1 frameshift mutations produce a truncated TREX1 protein that lacks its anchor to the endoplasmic reticulum.2 A recent study described interactions between the TREX1 carboxy-terminal region and oligosaccharide transferase at the endoplasmic reticulum (organelle that promotes normal N-linked glycosylation).4 Experiments with knock-in mice and human cell lines demonstrated that expression of the truncated TREX1 protein dysregulated the oligosaccharide transferase complex, resulting in free glycan release, immune activation, and autoantibody production.4,5 Alternatively, the relatively small nuclear proportion of the truncated TREX1 protein, which harbors a functional 3′ DNase, is increased after apoptotic or genotoxic stress6; thus, genome stability may be compromised by unregulated activity of the misplaced DNase in its untethered state. Despite these potential disease mechanisms, it is unclear why the microvasculature is most markedly affected in RVCL-S. Immunohistochemistry studies in postmortem brain tissue from patients with RVCL-S and patients with stroke without RVCL-S demonstrated that TREX1 localizes predominantly to white matter Iba1+ microglia in association with the microvasculature near ischemic lesions, suggesting a role for TREX1 in response to ischemia.7
Due to the rarity of RVCL-S, it has been challenging to evaluate therapeutic efficacy when only a few patients can be tested and without a contemporaneous placebo arm. From the aggregate data above,3 cognitive and psychological impairments have been defined as present or absent by history and examination. MRI findings demonstrated (1) small/medium T2 hyperintense white matter lesions in all but 1 patient (97%), noting that some were associated with diffusion restriction or postcontrast enhancement, and (2) ring-enhancing pseudotumor lesions in 84%, which are frequently observed with advanced disease and may cause life-threatening mass effect due to vasogenic edema. Imaging studies in RVCL-S have been limited to small case series without controls,8–12 including a recent study of pseudotumor lesions in 6 patients that quantified the duration of diffusion restriction and ring enhancement across serial MRI scans.11
Defining pathogenesis in RVCL-S has been challenged by the inability of animal models to recapitulate the human disease phenotype.5 Brain MRI findings give some insight into mechanisms: punctate diffusion-restricting lesions support a role for microvascular ischemia, while nodular and ring-enhancing lesions suggest disruption of the blood-brain barrier. In support of ischemia, brain pathology in RVCL-S demonstrates a microvasculopathy associated with multilaminated basement membranes, mural thickening and hyalinization, luminal stenosis, and fibrinoid necrosis, which can resemble radiation necrosis.13 Chronic inflammatory cells may be seen near the microvasculature or rarely in the parenchyma.3,13 In postmortem brain tissue of patients with RVCL-S, TREX1 is readily detectable within microglia surrounding the white matter microvasculature, suggesting that TREX1 mislocalization may play a role in white matter vulnerability.7 While immune serologies are normal in patients, mouse models of RVCL-S induced a nonnuclear autoimmunity that was suppressed by a chemotherapeutic agent, suggesting that immune activation may contribute to pathogenesis or progression.4,5
In this study, we evaluated the temporal-spatial dynamics of neuroimaging features and cognitive performance from a prospective cohort of patients with RVCL-S compared to healthy controls. We sought to characterize neurodegeneration and lesion evolution to enable testing of future treatments against this natural history, to quantify domain-specific cognitive impairment, and to apply advanced MRI methods to reveal pathogenic mechanisms, hypothesizing that decreased cerebral blood flow (CBF) and increased oxygen extraction fraction (OEF) in RVCL-S would support the role of chronic microvascular ischemia.
Methods
Standard protocol approvals, registrations, and patient consents
The studies were approved by the institutional review board.
Study participants
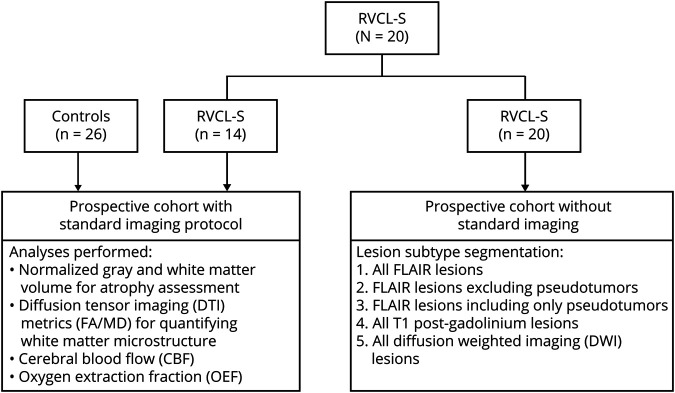
The studies included a prospective cohort with a standard imaging protocol and an older prospective cohort without standard imaging (figure 1 shows enrollment overview). For the recent cohort with standard imaging, we enrolled adults with genetically confirmed RVCL-S and age-matched controls. Exclusion criteria included contraindications to MRI and pregnancy. Controls were also excluded for history of neurologic or chronic illness. While controls had a single MRI scan, individuals with RVCL-S had 1 to 5 MRI scans during the study period, typically at 6- to 12-month intervals. Vital signs and laboratory samples, history of medications, and interim illness were obtained with each scan. Image analyses to measure atrophy, white matter microstructure, and metrics of blood flow and oxygen metabolism were performed only on scans acquired with the standard imaging protocol described below. The older cohort without standard imaging included individuals with RVCL-S who had been followed up at the Washington University RVCL Research Center (rvcl-research.wustl.edu/) over the past 2 decades in whom MRIs were obtained as part of standard clinical care. Longitudinal analyses evaluating lesion subtypes over time included all MRI scans in patients with RVCL-S (those performed with and without standard imaging).
Figure 1. Participant enrollment scheme.
Participants with retinal vasculopathy with cerebral leukoencephalopathy and systemic manifestations (RVCL-S) and healthy controls were prospectively enrolled with a standard imaging protocol. These participants had advanced MRI analyses to evaluate atrophy, white matter microstructure, and metrics of tissue ischemia (CBF, OEF). This RVCL-S cohort was enlarged to include patients with scans dating farther back (without standard imaging), who had been followed over many years. Given that these scans did not have a standard imaging protocol, only the lesion segmentation analysis was performed in the larger cohort. FA = fractional anisotropy; MD = mean diffusivity.
Common disease features in patients with RVCL-S were assessed by review of the patient's medical record and were present if documented by the treating physician at the Washington University RVCL Research Center. Common neuroradiologic features were present if described in the radiology report. Systemic features of RVCL-S were defined as: (1) liver disease if alanine transaminase, aspartate transaminase, or alkaline phosphatase was elevated beyond the laboratory reference range; (2) anemia if hemoglobin fell below the laboratory reference range; (3) nephropathy if serum creatinine or urine protein was elevated; (4) hypertension if the patient required daily antihypertensive medications; (5) hypothyroidism if the patient required thyroid replacement; and (6) Reynaud phenomenon if listed as a chart diagnosis.
Cognitive and psychological assessment
On the same day as the MRI scan, cognitive assessment was performed in participants undergoing the standard MRI protocol. Tests were selected on the basis of demonstrated reliability and sensitivity to decline in neurodegenerative diseases and included the Montreal Cognitive Assessment (MoCA), a global cognitive screening measure sensitive to executive impairment14; the Wechsler Adult Intelligence Scale–Revised Digit Symbol Substitution Test (DSST),15,16 for working memory and processing speed; category fluency17–19 (animal and vegetable naming) and the Bushcke and Grober Free and Cued Selective Reminding Test (FCSRT),20,21 for semantic and episodic memory, respectively; and Gait Speed,22 a measure of global cognitive and motor processing. Levels of depression and anxiety were assessed with the Geriatric Depression Scale23 and the State-Trait Anxiety Inventory,24 respectively.
Image protocol and processing
MRI acquisition, segmentation, and coregistration
For the standard imaging protocol, controls and participants with RVCL-S underwent brain MRI on a Siemens 3T Tim Trio or 3T Biograph mMR scanner (Erlangen, Germany) with a 12-channel head coil. Standard 3D magnetization-prepared rapid gradient-echo T1 (echo time/repetition time 2.95/1,800 milliseconds, inversion time 1,000 milliseconds, flip angle 8°, 1.0 × 1.0 × 1.0 mm), fluid-attenuated inversion recovery (FLAIR) (echo time/repetition time 93/9,000 milliseconds, inversion time 2,500 milliseconds, 1.0 × 0.9 × 3 mm). Magnetization-prepared rapid gradient-echo images were segmented into gray and white matter with Statistical Parametric Mapping version 12.25 Using FMRIB Software Library (FSL, Oxford University, Oxford, UK), we segmented subcortical nuclei with the FMRIB Integrated Registration and Segmentation Tool26 and coregistered images obtained within a scan session with the FMRIB Linear Image Registration Tool,27,28 with accuracy confirmed by visual inspection. Segmented brain volumes were normalized to total intracranial volume to adjust for head size, defined as the sum of gray matter, white matter, and CSF volumes.29
Diffusion tensor imaging
Diffusion tensor imaging was acquired as follows: echo time/repetition time 89/10,100 milliseconds and isotropic 2.0 × 2.0 × 2.0 mm. Twenty-five directions were acquired; b = 0 s/mm2 and b = 1,400 s/mm2 (field of view 224 mm). Diffusion tensor parametric maps including fractional anisotropy (FA) and mean diffusivity (MD) were calculated with the FSL diffusion toolbox (Oxford University).30 Individual mean FA and MD were measured in normal-appearing white matter (NAWM) after exclusion of voxels within the manually delineated FLAIR lesion mask (described below), such that only nonlesioned tissue was included.
CBF and OEF image acquisition and processing
We used a pseudocontinuous arterial spin labeling sequence (echo time/repetition time 12/3,780 milliseconds, 3.0 × 3.0 × 5.0 mm, 22 slices, number of averages 80, labeling duration 2,000 milliseconds, postlabel delay 1,500 milliseconds) to measure CBF.31 Blood T1 for CBF calculation was measured in the superior sagittal sinus of each participant as previously described.32,33 An asymmetric spin echo sequence measured tissue deoxyhemoglobin, permitting OEF quantification.34,35 CBF and OEF were calculated as previously described.36 Individual mean CBF and OEF within gray matter and white matter were calculated. To limit partial volume effects, voxels with <0.7 probability of being classified correctly as gray or white matter after T1 segmentation were removed, and a 1-voxel morphologic erosion between tissue types was applied. To account for participant-related systemic effects on whole-brain CBF and OEF such as anemia or age, white matter CBF and OEF were normalized to gray matter (nCBF and nOEF, respectively).
Lesion subtype segmentation
Five lesion subtypes were evaluated for hyperintensity: (1) all FLAIR lesions, (2) FLAIR lesions excluding pseudotumors, (3) FLAIR lesions including only pseudotumors, (4) all T1 postgadolinium lesions, and (5) all diffusion-weighted imaging (DWI) lesions. Hyperintense lesions were manually outlined by a vascular neurology fellow and board-certified neurologist (V.B.) and medical student (V.W.C.) and then reviewed and edited by a board-certified vascular neurologist (A.L.F.) using Medical Image Processing, Analysis, and Visualization software (mipav.cit.nih.gov/). Pseudotumors were defined as a central T1 ring-enhancing lesion located near the lateral ventricles that was associated with surrounding vasogenic edema on FLAIR. While FLAIR lesions were separated into 2 lesion subtypes based on being a pseudotumor or not (to separate out the effect of vasogenic edema on lesion volume), T1 postgadolinium lesions, also referred to as nodular contrast-enhancing lesions, were all included as a single lesion group because the volumes between the ring-enhancing central lesion of a pseudotumor and other enhancing lesions throughout the white matter do not differ significantly.
Statistical analysis
Statistical analyses were performed with SAS version 9.4 (SAS Institute Inc, Cary, NC). Data are described with median (interquartile range). A Wilcoxon rank-sum test compared RVCL-S and control cohorts for several neuroimaging outcomes: gray matter volume, white matter volume, FA, MD, nCBF, and nOEF. For all imaging analyses except lesion subtype analysis (described below) in which patients contributed multiple scan time points, the median imaging value and the corresponding median age from the scan time points were used. Raw p values were reported with significance noted after adjustment with the Benjamini-Hochberg procedure to maintain a family-wise error rate <0.05. To evaluate the independent effects of age, disease, and their interaction on neuroimaging outcomes, linear regression was performed. When criteria for normality were not met, data underwent natural logarithmic transformation, and multivariate normality was retested. The interaction term was included if significant at p < 0.05; otherwise, the interaction term was removed.
For cognitive and psychological analyses, a Wilcoxon rank-sum test compared the RVCL-S and control cohorts. Age at testing and years of education were compared. For participants with RVCL-S with multiple cognitive assessments (performed before each MRI scan), the most recent test result was used. Because underlying depression and anxiety may affect cognitive performance,37–39 we evaluated whether RVCL-S predicted cognitive performance after adjusting for the Geriatric Depression Scale and State-Trait Anxiety Inventory scores. Two linear regression models, one adjusting for depression and one adjusting for anxiety, as predictors of each cognitive domain were performed separately (maximum 2 covariates per model) to avoid model overfitting.
Only the participants with RVCL-S with at least 3 scan time points over at least 30 months were included for the lesion subtype analysis. Of these 7 patients, 5 had known age at death, and 2 were still alive with age at death imputed as the median value from all patients with RVCL-S who had died. Repeated patient data were included as a random effect in all models. For models not meeting normality assumptions, data underwent transformation before regression with the natural logarithmic function or nonlinear fits, as needed. Across all study analyses, results were presented only if valid without collinearity and with normal residuals.
Data availability
Data are available on request to the corresponding author.
Results
Cohort characteristics
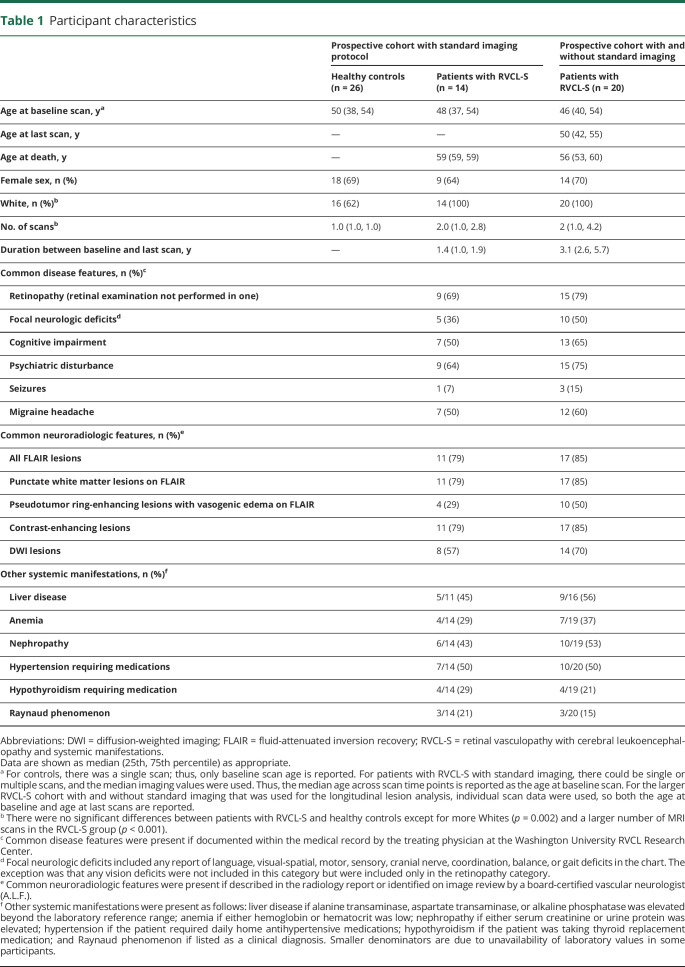
For the prospective study with the standard MRI protocol, 14 individuals with RVCL-S and 26 age-matched healthy controls were enrolled. An additional 6 patients with RVCL-S did not have any standard imaging, and this larger cohort (n = 20) was used for the longitudinal lesion analysis. Baseline characteristics for the study cohorts are shown in table 1. Individuals from 6 unrelated families with RVCL-S were represented, with 18 of 20 individuals carrying the most common TREX1 mutation, V235fs, while 2 individuals carried the T250Nfs mutation.3 There were no differences in age or sex between the controls and participants with RVCL-S; however, there was a greater percentage of Whites (p = 0.002) and more MRI scans performed (p < 0.001) in the RVCL-S cohort.
Table 1.
Participant characteristics
White matter volume and microstructure decline faster in RVCL-S
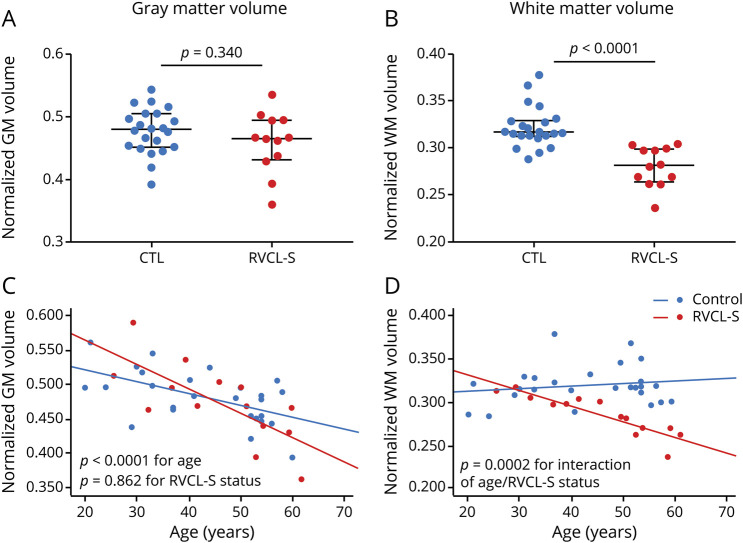
While atrophy in RVCL-S has been noted qualitatively on brain imaging, tissue-type atrophy and disruption in white matter microstructure have not previously been quantified in RVCL-S. Because lesions occur most commonly, yet not exclusively, in white matter, we hypothesized that white matter would demonstrate greater atrophy in RVCL-S, even after accounting for lesion volume and that rate of decline would be greater than that in age-matched controls. White matter volumes, normalized to intracranial volume, were reduced in patients with RVCL-S compared to controls (0.281 vs 0.316, respectively; p < 0.0001), whereas normalized gray matter volumes did not differ between the 2 cohorts (0.466 in patients vs 0.480 in controls; p = 0.340) (figure 2, A and B). Because tissue segmentation techniques are based on T1 imaging and may misclassify lesioned tissue within white matter as gray matter, we compared white matter volumes between patients with RVCL-S and controls after adding the lesion volume for each participant's scan to the white matter volume to account for this potential misclassification (patient example of misclassification is shown in figure S1, data available from Dryad, dryad.org/10.5061/dryad.stqjq2c0j). This was performed in participants with RVCL-S and controls alike, although the control participants were free of risk factors and were not elderly and therefore had very small lesion burden (median white matter lesion volume 0.0 [0.0–0.05] cm3). After doing so, we continued to find reduced normalized white matter volumes in participants with RVCL-S compared to controls (0.283 vs 0.316, respectively; p < 0.0001).
Figure 2. White matter, but not gray matter, atrophy is accelerated in RVCL-S.
(A) Normalized gray matter (GM) volumes did not differ between healthy controls (CTLs) and individuals with retinal vasculopathy with cerebral leukoencephalopathy and systemic manifestations (RVCL-S). (B) Normalized white matter (WM) volumes were significantly lower in those with RVCL-S compared to CTLs (p < 0.0001). (C) Rate of GM atrophy did not differ between CTLs and individuals with RVCL-S. (D) Rate of WM atrophy was faster in individuals with RVCL-S compared to CTLs (p = 0.0002 for interaction of age and RVCL-S status).
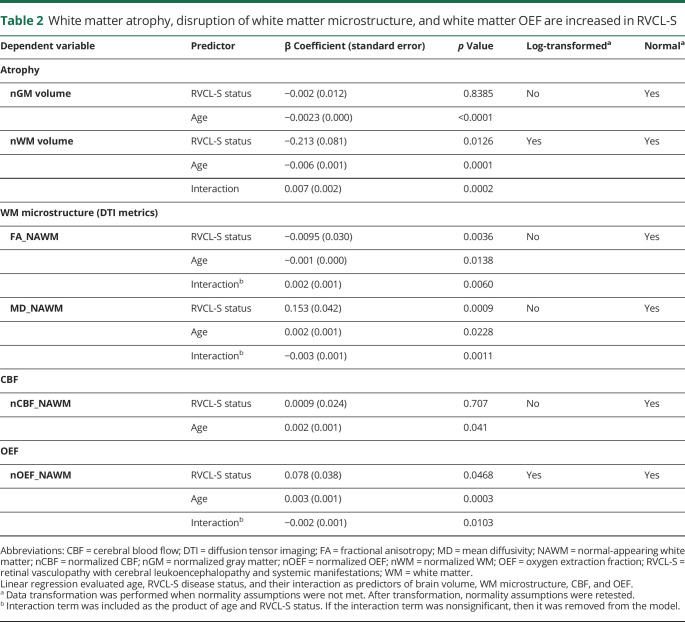
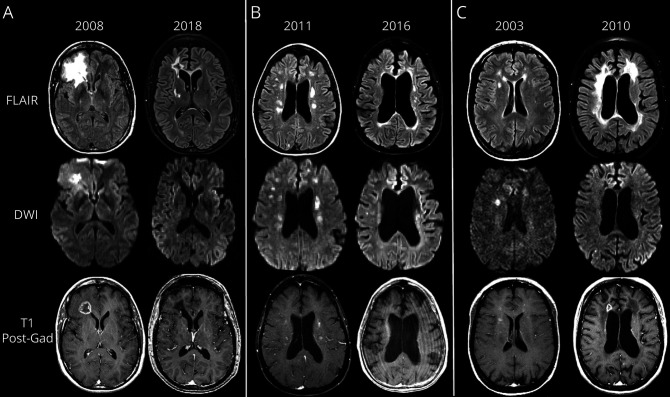
We next evaluated the relationship of tissue-type atrophy as a function of age and disease status. The rate of decline in white matter volume was faster in participants with RVCL-S compared to controls (p = 0.0002 for the interaction of age and RVCL-S status), while rate of gray matter atrophy did not differ between the 2 cohorts (figure 2, C and D and table 2). Furthermore, the decline in normalized white matter volume in the RVCL-S cohort (n = 14) was highly linear (Spearman ρ = −0.908, p < 0.0001) compared to controls (ρ = −0.051, p = 0.806). In figure 3, 3 patient examples with sequential images spanning 5 to 10 years demonstrate cerebral atrophy qualitatively; however, by visual inspection, it is unclear whether atrophy affects gray matter, white matter, or both. For these 3 patients, quantitative white matter volumes decreased over time (relative decrease 23.5%–29.6% from baseline) compared to gray matter (relative decrease −4.4% to 6.4% from baseline).
Table 2.
White matter atrophy, disruption of white matter microstructure, and white matter OEF are increased in RVCL-S
Figure 3. Progression in cerebral atrophy and evolution of lesion subtypes in RVCL-S.
Top row shows fluid-attenuated inversion recovery (FLAIR) images; middle row shows diffusion-weighted imaging (DWI) images; bottom row shows T1 postgadolinium images. (A) A 45-year-old woman with retinal vasculopathy with cerebral leukoencephalopathy and systemic manifestations (RVCL-S) demonstrated a pseudotumor adjacent to the right frontal horn. The pseudotumor demonstrates an underlying ring-enhancing lesion on T1 postgadolinium with central hyperintensity on DWI and surrounding vasogenic edema on FLAIR. MRI scan a decade later demonstrates that the previous pseudotumor is inactive without central diffusion restriction, contrast enhancement, or significant vasogenic edema on FLAIR. Diffuse central > peripheral atrophy is prominent, and additional white matter lesions have developed a decade after the baseline MRI. (B) MRI scan of a 54-year-old woman with RVCL-S shows multiple subcortical and periventricular white matter lesions, several which are hyperintense on DWI and a few of which show nodular enhancement on T1 postgadolinium. Five years later, her MRI scan just before death demonstrates a relative decrease/regression in number and overall burden of white matter lesions on FLAIR, DWI, and T1 postgadolinium, with greater lesion burden near the ventricles and less within the subcortical white matter; however, substantial atrophy (central and peripheral) has progressed over the 5 years before death. Sequential neuroimaging on this patient never revealed any pseudotumors. (C) A 43-year-old woman with RVCL-S demonstrates periventricular and subcortical white matter lesions on FLAIR imaging, several, but not all, of which are bright on DWI and show nodular enhancement on T1 postgadolinium. Follow-up MRI scan 7 years later near the time of death shows substantial progression in FLAIR lesion burden with overall decrease in DWI hyperintense lesions. Furthermore, nodular enhancement of white matter lesions has diminished, but a ring-enhancing pseudotumor lesion has appeared adjacent to the right frontal horn. Notably, there is substantial progression of atrophy (central > peripheral) over the 7-year interval.
Next, we evaluated the decrease in FA and increase in MD with age as metrics of disrupted white matter microstructure and that have been found to precede the development of white matter hyperintensities in sporadic cerebral small vessel disease (cSVD).40,41 We measured the effect of RVCL-S disease status on FA and MD in NAWM after adjusting for age. The reduction in FA (p = 0.0060) and increase in MD (p = 0.0011) were faster in participants with RVCL-S compared to controls (p values given for interaction of age and disease status) (table 2).
White matter OEF is elevated in RVCL-S and increases with disease duration
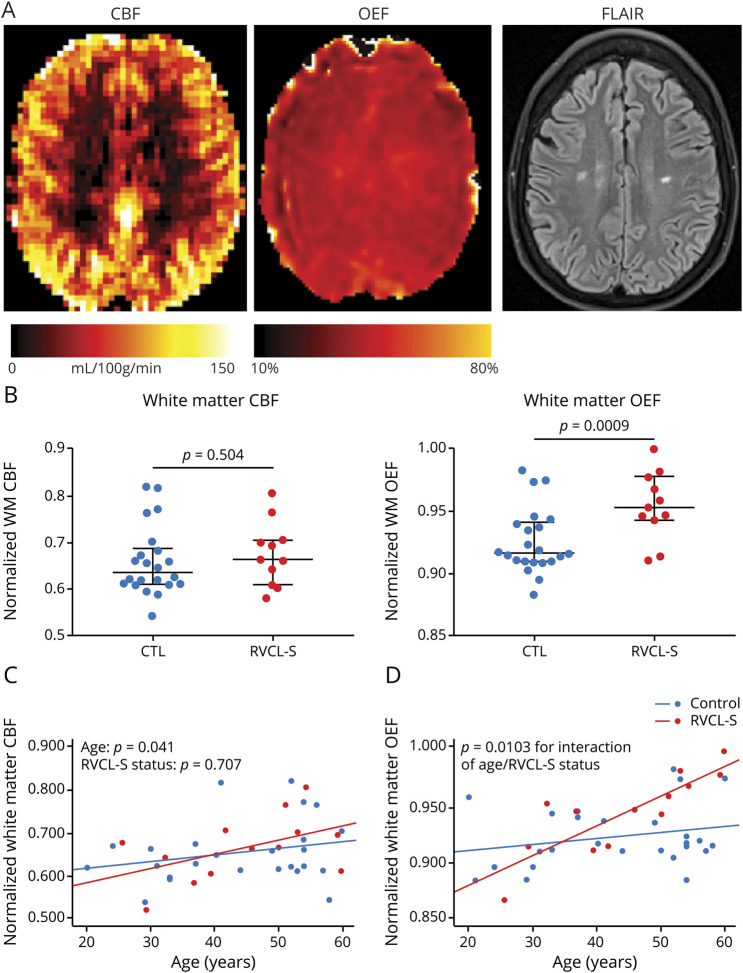
While the mechanisms underlying retinal and neurodegeneration in RVCL-S are unclear, pathologic findings consistently demonstrate a small vessel vasculopathy associated with multilaminated basement membranes, mural thickening and hyalinization, luminal stenosis, and fibrinoid necrosis.3,13 To investigate in vivo signs of small vessel ischemia in RVCL-S, we measured voxel-wise CBF and OEF. We hypothesized that white matter CBF may be decreased while OEF would be increased in patients with RVCL-S compared to healthy controls. Representative CBF and OEF maps in a patient with RVCL-S are shown in figure 4A. While nCBF in NAWM did not differ between the 2 cohorts, nOEF in NAWM was higher in patients with RVCL-S compared to controls (p = 0.009; figure 4B). We further evaluated whether nCBF decreased and nOEF increased over time, suggestive of progressive white matter ischemia with disease duration. The interaction of age and RVCL-S status predicted increasing OEF in NAWM (p = 0.0103), while the interaction did not predict change in CBF (figure 4, C and D, and table 2). The progressive elevation in white matter OEF with disease duration may indicate chronic small vessel ischemia as an underlying disease mechanism.
Figure 4. White matter OEF increases with disease duration and may indicate progressive microvascular ischemia.
(A) Representative cerebral blood flow (CBF), oxygen extraction fraction (OEF), and fluid-attenuated inversion recovery (FLAIR) maps in an individual with retinal vasculopathy with cerebral leukoencephalopathy and systemic manifestations (RVCL-S). (B) Normalized white matter OEF (nOEF_NAWM), but not normalized white matter CBF (nCBF_NAWM), was significantly elevated in patients with RVCL-S compared to healthy controls (CTLs). (C) nOEF_NAWM progressively increased in participants with RVCL-S compared to CTLs (p = 0.0103); however, rate of change in nCBF_NAWM was not different in those with RVCL-S compared to CTLs.
Cognitive and psychological assessment in RVCL-S
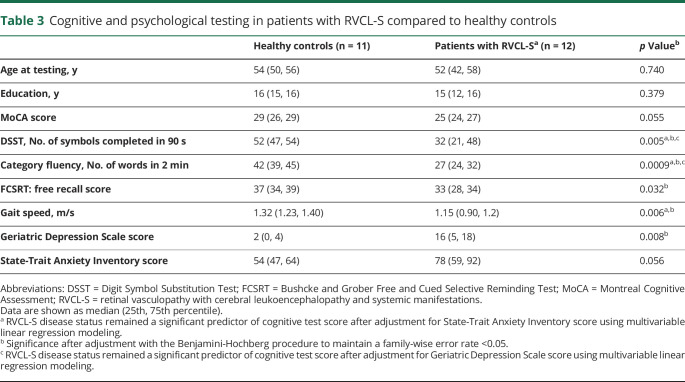
While individuals with RVCL-S may develop lacunar stroke with acute focal neurologic deficits, more commonly, individuals experience subclinical cognitive decline.3 It has been unclear which cognitive domains are most affected in RVCL-S and how underlying depression and anxiety affect cognitive performance. A standard cognitive assessment was performed in 12 and 11 participants in the RVCL-S and control cohorts, respectively (table 3). There were no differences in age at testing (p = 0.740) and years of education (p = 0.379) in the cohorts undergoing cognitive testing. Of the items tested, semantic memory (tested as category fluency or the number of animals and vegetables named in 2 minutes) demonstrated the greatest difference between cohorts, with a median of 27 words in participants with RVCL-S and 42 words in controls (p = 0.0009). Participants with RVCL-S scored lower on processing speed measured by DSST (p = 0.005) and gait speed (p = 0.006). On psychological evaluation, the Geriatric Depression Scale score was higher (p = 0.008) with a nonsignificant increase in State-Trait Anxiety Inventory scores (p = 0.056) in those with RVCL-S. Given that increased depression and anxiety affect cognitive performance, we evaluated whether RVCL-S was an independent predictor of cognitive impairment after adjusting for the Geriatric Depression Scale and State-Trait Anxiety Inventory scores in separate models. When adjusted for depression, RVCL-S remained an independent predictor of semantic fluency (β [95% confidence intervals] = −12.3 [−5.3 to −19.3], p = 0.002) and processing speed (DSST score) (β = −13.1 [−1.4 to −24.8]; p = 0.030) but did not independently predict MoCA score, FCSRT score, or gait speed. When adjusted for anxiety, RVCL-S remained independently predictive of semantic memory (β = −12.9 [−6.4 to −19.4]; p = 0.0006), DSST score (β = −16.4 [−5.1 to −27.8]; p = 0.007), and gait speed (β = −0.266 [−0.025 to −0.506]; p = 0.032) but did not independently predict MoCA or FCSRT score.
Table 3.
Cognitive and psychological testing in patients with RVCL-S compared to healthy controls
Burden of FLAIR lesions in RVCL-S increases near time to death
To evaluate the temporal evolution of lesion subtypes in RVCL-S, MRI scans from participants with RVCL-S (n = 20) were evaluated for hyperintensity across 5 lesion types: (1) all FLAIR lesions, (2) FLAIR lesions excluding pseudotumors, (3) FLAIR pseudotumor lesions only, (4) T1 postgadolinium lesions, and (5) DWI lesions. Figure 3 shows 3 individuals with RVCL-S and MRIs spanning 5 to 10 years, including representative maps for FLAIR (row 1), DWI (row 2), and T1 postgadolinium (row 3). The examples qualitatively demonstrate how FLAIR, DWI, and T1 gadolinium-enhancing lesions progress and regress over time.
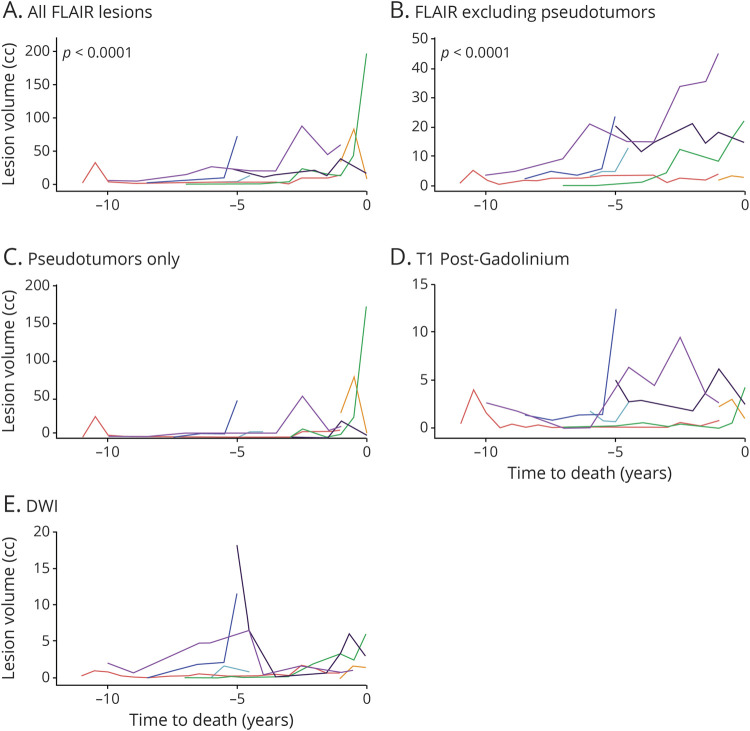
To evaluate whether total lesion volume changed with age or near time to death, individuals with ≥3 scan time points across a minimum of 30 months were included in linear regression analysis, with repeated patient data included as a random effect. Seven participants and 60 MRI scans were included with a median (interquartile range) between scans of 0.5 (0.4–1.0) years and total duration of imaging follow-up of 5 (3–6.5) years. Age as a predictor of lesion volume did not produce valid models with or without data transformation or nonlinear methods (data available from Dryad, figure S2, dryad.org/10.5061/dryad.stqjq2c0j). However, time to death was a significant predictor of lesion volume for all FLAIR lesions and for FLAIR lesions excluding pseudotumors (figure 5). FLAIR lesions including pseudotumors increased at a rate of 22%/y closer to death (p < 0.0001). Similarly, FLAIR lesions excluding pseudotumors increased at a rate of 15%/y closer to death (p < 0.0001). Models including time to death as a predictor of pseudotumors only, contrast-enhancing lesions, or DWI lesion burden were invalid without meeting normality assumptions even after data transformation. Of all lesion subtypes, DWI and contrast-enhancing lesions were the most common to regress.
Figure 5. Lesions in RVCL-S, regardless of subtype, progress/regress with high interparticipant variability.
Each line represents an individual patient. As time to death decreases, fluid-attenuated inversion recovery (FLAIR) lesion burden accelerates. To evaluate the temporal evolution of lesion subtypes in retinal vasculopathy with cerebral leukoencephalopathy and systemic manifestations (RVCL-S), MRI scans from 7 patients with RVCL-S who contributed ≥3 time points over at least 30 months were evaluated across 5 lesion subtypes. Time to death was evaluated as a predictor of lesion volume in linear regression analysis with repeated patient data included as a random effect. As time to death decreased, FLAIR lesion volumes increased, including (A) a 22% increase in lesion volume per year closer to death for all FLAIR lesions (p < 0.0001) and (B) a 15% increase in lesion volume per year closer to death for FLAIR lesions excluding pseudotumors. Time to death as a predictor of (C) pseudotumor lesion volume on FLAIR, (D) contrast-enhancing lesion volume, and (E) diffusion-weighted imaging (DWI) hyperintense lesion volume produced invalid models. Significant fluctuation in lesion burden for these last 3 lesion subtypes is evident, suggesting high interparticipant variability and limited sample size.
To evaluate the onset of lesion appearance in RVCL-S, lesion volumes were plotted across lesion subtypes as a function of age for the entire RVCL-S cohort (data available from Dryad, figure S3, dryad.org/10.5061/dryad.stqjq2c0j). Individuals were more likely to have brain lesions after 40 years of age regardless of lesion subtype; however, data are limited at younger ages. Five patients (including 9 MRI scans) at <40 years of age showed minimal FLAIR lesion burden (median [interquartile range] 0.16 [0.02–0.37] cm3), with 2 individuals having no brain lesions. Lesions were common after 40 years of age (median [interquartile range] 4.9 [1.5–18.3] cm3); 67 scans demonstrated ≥1 FLAIR lesions.
Discussion
RVCL-S is devastating and untreatable. Identifying effective therapies will likely require an in-depth understanding of molecular mechanisms. The current study provides the early stages of a neuroradiologic natural history of RVCL-S. By profiling participants across a wide age range, we modeled the rate of change in key neuroradiologic features such as cerebral atrophy, disruption of white matter microstructure, and lesion subtypes. Furthermore, we obtained a standard cognitive battery in patients with RVCL-S and controls to determine which domains are affected most by the disease.
Prior studies have focused on lesion characterization in RVCL-S without attention to tissue-type atrophy. Our work reveals that white matter atrophy is a prominent feature in RVCL-S. Indeed, the decline in white matter volumes occurred earlier than expected, appearing to diverge from controls between 30 and 40 years of age, before substantial lesion development (figure 2 and table 2), suggesting earlier onset of microstructural disease than previously known. Moreover, the decline in white matter volume with age was highly linear, suggesting that normalized white matter volume could provide a metric to demonstrate slowed neurodegeneration in future clinical trials. Such a neuroimaging outcome has previously been unavailable for the therapies that have been suggested or tried.3,4,42
Prior studies have reported the prevalence of cognitive (56%) and psychological (42%) impairment by chart review.3 Our findings demonstrate impairment in specific cognitive domains, with the largest impairments identified for timed tests of working memory and processing speed (table 3). It is likely that the white matter injury observed in RVCL-S may be contributing to deterioration in processing and psychomotor speed, as has been shown in other neurodegenerative diseases characterized by white matter changes.43–46 The Geriatric Depression Scale score was significantly higher in RVCL-S, which negatively affects processing speed, although semantic fluency and processing speed continued to be affected by RVCL-S even after adjustment for underlying depression and anxiety.
The largest cohort of RVCL-S has previously been described with a high prevalence of both small/medium FLAIR hyperintensities and ring-enhancing pseudotumors.3 We in addition found that regardless of pseudotumors, patients demonstrate nodular contrast-enhancing lesions in 84% and DWI hyperintense lesions in 68%. The appearance of small, subcortical DWI hyperintense and contrast-enhancing lesions that appear and regress over time may suggest chronic, progressive microvascular ischemia. While the contrast-enhancing and DWI lesion burden fluctuated over time and was not predicted by age or time to death, the FLAIR lesions accumulated significantly and nonlinearly as time to death decreased (figure 5). Assessing the rate of FLAIR lesion progression may assist in determining the prognosis or appropriate treatments targeting later stages of disease. Finally, we found that FLAIR lesion volumes were very low before 40 years of age (data available from Dryad, figure S3, dryad.org/10.5061/dryad.stqjq2c0j). This finding is limited by having only 5 patients imaged before 40 years of age; however, low lesion volumes were also identified in a cohort of 33 mutation carriers from the Netherlands in whom FLAIR lesion volume in individuals <40 years of age (n = 11) was 0.19 cm3, similar to our median volume of 0.16 cm3.47
White matter OEF was elevated in the RVCL-S cohort, which increased over time (figure 4), suggesting chronic ischemia as a likely pathogenic mechanism. Regional elevation in cerebral OEF measured by brain MRI or PET has provided a biomarker of ischemic vulnerability in several clinical settings such as carotid occlusive disease,48 acute ischemic stroke,49 and sickle cell anemia.36,50 Along with other advanced MRI methods that provide biomarkers of in vivo pathophysiology such as quantifying cerebrovascular reactivity and white matter microstructure, we propose that regional OEF may provide a metric of microvascular health in RVCL-S and other forms of cSVD. In support of our findings implicating chronic microvascular ischemia, pathologic studies have described a small vessel vasculopathy in RVCL-S associated with multilaminated basement membranes, mural thickening and hyalinization, luminal stenosis, and fibrinoid necrosis. Consistent with a selective vulnerability of white matter in RVCL-S, Kothari et al.7 demonstrated numerous TREX1-expressing microglia in association with the microvasculature in both lesioned white matter and NAWM, but much less so in gray matter. In support of an endothelial activation phenotype in RVCL-S, von Willebrand factor antigen and propeptide, and angiopoietin-2 were elevated in 3 Dutch families with RVCL-S.e51 Another study evaluated vascular reactivity by measuring flow-mediated dilation of the brachial artery, finding a reduction in percent change in arterial diameter in patients with RVCL-S.e52 Therefore, increasing evidence suggests endothelial damage and ischemia as underlying pathogenic mechanisms, with a potential role for TREX1-expressing microglia or macrophages.7
Unexpectedly, we found that white matter CBF was not lower in patients with RVCL-S compared to controls. We postulate that ischemia early in disease leads to regions of impaired vascular autoregulation that prevent the tissue from finely regulating CBF, leading to greater fluctuations in CBF but not a net lower CBF. Local inability to regulate CBF may lead to intermittent ischemia when systemic blood pressure fluctuations drop local CBF, leading to a compensatory elevation in regional OEF and eventually tissue infarction. Similar to our findings, in sporadic cSVD, CBF in NAWM has typically not been low compared to controls.e53,e54 Measures of degree of impairment in cerebral vasoreactivity, but not baseline CBF, have been predictive of disease progression in sporadic and in another inherited cSVD, cerebral autosomal dominant arteriopathy with subcortical infarcts and leukoencephalopathy (CADASIL).e55−e57
As one of several monogenic microvasculopathies, RVCL-S may provide an additional cSVD model to study vascular contributions to dementia as the second leading cause of dementia and a key contributor to Alzheimer dementia.e58 Rapid neurodegeneration in RVCL-S may facilitate studies of the mechanisms and treatments for sporadic cSVD, which progresses later in life and over a longer duration. Microvascular pathology in genetic forms of cSVD such as RVCL-S and CADASIL has demonstrated findings qualitatively similar to those seen in sporadic cSVD but with more severe pathology seen in the hereditary forms,e59 suggesting that cSVD of diverse origins may have a common final pathway toward microvasculopathy and white matter degeneration.
Given the rarity of RVCL-S with <200 individuals identified worldwide, our work provides a relatively large cohort scanned with standard imaging at multiple time points. However, there are limitations to consider. First, rates of white matter volume, DTI, CBF, and OEF change were obtained by regressing median values per individual by age and disease status. This analysis was chosen (1) to reduce the noise that occurs in the setting of sequential imaging over a short duration and (2) because only single imaging sessions were obtained in the control cohort. We plan to acquire more data in both cohorts over a longer duration to confirm and improve the accuracy of our findings. Another limitation is that voxel-wise measurements of CBF using pseudocontinuous arterial spin labeling have low signal-to-noise ratio in the deep white matter, which may limit our ability to detect differences in white matter CBF between the 2 cohorts. Previous work has investigated this limitation, finding that the signal remains adequate for the majority of white matter.e60 Moreover, we used the recommended parameters that resulted from this work to optimize white matter signal. Future efforts to standardize neuroimaging protocols across RVCL-S centers worldwide may help expand and refine our findings. For example, in addition to white matter atrophy, there may be an increase in the rate of gray matter atrophy that may be detectable in larger cohorts. Furthermore, larger longitudinal imaging studies in RVCL-S cohorts will allow evaluation of the phenotypic variability such as how sex, kindred, mutation, and other vascular comorbid conditions affect the onset and progression of neurodegeneration and lesion evolution.
Acknowledgment
The authors thank the patients and families with RVCL-S and healthy controls who have participated in this research.
Glossary
- CADASIL
cerebral autosomal dominant arteriopathy with subcortical infarcts and leukoencephalopathy
- CBF
cerebral blood flow
- cSVD
cerebral small vessel disease
- DSST
Digit Symbol Substitution Test
- DWI
diffusion-weighted imaging
- FA
fractional anisotropy
- FCSRT
Free and Cued Selective Reminding Test
- FLAIR
fluid-attenuated inversion recovery
- MD
mean diffusivity
- MoCA
Montreal Cognitive Assessment
- NAWM
normal-appearing white matter
- nCBF
CBF normalized to gray matter
- nOEF
OEF normalized to gray matter
- OEF
oxygen extraction fraction
- RVCL-S
retinal vasculopathy with cerebral leukoencephalopathy and systemic manifestations
Appendix. Authors

Footnotes
Editorial, page 611
CME Course: NPub.org/cmelist
Study funding
This work was supported by Clayco Foundation, Energy 4 A Cure Foundation, Cure CRV Research, NIH: National Heart, Lung, and Blood Institute (R01HL129241, A.L.F. and H.A.), NIH: National Institute of Neurological Disorders and Stroke (R01NS116565, A.L.F. and H.A.), and Washington University St. Louis Clinical and Translational Science Award (UL1 TR000448, A.L.F.).
Disclosure
The authors report no disclosures relevant to the manuscript. Go to Neurology.org/N for full disclosures.
References
- 1.Grand MG, Kaine J, Fulling K, et al. Cerebroretinal vasculopathy: a new hereditary syndrome. Ophthalmology 1988;95:649–659. [DOI] [PubMed] [Google Scholar]
- 2.Richards A, van den Maagdenberg AM, Jen JC, et al. C-terminal truncations in human 3′-5′ DNA exonuclease TREX1 cause autosomal dominant retinal vasculopathy with cerebral leukodystrophy. Nat Genet 2007;39:1068–1070. [DOI] [PubMed] [Google Scholar]
- 3.Stam AH, Kothari PH, Shaikh A, et al. Retinal vasculopathy with cerebral leukoencephalopathy and systemic manifestations. Brain 2016;139:2909–2922. [DOI] [PMC free article] [PubMed] [Google Scholar]
- 4.Hasan M, Fermaintt CS, Gao N, et al. Cytosolic nuclease TREX1 regulates oligosaccharyltransferase activity independent of nuclease activity to suppress immune activation. Immunity 2015;43:463–474. [DOI] [PMC free article] [PubMed] [Google Scholar]
- 5.Sakai T, Miyazaki T, Shin DM, et al. DNase-active TREX1 frame-shift mutants induce serologic autoimmunity in mice. J Autoimmun 2017;81:13–23. [DOI] [PMC free article] [PubMed] [Google Scholar]
- 6.Lindahl T, Barnes DE, Yang YG, Robins P. Biochemical properties of mammalian TREX1 and its association with DNA replication and inherited inflammatory disease. Biochem Soc Trans 2009;37:535–538. [DOI] [PubMed] [Google Scholar]
- 7.Kothari PH, Kolar GR, Jen JC, et al. TREX1 is expressed by microglia in normal human brain and increases in regions affected by ischemia. Brain Pathol 2018;28:806–821. [DOI] [PMC free article] [PubMed] [Google Scholar]
- 8.Mateen FJ, Krecke K, Younge BR, et al. Evolution of a tumor-like lesion in cerebroretinal vasculopathy and TREX1 mutation. Neurology 2010;75:1211–1213. [DOI] [PMC free article] [PubMed] [Google Scholar]
- 9.Raynowska J, Miskin DP, Pramanik B, et al. Retinal vasculopathy with cerebral leukoencephalopathy (RVCL): a rare mimic of tumefactive MS. Neurology 2018;91:e1423–e1428. [DOI] [PubMed] [Google Scholar]
- 10.Vodopivec I, Oakley DH, Perugino CA, Venna N, Hedley-Whyte ET, Stone JH. A 44-year-old man with eye, kidney, and brain dysfunction. Ann Neurol 2016;79:507–519. [DOI] [PMC free article] [PubMed] [Google Scholar]
- 11.Hedderich DM, Lummel N, Deschauer M, et al. Magnetic resonance imaging characteristics of retinal vasculopathy with cerebral leukoencephalopathy and systemic manifestations. Clin Neuroradiol 2020;30:229–236. [DOI] [PubMed] [Google Scholar]
- 12.Dhamija R, Schiff D, Lopes MB, Jen JC, Lin DD, Worrall BB. Evolution of brain lesions in a patient with TREX1 cerebroretinal vasculopathy. Neurology 2015;85:1633–1634. [DOI] [PubMed] [Google Scholar]
- 13.Kolar GR, Kothari PH, Khanlou N, Jen JC, Schmidt RE, Vinters HV. Neuropathology and genetics of cerebroretinal vasculopathies. Brain Pathol 2014;24:510–518. [DOI] [PMC free article] [PubMed] [Google Scholar]
- 14.Dong Y, Xu J, Chan BP, et al. The Montreal Cognitive Assessment is superior to National Institute of Neurological Disease and Stroke-Canadian Stroke Network 5-minute protocol in predicting vascular cognitive impairment at 1 year. BMC Neurol 2016;16:46. [DOI] [PMC free article] [PubMed] [Google Scholar]
- 15.Gutierrez J, Marshall RS, Lazar RM. Indirect measures of arterial stiffness and cognitive performance in individuals without traditional vascular risk factors or disease. JAMA Neurol 2015;72:309–315. [DOI] [PMC free article] [PubMed] [Google Scholar]
- 16.Rosano C, Perera S, Inzitari M, Newman AB, Longstreth WT, Studenski S. Digit Symbol Substitution Test and future clinical and subclinical disorders of cognition, mobility and mood in older adults. Age Ageing 2016;45:688–695. [DOI] [PMC free article] [PubMed] [Google Scholar]
- 17.Andriuta D, Roussel M, Barbay M, et al. Differentiating between Alzheimer's disease and vascular cognitive impairment: is the "memory versus executive function" contrast still relevant? J Alzheimers Dis 2018;63:625–633. [DOI] [PubMed] [Google Scholar]
- 18.Takeda JRT, Matos TM, de Souza-Talarico JN. Cardiovascular risk factors and cognitive performance in aging. Dement Neuropsychol 2017;11:442–448. [DOI] [PMC free article] [PubMed] [Google Scholar]
- 19.Zeki Al Hazzouri A, Vittinghoff E, Sidney S, Reis JP, Jacobs DR Jr, Yaffe K. Intima-media thickness and cognitive function in stroke-free middle-aged adults: findings from the Coronary Artery Risk Development in Young Adults Study. Stroke 2015;46:2190–2196. [DOI] [PMC free article] [PubMed] [Google Scholar]
- 20.Epelbaum S, Benisty S, Reyes S, et al. Verbal memory impairment in subcortical ischemic vascular disease: a descriptive analysis in CADASIL. Neurobiol Aging 2011;32:2172–2182. [DOI] [PubMed] [Google Scholar]
- 21.Grober E, Gitlin HL, Bang S, Buschke H. Implicit and explicit memory in young, old, and demented adults. J Clin Exp Neuropsychol 1992;14:298–316. [DOI] [PubMed] [Google Scholar]
- 22.Fritz S, Lusardi M. White paper: "walking speed: the sixth vital sign." J Geriatr Phys Ther 2009;32:46–49. [PubMed] [Google Scholar]
- 23.Yesavage JA, Brink TL, Rose TL, et al. Development and validation of a Geriatric Depression Screening Scale: a preliminary report. J Psychiatr Res 1982;17:37–49. [DOI] [PubMed] [Google Scholar]
- 24.Gaudry E, Vagg P, Spielberger CD. Validation of the state-trait distinction in anxiety research. Multivariate Behav Res 1975;10:331–341. [DOI] [PubMed] [Google Scholar]
- 25.Dell'Oglio E, Ceccarelli A, Glanz BI, et al. Quantification of global cerebral atrophy in multiple sclerosis from 3T MRI using SPM: the role of misclassification errors. J Neuroimaging 2015;25:191–199. [DOI] [PMC free article] [PubMed] [Google Scholar]
- 26.Patenaude B, Smith SM, Kennedy DN, Jenkinson M. A Bayesian model of shape and appearance for subcortical brain segmentation. NeuroImage 2011;56:907–922. [DOI] [PMC free article] [PubMed] [Google Scholar]
- 27.Jenkinson M, Smith S. A global optimisation method for robust affine registration of brain images. Med Image Anal 2001;5:143–156. [DOI] [PubMed] [Google Scholar]
- 28.Jenkinson M, Bannister P, Brady M, Smith S. Improved optimization for the robust and accurate linear registration and motion correction of brain images. Neuroimage 2002;17:825–841. [DOI] [PubMed] [Google Scholar]
- 29.Wardlaw JM, Smith EE, Biessels GJ, et al. Neuroimaging standards for research into small vessel disease and its contribution to ageing and neurodegeneration. Lancet Neurol 2013;12:822–838. [DOI] [PMC free article] [PubMed] [Google Scholar]
- 30.Behrens TE, Woolrich MW, Jenkinson M, et al. Characterization and propagation of uncertainty in diffusion-weighted MR imaging. Magn Reson Med 2003;50:1077–1088. [DOI] [PubMed] [Google Scholar]
- 31.Wu WC, Fernandez-Seara M, Detre JA, Wehrli FW, Wang J. A theoretical and experimental investigation of the tagging efficiency of pseudocontinuous arterial spin labeling. Magn Reson Med 2007;58:1020–1027. [DOI] [PubMed] [Google Scholar]
- 32.Jain V, Duda J, Avants B, et al. Longitudinal reproducibility and accuracy of pseudo-continuous arterial spin-labeled perfusion MR imaging in typically developing children. Radiology 2012;263:527–536. [DOI] [PMC free article] [PubMed] [Google Scholar]
- 33.Hales PW, Kirkham FJ, Clark CA. A general model to calculate the spin-lattice (T1) relaxation time of blood, accounting for haematocrit, oxygen saturation and magnetic field strength. J Cereb Blood Flow Metab 2016;36:370–374. [DOI] [PMC free article] [PubMed] [Google Scholar]
- 34.An H, Lin W. Impact of intravascular signal on quantitative measures of cerebral oxygen extraction and blood volume under normo- and hypercapnic conditions using an asymmetric spin echo approach. Magn Reson Med 2003;50:708–716. [DOI] [PubMed] [Google Scholar]
- 35.Lee JM, Vo KD, An H, et al. Magnetic resonance cerebral metabolic rate of oxygen utilization in hyperacute stroke patients. Ann Neurol 2003;53:227–232. [DOI] [PubMed] [Google Scholar]
- 36.Guilliams KP, Fields ME, Ragan DK, et al. Red cell exchange transfusions lower cerebral blood flow and oxygen extraction fraction in pediatric sickle cell anemia. Blood 2018;131:1012–1021. [DOI] [PMC free article] [PubMed] [Google Scholar]
- 37.Ehgoetz Martens KA, Silveira CRA, Intzandt BN, Almeida QJ. State anxiety predicts cognitive performance in patients with Parkinson's disease. Neuropsychology 2018;32:950–957. [DOI] [PubMed] [Google Scholar]
- 38.Hashem AH, Nasreldin M, Gomaa MA, Khalaf OO. Late versus early onset depression in elderly patients: vascular risk and cognitive impairment. Curr Aging Sci 2017;10:211–216. [DOI] [PubMed] [Google Scholar]
- 39.Mortamais M, Abdennour M, Bergua V, et al. Anxiety and 10-year risk of incident dementia-an association shaped by depressive symptoms: results of the prospective three-city study. Front Neurosci 2018;12:248. [DOI] [PMC free article] [PubMed] [Google Scholar]
- 40.Promjunyakul NO, Dodge HH, Lahna D, et al. Baseline NAWM structural integrity and CBF predict periventricular WMH expansion over time. Neurology 2018;90:e2119–e2126. [DOI] [PMC free article] [PubMed] [Google Scholar]
- 41.van Leijsen EMC, Bergkamp MI, van Uden IWM, et al. Progression of white matter hyperintensities preceded by heterogeneous decline of microstructural integrity. Stroke 2018;49:1386–1393. [DOI] [PubMed] [Google Scholar]
- 42.Kernt M, Gschwendtner A, Neubauer AS, Dichgans M, Haritoglou C. Effects of intravitreal bevacizumab treatment on proliferative retinopathy in a patient with cerebroretinal vasculopathy. J Neurol 2010;257:1213–1214. [DOI] [PubMed] [Google Scholar]
- 43.DeLuca J, Chelune GJ, Tulsky DS, Lengenfelder J, Chiaravalloti ND. Is speed of processing or working memory the primary information processing deficit in multiple sclerosis? J Clin Exp Neuropsychol 2004;26:550–562. [DOI] [PubMed] [Google Scholar]
- 44.Hsu YH, Huang CF, Lo CP, Wang TL, Yang CC, Tu MC. Frontal assessment battery as a useful tool to differentiate mild cognitive impairment due to subcortical ischemic vascular disease from Alzheimer disease. Dement Geriatr Cogn Disord 2016;42:331–341. [DOI] [PubMed] [Google Scholar]
- 45.Jacobs HI, Leritz EC, Williams VJ, et al. Association between white matter microstructure, executive functions, and processing speed in older adults: the impact of vascular health. Hum Brain Mapp 2013;34:77–95. [DOI] [PMC free article] [PubMed] [Google Scholar]
- 46.Turken A, Whitfield-Gabrieli S, Bammer R, Baldo JV, Dronkers NF, Gabrieli JD. Cognitive processing speed and the structure of white matter pathways: convergent evidence from normal variation and lesion studies. Neuroimage 2008;42:1032–1044. [DOI] [PMC free article] [PubMed] [Google Scholar]
- 47.Pelzer N, Hoogeveen ES, Haan J, et al. Systemic features of retinal vasculopathy with cerebral leukoencephalopathy and systemic manifestations: a monogenic small vessel disease. J Intern Med 2019;285:317–332. [DOI] [PubMed] [Google Scholar]
- 48.Derdeyn CP, Videen TO, Yundt KD, et al. Variability of cerebral blood volume and oxygen extraction: stages of cerebral haemodynamic impairment revisited. Brain 2002;125:595–607. [DOI] [PubMed] [Google Scholar]
- 49.Liu Z, Li Y. Cortical cerebral blood flow, oxygen extraction fraction, and metabolic rate in patients with middle cerebral artery stenosis or acute stroke. AJNR Am J Neuroradiol 2016;37:607–614. [DOI] [PMC free article] [PubMed] [Google Scholar]
- 50.Fields ME, Guilliams KP, Ragan DK, et al. Regional oxygen extraction predicts border zone vulnerability to stroke in sickle cell disease. Neurology 2018;90:e1134–e1142. [DOI] [PMC free article] [PubMed] [Google Scholar]
- References e51-e60 are available at Dryad, 10.5061/dryad.stqjq2c0j. [DOI]
Associated Data
This section collects any data citations, data availability statements, or supplementary materials included in this article.
Data Availability Statement
Data are available on request to the corresponding author.


