

Abstract
Objective
To understand how, biologically, the acute event of traumatic brain injury gives rise to a long-term disease, we address the relationship between evolving cortical and subcortical brain damage and measures of functional outcome and cognitive functioning at 6 months after injury.
Methods
For this longitudinal analysis, clinical and MRI data were collected in a tertiary neurointensive care setting in a continuous sample of 157 patients surviving moderate to severe traumatic brain injury between 2000 and 2018. For each patient, we collected T1- and T2-weighted MRI data acutely and at the 6-month follow-up, as well as acute measures of injury severity (Glasgow Coma Scale), follow-up measures of functional impairment (Glasgow Outcome Scale–extended), and, in a subset of patients, neuropsychological measures of attention, executive functions, and episodic memory.
Results
In the final cohort of 113 subcortical and 92 cortical datasets that survived (blind) quality control, extensive atrophy was observed over the first 6 months after injury across the brain. However, only atrophy within subcortical regions, particularly in the left thalamus, was associated with functional outcome and neuropsychological measures of attention, executive functions, and episodic memory. Furthermore, when brought together in an analytical model, longitudinal brain measurements could distinguish good from bad outcome with 90% accuracy, whereas acute brain and clinical measurements alone could achieve only 20% accuracy.
Conclusion
Despite great injury heterogeneity, secondary thalamic pathology is a measurable minimum common denominator mechanism directly relating biology to clinical measures of outcome and cognitive functioning, potentially linking the acute event and the longer-term disease of traumatic brain injury.
The long-term effects and neurological consequences of moderate-to-severe traumatic brain injury (TBI), including its association with cognitive, emotional, and behavioral dysfunction, are a source of increased concern.1,2 According to the TBI Model Systems National Database, of the patients who survive TBI, 22% die within 5 years, 30% have cognitive and behavioral declines, 22% show no amelioration, and only 26% demonstrate cognitive and behavioral improvements.3 Furthermore, patients with TBI are known to have increased risk of neurodegenerative disorders and mortality, with the latter potentially secondary to impairments such as executive dysfunction.4 Gaining a detailed understanding of the relationship between the acute event of TBI and its evolving consequences, including cortical and subcortical nonmechanic, time-delayed processes,5,6 functional outcomes,7–10 and cognitive impairment, is paramount for developing better prognostic models and interventions11 and for alleviating the emotional, social, and economic burden of TBI.12
Here, we present a large cohort, longitudinal study aimed at leveraging conventional clinical MRI data to assess the progression of cortical and subcortical brain damage and its relation to functional outcome and neuropsychological measures of attention, executive functions, and episodic memory at 6 months after injury. In addition, we compare the degree to which early and late demographic, clinical, and magnetic resonance (MR) data are associated with functional outcome and neuropsychological measurements at 6 months after injury. As described below, we find systematic relationships between thalamic atrophy, functional outcome, and measures of attention, executive functions, and episodic memory at 6 months, and we show that demographic and clinical data, together with MR brain measures, allow classifying—with up to 90% performance—good vs bad outcome and explain performance on neuropsychological assessments. Crucially, across all analyses, thalamic pathology appears to be the primary correlate of clinical measurements, consistent with current models of recovery from severe brain injury13 and with the phenotype observed in patients with profound long-term impairment after severe brain injury.8 These findings provide a potential explanatory link uniting the event of acute brain injury with the long-term disease.14–18
Methods
Sample
A continuous sample of 157 patients with moderate to severe TBI admitted to the Neurointensive Care Unit at the UCLA Ronald Reagan University Medical Center were enrolled in this longitudinal 2-time-point study. Patients were recruited over a time span of 18 years as part of the UCLA Brain Injury Research Center. Inclusion criteria were an admission Glasgow Coma Scale (GCS)19 score ≤8 or an admission GCS score of 9 to 14 with CT evidence of intracranial bleeding. Exclusion criteria were a GCS score >14 with nonsignificant head CT, history of neurologic disease or TBI, brain death, or unsuitability to enter the MR environment.
Standard protocol approvals, registrations, and patient consent
The study was approved by the UCLA Institutional Review Board, and informed assent and consent were obtained per state regulations.
Procedure
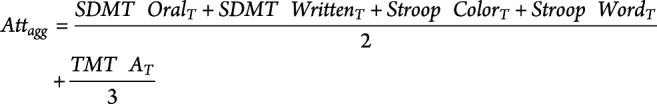
At each time point (acute and follow-up), we collected MRI and clinical data (i.e., GCS score and in-person Glasgow Outcome Scale–extended [GOSe] interview20 for the acute and follow-up sessions, respectively). A more detailed neuropsychological examination, including measures of attention, executive ability, and episodic memory and 2 tests of performance validity, was also administered at follow-up. Because this battery of tests was administered starting in the latter part of the study, only a (continuous) subset of 30 patients underwent such neuropsychological examination, including the Symbol Digit Modalities Test (SDMT) oral and written,21 the Stroop Color and Word Test (Golden version),22 the Trail Making Test (TMT) Parts A and B,23,24 and Trials 1 through 5, Short-Delay Free Recall (SDFR) T score, Long-Delay Free Recall (LDFR) T score, and Recognition Discriminability (RD) T scores from the California Verbal Learning Test, 2nd edition.25 Two tests of performance validity, the Rey 15 Item Test + Recognition26,27 and the Dot Counting Test,28 were also administered to ensure that the cognitive performances were valid.29 To improve the reliability of measured deficits, we combined representative T scores for individual neuropsychological tests into aggregate scores of attention, executive functions, and episodic memory, core TBI deficits30:
 |
 |
 |
MRI data acquisition
T1-weighted magnetization-prepared rapid gradient echo (MP-RAGE) (repetition time 2,250 milliseconds, echo time 2.299 milliseconds) and T2-weighted fluid-attenuated inversion recovery data (repetition time 8,000 milliseconds, echo time 70 milliseconds) data were acquired across multiple 3T (Siemens Allegra, Tim Trio, Prisma; Erlangen, Germany) and 1.5T (Siemens Avanto, Sonata) MRIs. Parameters differed across acquisitions and over time but always resulted in an approximate 1-mm3 resolution for the MP-RAGE and 0.5 × 0.5 × 3 mm for the fluid-attenuated inversion recovery data.
Shape analysis
As depicted in figure 1, T1- and T2-weighted data were combined in order to segment, on a single-patient/single-time-point basis, cortical and subcortical structures. Acute and follow-up segmentations were then entered into 2 sets of analyses: (1) brain shape analysis, a voxel-wise analysis assessing the relationship between cortical and subcortical shape change over time (i.e., acute to follow-up) and functional outcome at 6 months (i.e., GOSe score), as well as aggregate neuropsychological measures, and (2) modeling analysis, combining demographic, clinical, and brain shape data to classify good vs bad functional outcome and to explain neuropsychological performance at 6 months.
Figure 1. MRI data processing.

T1-weighted (T1-w) and T2-weighted (T2-w) magnetic resonance data were combined to allow extraction of average volumes (per region of interest [ROI]) and shape measures (per voxel). A = anterior; FLAIR = fluid-attenuated inversion recovery; MPRAGE = magnetization-prepared rapid gradient echo; P = posterior.
Subcortical data processing
Subcortical shape measures were calculated with the FMRIB software library (FSL),31 similar to previous work.8,10 In brief, MRIs were brain-extracted32 and then thalamus, caudate, putamen, pallidum, hippocampus, and brainstem were segmented31 for each patient, time point, and hemisphere separately. From each segmentation, we derived a 3D mesh used for shape analysis. Shape analysis can compare, for each mesh, the normal vector at each vertex across the 2 time points. Vertices moving inward over time are conventionally interpreted as atrophy; vertices moving outward are interpreted as tissue expansion.31 In addition, we calculated for each patient the normalized brain volume at each time point and the percent brain volume change over time33 to ensure that results reflect local shape change (e.g., local atrophy) as opposed to differences in head size or global atrophy (see elsewhere9,10). Overall, shape analysis of individual structures is a more fine-grained and sensitive analysis compared with simple volumetric approaches that calculate overall volume change within a structure; the latter approach is blinded to the exact location of the shape change, which, in structures such as thalamus, can lead to extremely different clinical presentations.13
Cortical data processing
To extract cortical shape (i.e., ribbon thickness) estimates, we used the longitudinal stream in FreeSurfer for skull stripping, spatial normalization, atlas coregistration, spherical surface mapping, and region of interest (ROI) parcellation, all performed on a within-participant template to increase reliability.
Longitudinal comparisons of shape measurements were performed within participants, while group analyses used a cohort-specific average template, which facilitates registration of severely damaged brains and allows removing pose and global scaling across different scanners. All segmentations were visually checked; 24 cortical datasets and 3 subcortical datasets were rejected due to poor segmentation quality before analysis and by investigators blinded to clinical and neuropsychological data.
Statistical analysis
After data processing, the reconstructed 3D meshes (i.e., shapes) were entered as dependent variables in 3 group analyses. First, we assessed average acute-to-follow-up shape change over time (henceforth time analysis). Second, we assessed the relationship between shape change and severity of impairment at 6 months (i.e., GOSe score; henceforth outcome analysis). Finally, we assessed the relationship between shape change and aggregate neuropsychological measures of attention, executive functions, and episodic memory at follow-up (henceforth cognitive impairment analysis). In all analyses, sex, age at injury, days after injury at acute and follow-up MRI, percent brain volume change, and MRI machine were included as covariates. Although our prior work suggests that including data from different MR systems does not significantly affect the results obtained with the present approach,8 we included acquisition site as a predictor variable in the group analysis to confirm that there were no significant associations or interactions with subcortical and cortical change.34 Significance was assessed with nonparametric permutation testing at p < 0.05 corrected for multiple comparisons using a family-wise cluster correction as implemented in FSL (with threshold-free cluster enhancement) and Freesurfer.35,36
Modeling analysis
In the modeling analysis, we combine demographic, clinical, and experimental (e.g., days after injury at follow-up) variables with acute, follow-up, and change (i.e., acute-to-follow-up) shape measures to classify good/bad functional outcome at 6 months and to assess their association with performance on neuropsychological measures. Classification performance was assessed with the H-measure,37 which, unlike other conventional metrics (e.g., accuracy), adjusts for unbalanced outcome categories.
Data preprocessing
Before modeling analysis, we performed 2 additional preprocessing steps, similar to what was done in previous work.9,10 Because the shape data are voxel-wise, we averaged shape measurements over ROIs derived from established atlases, including the Oxford connectivity atlas (for thalamus),38 the Oxford-Imanova connectivity atlas (for striatum),39 the ATAC globus pallidus atlas (for the pallidum),40 the Desikan-Killiany cortical atlas (for cortex),41 and the Harvard-Oxford atlas (for brainstem, hippocampus).42 Second, because of significant correlations across average ROI values at each time point (i.e., acute, follow-up), as well as longitudinally, we used a principal component analysis (PCA) to reduce correlated ROIs to a smaller number of independent components, which could then be entered as predictor variables in the modeling analysis. Thus, average ROI shape values for acute, follow-up, and longitudinal change were submitted separately to 3 PCA models (with varimax rotation). The resulting components from each PCA are referred to as MRI1w, MRI6m, and MRIΔ for acute (1 week), follow-up (6 months), and change-over-time data, respectively. In addition, because of significant correlations within demographics (age, sex), acute clinical measurements (GCS subscales, total scores), and experimental variables (i.e., days after injury of the acute MRI, days after injury of the follow-up MRI, and days between the 2 MRI sessions), these variables were also submitted to a fourth PCA (henceforth observational components) implemented identically to the 3 PCAs performed on MR data. For each PCA, we retained all the components with an eigenvalue >1.
Functional outcome modeling
A binary logistic regression was used to classify good (GOSe score ≥5; n = 75) vs bad (GOSe score ≤4; n = 38) functional outcome at 6 months. To evaluate the relative contribution of each group of independent components, we used a hierarchical approach in which each set of independent variables was entered sequentially (in the following order: observational, MRI1w, MRI6m, and MRIΔ components). At each step, independent variables were selected with a conventional stepwise selection.
Neuropsychological performance modeling
Hierarchical linear regressions, implemented with the same approach described above, were used to assess the association between observational and MRI components and aggregate scores of attention, executive functions, and episodic memory.
Data availability
Anonymized shape data are available from the first (lutkenhoff@ucla.edu) or last (monti@ucla.edu) author and can be obtained through a material transfer agreement between the requesting principal investigator/institution and the UCLA Technology Development Group. Supplementary tabular data (tables S1–S7) are available from Dryad at doi.org/10.5068/D1ZM2Q.
Results
Sample description
As shown in figure 2, of the 157 patients recruited, 6 never underwent the acute MRI session (due to acute complications), 6 died before the 6-month follow-up visit, and 29 more failed to return for follow-up. Of the 116 patients who underwent both MRI sessions, image segmentation failure (at either time point) resulted in the further exclusion of 3 subcortical and 24 cortical datasets, leading to a final sample of 113 and 92 high-quality, 2-time-point subcortical and cortical datasets, respectively. Descriptive characteristics of the final sample are presented in table 1. Over the course of the study, 29 participants were lost to follow-up. These patients did not differ significantly in injury severity, as measured by the GCS total and subscales scores, compared to the patients who underwent both imaging sessions.
Figure 2. Flowchart of patient enrollment and inclusion.

Ctx = cortical; QC = quality control; Sbctx = subcortical.
Table 1.
Descriptive characteristics of the study sample

Shape analysis
The time analysis shows that patients surviving moderate to severe TBI undergo extensive thinning of the cortical ribbon (with significant thinning in 75% and 71% of left and right hemispheres, respectively, covering an area of 43,703 and 42,128 mm2), particularly in polymodal cortical regions in bilateral prefrontal, superior parietal, superior temporal, lateral occipital, and medial cortices (figure 3A and table S1, available on Dryad.org, doi.org/10.5068/D1ZM2Q). In subcortical regions, maximal atrophy over time was observed in left (39% of ROI vertices) and right (47%) thalamus (mediodorsal and ventral regions connecting to prefrontal, temporal, and posterior parietal cortices), left (28%) and right (12%) caudate, left (10%) and right (24%) hippocampus, and right putamen (25%).
Figure 3. Shape analysis results.

Cortical and subcortical regions with shape change significantly associated with (A) time, (B) outcome, (C) aggregate score of attention, (D) aggregate score of executive functions, and (E) aggregate score of episodic memory. (A.a, B.a, C.a, D.a, E.a) Shape data results for subcortical structures. (A.b, B.b, C.b, D.b, E.b) Shape results for the cortical ribbon. Areas in hot colors indicate significant atrophy; areas in gray indicate no significant atrophy.
Remarkably, the outcome analysis shows that only a relatively small subset of the broad pattern of atrophy over time reported above is related to a patient's functional outcome at 6 months, as captured by the in-person GOSe evaluation (figure 3B and table S2, available on Dryad.org, doi.org/10.5068/D1ZM2Q). At the subcortical level, we observed a significant negative correlation between outcome and atrophy in left (60%) and right (39%) thalamus, left pallidum (85%), and left caudate (18%, localized to regions connecting to frontal lobe executive and limbic functional regions). At the cortical level, we observed significant thinning associated with worse outcome in the left temporal lobe (covering an area of 4,090 mm2; i.e., 7% of the left hemisphere) and including the left banks superior temporal sulcus (59% of ROI vertices), transverse temporal cortex (32%), inferior parietal cortex (27%), middle temporal gyrus (26%), superior temporal gyrus (26%), lateral occipital cortex (19%), and supramarginal gyrus (2%).
The cognitive impairment analysis shows, for each cognitive domain, systematic associations between brain change over time and aggregate neuropsychological scores (figure 3, C–E and tables S3–S5, available on Dryad.org, doi.org/10.5068/D1ZM2Q). Specifically, the aggregate attention scores were associated with extensive atrophy in left thalamus (76%, particularly along its mediodorsal aspect), as well as regions of left pallidum (43%) and right hippocampus (33%) and a small cluster in left temporal cortex (spanning 335 mm2; i.e., 0.5% of the left hemisphere) and including the left superior temporal sulcus (7% of ROI vertices), inferior parietal cortex (4%), middle temporal gyrus (4%), and supramarginal gyrus (<1%). Aggregate scores of executive function were again associated with extensive atrophy in left (89%) and right (73%) thalamus, as well as left (93%) and right (87%) globus pallidus, left (7%) and right (8%) caudate, and right hippocampus (50%). Executive function scores were also associated with a 1,311-mm2 cortical thinning cluster spanning right precuneus cortex (37%), posterior-cingulate cortex (9%), isthmus-cingulate cortex (5%), and paracentral lobule (<1%), as well as smaller clusters (covering 1,669 mm2) in bilateral inferior parietal cortex, postcentral and supramarginal gyri, left inferior frontal (pars triangularis), fusiform, and precentral gyri, and right superior temporal and superior parietal cortices (covering <10% of each ROI). Finally, aggregate scores of episodic memory were negatively correlated with atrophy in left thalamus (17%) and 3 cortical thinning clusters covering 1,992 mm2 and spanning left (17%) and right (<1%) precuneus cortex, right postcentral gyrus (9%), paracentral lobule (9%), precentral (5%), superior temporal (10%), and supramarginal (9%) gyri, and left superior temporal sulcus (7%), and isthmus-cingulate cortex (1%).
Modeling analysis
Functional outcome modeling
Predicting good/bad outcome from observational (i.e., clinical, demographic, and experimental variables) components alone (i.e., Model 1 [M1]: Obs) and from observational and acute MRI (i.e., MRI1w) components together (i.e., M2: Obs + MRI1w) resulted in good sensitivity (88% and 87%, respectively) but extremely low specificity (29% and 37%, respectively) (figure 4 and table S6, available on Dryad.org, doi.org/10.5068/D1ZM2Q). When adjusted for unbalanced outcome categories (with the H-measure37), classification was poor for both models (19% and 20%, respectively). Adding follow-up (i.e., MRI6m) and change (i.e., MRIΔ) components to the model (i.e., M3: Obs + MRI1w + MRI6m and M4: Obs + MRI1w + MRI6m + MRIΔ, respectively) increased specificity (76% and 95%, respectively) while offering comparable or greater sensitivity (89% and 96%, respectively), thus greatly ameliorating the analytical solution of the model (H-measure 68% and 90%, respectively). Nonetheless, this amelioration comes at the cost of the interpretation of the quantitative model, which is no longer understandable as a prediction as much as an association. Unlike models 1 and 2, in model 3 (and 4), some of the independent variables are collected contemporaneously to the outcome variable of interest. Thus, the later models are best understood as analyses of association between functional outcome, clinical, and MRI variables.
Figure 4. ROC curve for the modeling analysis of functional outcome.

Receiver operating characteristic (ROC) curves for each of the 4 models (with reference line) in the functional outcome modeling analysis (table S6, available on Dryad.org, doi.org/10.5068/D1ZM2Q). MRIΔ = change components; MRI1w = acute MRI components; MRI6m = follow-up MRI components; Obs = observational components (i.e., clinical, demographic, and experimental variables).
In terms of individual independent variables (i.e., components), the final model (i.e., model 4) selected components from all 4 groups of variables (figure 5 and table S6, available on Dryad.org, doi.org/10.5068/D1ZM2Q). The components most strongly associated with functional outcome were the degree of acute atrophy (MRI1w) and atrophy change over time (MRI∆) in the bilateral thalamic and basal ganglia component (odds ratio [OR] = 4,070.39, 95% confidence interval [CI] 19.44–8.52e5 and OR 3,954.43, 95% CI 15.48–1.010e6 for acute and change over time, respectively) and atrophy change over time (MRI∆) in the left thalamic nuclei projecting to prefrontal, temporal, and parietal cortices specifically (OR <0.01, 95% CI 4.18e-5–0.19), followed by the atrophy at follow-up (MRI6m) in the right parietal cortex component (OR 701.39, 95% CI 8.28–59,371.02), the overall thinning of cortex at follow-up global component (particularly in frontoparietal regions; OR 344.43, 95% CI 6.74–17,548.28), and the GCS score on the day of the acute MRI (OR 83.92, 95% CI 3.36–2,095.32). In other words, better outcomes were associated with less initial atrophy and less atrophy over time in basal ganglia and left thalamic nuclei projecting to polymodal association areas, less overall cortical thinning by 6 months after injury (particularly in frontoparietal regions), and better acute GCS scores.
Figure 5. Modeling analysis results for functional outcome.

Conditional estimate plots for each of the selected variable in the functional outcome modeling analysis (table S6, available on Dryad.org, doi.org/10.5068/D1ZM2Q; variables are ordered by odds ratio magnitude, gray area represents 95% confidence interval). For single-time-point measurements (i.e., MRI1w and MRI6m), lower numbers on the x-axis indicate less atrophy/thinning; for change variables (i.e., MRI∆), lower/negative numbers on the x-axis indicate greater atrophy over time. The interpretation is reversed for components marked as negative (neg.) because they load negatively on the brain variables. Grayed-out variable labels indicate variables selected by the step-wise model but nonsignificant. BG = basal ganglia; Bil = bilateral; BrStem = brainstem; Ctx = cortex; Fr-Par = frontoparietal lobes; FrPole = frontal pole; GCS = Glasgow Coma Scale; GP = pallidum; Hipp = hippocampus; LH = left hemisphere; Occip = occipital lobe; OFG = orbitofrontal gyrus; Parahipp = parahippocampus; Pariet = parietal lobe; pCingG = posterior cingulate gyrus; PFC = prefrontal cortex; RH = right hemisphere; Sbctx = subcortex; TempPole = temporal pole; Thal = thalamus.
Neuropsychological performance modeling
Each of the 3 cognitive domains was significantly associated with a subset of components (figure 6 and table S7, available on Dryad.org, doi.org/10.5068/D1ZM2Q). Consistent with the shape analysis results, the less the atrophy was at follow-up in bilateral thalamus, the better the performance was in all 3 cognitive domains (i.e.,  = 0.41, 95% CI 1.22–8.23;
  = 0.33, 95% CI 0.69–6.57; and
  = 0.38, 95% CI 1.10–7.26 for attention, executive functions, and episodic memory, respectively). In addition, aggregate scores of attention were also significantly associated with less thinning of bilateral transverse temporal gyrus at follow-up (
 =0.38, 95% CI 1.07–10.35). Aggregate scores of executive functions were also inversely proportional to the atrophy over time in the bilateral superior frontal gyrus and the motor/premotor/sensory aspects of thalamus (
 =−0.46, 95% CI −7.83 to −2.08) and inversely proportional to expansion over time in the bilateral transverse temporal gyrus (
 =−0.39, 95% CI −4.80 to −0.97). Finally, aggregate scores of episodic memory were also associated with less overall cortical thinning (particularly in frontoparietal regions) at follow-up (
 =0.47, 95% CI 2.41–9.72). (Table S7, available on Dryad.org, gives statistics associated with each set of variables for each regression.) In other words, with respect to subcortical structures, better cognitive performance was associated, across domains, with less thalamic atrophy at 6 months. With respect to cortical structures, better performance in individual domains was associated with either less cortical thinning at follow-up (for attention and episodic memory) or a less pronounced rate of cortical thinning over time (for executive functions).
Figure 6. Modeling analysis results for neuropsychological scores.

Partial plots for significant predictors for (A) aggregate score of attention, (B) aggregate score of executive functions, and (C) aggregate score of episodic memory (table S7, available on Dryad.org, doi.org/10.5068/D1ZM2Q). As in figure 5, for single-time-point measurements (i.e., MRI6m), lower numbers on the x-axis indicate less atrophy/thinning; for change variables (i.e., MRI∆), lower/negative numbers on the x-axis indicate greater atrophy over time. Bil = bilateral; Ctx = cortical; mot = motor; premot = premotor; RH = right hemisphere; Sbctx = subcortical; sens = sensory; SFG =superior frontal gyrus; Thal = thalamus; TTG = transverse temporal gyri.
Discussion
In this work, we address the influence of silent nonischemic brain atrophy after moderate to severe TBI and its relationship to functional outcome and cognitive abilities at 6 months. In line with previous small cohort studies,9,10 we show that over the first 6 months after injury, patients undergo systematic atrophy and cortical thinning across large areas of the brain spanning most of cortex, including bilateral polymodal association regions, and subcortical areas, including bilateral thalamus, left pallidum, and caudate. However, we find that only a relatively small subset of this pattern of damage, mainly in subcortical regions, relates to functional outcome and cognitive performance at 6 months. For both, the maximal atrophy was consistently found within the left dorsal aspect of thalamus, along its rostrocaudal axis, either exclusively or accompanied by atrophy in the homologous region in the right thalamus. This pattern closely matches the atrophy observed in patients with brain injury with profound chronic impairment (e.g., patients with GOSe score ≤3),8 suggesting that the biology of long-term impairment might well be established, to some degree, within the first few months after injury. This finding is consistent with the known network vulnerability of specific central thalamic nuclei after severe brain injury43 and with the finding that thalamic lesions cause a disruption of the modular structure of cortical functional networks.44 Furthermore, the systematic relationship between atrophy in thalamus and performance on neuropsychological assessments of attention, executive functions, and episodic memory offers a possible direct link between the secondary processes triggered by TBI and long-term cognitive disorders for which patients with TBI are known to be at increased risk.1,2,4 This idea is consistent with the tight association between lesion extent in the mediodorsal and intralaminar thalamic nuclei and increased impairment in executive functions and attention18,45 and episodic memory performance,15 as well as the association between thalamic integrity and dysexecutive syndrome in small samples of mild to severe chronic TBI survivors,14,16 presumably as a consequence of a broader network disruption caused by the thalamic damage itself.14,17 Our analysis also reveals systematic and persistent association between pallidal atrophy and clinical measures. While this structure is generally understudied, it has been reported to be atrophic in proportion to the impairment of arousal in chronic patients with disorders of consciousness8 and has been shown to lead, after resection, to attentional-executive sequelae in a small sample of patients with Parkinson disease.46 Furthermore, studies in healthy volunteers undergoing anesthesia have also shown the pallidum to play an important role in the context of loss and recovery of consciousness,47 putatively via its direct and indirect projections to cortex.48 The precise contribution of this region in the context of long-term outcome after TBI remains to be investigated.
Finally, our modeling work shows that it is very difficult to predict outcome on the basis of demographic (i.e., age, sex), acute clinical (i.e., GCS score), and acute imaging data alone. Conversely, once chronic and change-over-time information is also considered, the analytical model successfully uncovers strong and systematic associations between independent variables and functional outcome, with the analytical model performance achieving a success rate of 90%—albeit, as discussed above, no longer being a clinical prediction. The variables most strongly associated with functional outcome appear to be the acute thalamic atrophy and the degree of secondary atrophy occurring over time, particularly in the regions of left thalamus connecting to prefrontal, temporal, and posterior parietal cortices, i.e., the intercept (the initial state) and slope (the change over time) of thalamic atrophy. Consistent with the results of the shape analysis and the previous literature mentioned, the central role of thalamus in recovery from brain injury is further underscored by the fact that thalamic atrophy at follow-up was the one phenotype associated negatively with performance in all cognitive domains.
These results have certain limitations. First, while measuring brain pathology with conventional clinical MRI makes our findings directly translatable to routine practice, the finer biology of the observed processes is unassessed. Second, the use of consecutive sampling increases representativeness of the broader patient population admitted to an intensive care context after moderate to severe TBI, but potential bias due to local factors (e.g., the TBI profiles more prevalent in the region) is possible. Third, we measured the association between cognitive function and brain pathology with aggregate scores of attention, executive ability, and episodic memory; future work will have to address different aggregation strategies related to specific atrophy patterns because specific cognitive subprocesses often contribute multiple abilities (indeed, recent data suggest thalamus might best be characterized as a global hub subserving multiple cognitive functions44). Similarly, while our findings are in line with prior work18,45 relating the 3 specific cognitive functions to subcortical areas, and thalamic nuclei in particular, our continuous cohort was relatively small, inviting caution in the interpretation of the result. Fourth, further studies following up patients over years and decades will be needed to fully assess and generalize our proposal with respect to other important long-term consequences of TBI such as the development of neurodegenerative disorders.2 Finally, the relatively low association between cortical atrophy and clinical measures compared with the systematic and strong associations found with thalamus might reflect both greater heterogeneity across patients and specific aspects of brain architecture (i.e., network vulnerability of central thalamic neurons32). Finally, data were collected over a relatively long period of time, during which clinical care and MRI technology evolved. To alleviate such methodologic differences, several techniques were implemented in the MRI analysis: the shape analysis was modified to eliminate pose and global scaling across the different MR acquisitions; the MRI machine was explicitly modeled in the general linear model as a covariate; a cohort-specific average brain was created (rather than standard Montreal Neurological Institute space) for statistical analysis; and within-participant templates were used for longitudinal changes per participant rather than a large cross-sectional design of all participants and all time points.
This work presents, in the largest cohort to date, a picture in which TBI results in a minimum common denominator injury pattern as a consequence of network vulnerability of specific thalamic nuclei.43 This pattern matches a known key phenotype of profound long-term impairment8,49 and may provide a key explanatory link between the acute event of TBI and the long-term disease of TBI.12 Finally, our findings also have important clinical implications in terms of prognosis and end-of-life discussions in the acute post-TBI setting.
Glossary
- CI
confidence interval
- GCS
Glasgow Coma Scale
- GOSe
Glasgow Outcome Scale–extended
- LDFR
Long-Delay Free Recall
- MP-RAGE
magnetization-prepared rapid gradient echo
- MR
magnetic resonance
- OR
odds ratio
- PCA
principal component analysis
- RD
Recognition Discriminability
- ROI
region of interest
- SDFR
Short-Delay Free Recall
- SDMT
Symbol Digit Modalities Test
- TBI
traumatic brain injury
Appendix. Authors

Footnotes
Editorial, page 763
Study funding
Study Funding by NIH/National Institute of Neurological Disorders and Stroke grants NS058489, NS100064, and NS049471; Tiny Blue Dot Foundation; James S. McDonnell Foundation; and the State of California Neurotrauma Initiative.
Disclosure
E.S. Lutkenhoff, M.J. Wright, V. Shrestha, and C. Real report no disclosures relevant to the manuscript. D.L. McArthur reports personal fees from Wiley Publishing. M. Buitrago-Blanco, P.M. Vespa, and M.M. Monti report no disclosures relevant to the manuscript. Go to Neurology.org/N for full disclosures.
Publication history
This manuscript was previously published on bioRxiv: doi https://doi.org/10.1101/669390. Received by Neurology December 18, 2019. Accepted in final form June 2, 2020.
References
- 1.Stocchetti N, Zanier ER. Chronic impact of traumatic brain injury on outcome and quality of life: a narrative review. Crit Care 2016;20:148. [DOI] [PMC free article] [PubMed] [Google Scholar]
- 2.Wilson L, Stewart W, Dams-O'Connor K, et al. The chronic and evolving neurological consequences of traumatic brain injury. Lancet Neurol 2017;16:813–825. [DOI] [PMC free article] [PubMed] [Google Scholar]
- 3.TBI Model Systems National Database. Moderate to Severe Traumatic Brain Injury Is a Lifelong Condition. 2016. Available at: brainline.org/article/moderate-severe-traumatic-brain-injury-lifelong-condition. Accessed September 16, 2020. [Google Scholar]
- 4.Harrison-Felix C, Kolakowsky-Hayner SA, Hammond FM, et al. Mortality after surviving traumatic brain injury: risks based on age groups. J Head Trauma Rehabil 2012;27:E45–E56. [DOI] [PubMed] [Google Scholar]
- 5.Povlishock JT, Katz DI. Update of neuropathology and neurological recovery after traumatic brain injury. J Head Trauma Rehabil 2005;20:76–94. [DOI] [PubMed] [Google Scholar]
- 6.Werner C, Engelhard K. Pathophysiology of traumatic brain injury. Br J Anaesth 2007;99:4–9. [DOI] [PubMed] [Google Scholar]
- 7.Fernandez-Espejo D, Bekinschtein T, Monti MM, et al. Diffusion weighted imaging distinguishes the vegetative state from the minimally conscious state. Neuroimage 2011;54:103–112. [DOI] [PubMed] [Google Scholar]
- 8.Lutkenhoff ES, Chiang J, Tshibanda L, et al. Thalamic and extrathalamic mechanisms of consciousness after severe brain injury. Ann Neurol 2015;78:68–76. [DOI] [PubMed] [Google Scholar]
- 9.Lutkenhoff ES, McArthur DL, Hua X, Thompson PM, Vespa PM, Monti MM. Thalamic atrophy in antero-medial and dorsal nuclei correlates with six-month outcome after severe brain injury. Neuroimage Clin 2013;3:396–404. [DOI] [PMC free article] [PubMed] [Google Scholar]
- 10.Schnakers C, Lutkenhoff ES, Bio BJ, McArthur DL, Vespa PM, Monti MM. Acute EEG spectra characteristics predict thalamic atrophy after severe TBI. J Neurol Neurosurg Psychiatry 2019;90:617–619. [DOI] [PMC free article] [PubMed] [Google Scholar]
- 11.Schnakers C, Monti MM. Disorders of consciousness after severe brain injury: therapeutic options. Curr Opin Neurol 2017;30:573–579. [DOI] [PubMed] [Google Scholar]
- 12.Maas AIR, Menon DK, Adelson PD, et al. Traumatic brain injury: integrated approaches to improve prevention, clinical care, and research. Lancet Neurol 2017;16:987–1048. [DOI] [PubMed] [Google Scholar]
- 13.Schiff ND. Recovery of consciousness after brain injury: a mesocircuit hypothesis. Trends Neurosci 2010;33:1–9. [DOI] [PMC free article] [PubMed] [Google Scholar]
- 14.Caeyenberghs K, Leemans A, Leunissen I, et al. Altered structural networks and executive deficits in traumatic brain injury patients. Brain Struct Funct 2014;219:193–209. [DOI] [PubMed] [Google Scholar]
- 15.Kubat-Silman AK, Dagenbach D, Absher JR. Patterns of impaired verbal, spatial, and object working memory after thalamic lesions. Brain Cogn 2002;50:178–193. [DOI] [PubMed] [Google Scholar]
- 16.Little DM, Kraus MF, Joseph J, et al. Thalamic integrity underlies executive dysfunction in traumatic brain injury. Neurology 2010;74:558–564. [DOI] [PMC free article] [PubMed] [Google Scholar]
- 17.Stuss DT. Traumatic brain injury: relation to executive dysfunction and the frontal lobes. Curr Opin Neurol 2011;24:584–589. [DOI] [PubMed] [Google Scholar]
- 18.Van der Werf YD, Jolles J, Witter MP, Uylings HB. Contributions of thalamic nuclei to declarative memory functioning. Cortex 2003;39:1047–1062. [DOI] [PubMed] [Google Scholar]
- 19.Teasdale G, Jennett B. Assessment of coma and impaired consciousness: a practical scale. Lancet 1974;2:81–84. [DOI] [PubMed] [Google Scholar]
- 20.Wilson JT, Pettigrew LE, Teasdale GM. Structured interviews for the Glasgow Outcome Scale and the extended Glasgow Outcome Scale: guidelines for their use. J Neurotrauma 1998;15:573–585. [DOI] [PubMed] [Google Scholar]
- 21.Smith A. Symbol Digit Modalities Test: Los Angeles: Western Psychological Services; 1982. [Google Scholar]
- 22.Golden CJ. Stroop Color and Word Test: A Manual for Clinical and Experimental Uses. Dale, IL: Stoelting; 1978. [Google Scholar]
- 23.Army Individual Test Battery: Manual of Directions and Scoring. Washington, DC: War Department, Adjutant General's Office; 1944. [Google Scholar]
- 24.Mitrushina M, Boone KB, Razani J, D'Elia LF. Handbook of Normative Data for Neuropsychological Assessment. Oxford: Oxford University Press; 2005. [Google Scholar]
- 25.Delis DC, Kramer JH, Kaplan E, Ober BA. CVLT-II: California Verbal Learning Test: Adult Version. San Antonio: Psychological Corp; 2000. [Google Scholar]
- 26.Boone KB, Salazar X, Lu P, Warner-Chacon K, Razani J. The Rey 15-item recognition trial: a technique to enhance sensitivity of the Rey 15-item memorization test. J Clin Exp Neuropsychol 2002;24:561–573. [DOI] [PubMed] [Google Scholar]
- 27.Rey AL. Examen Clinique en Psychologie [Psychological Clinical Examination]. Paris: Presses Universitaires de France; 1964. [Google Scholar]
- 28.Boone KB, Lu P, Back C, et al. Sensitivity and specificity of the Rey Dot Counting Test in patients with suspect effort and various clinical samples. Arch Clin Neuropsychol 2002;17:625–642. [PubMed] [Google Scholar]
- 29.Victor TL, Boone KB, Serpa JG, Buehler J, Ziegler EA. Interpreting the meaning of multiple symptom validity test failure. Clin Neuropsychol 2009;23:297–313. [DOI] [PubMed] [Google Scholar]
- 30.Lezak MD. Neuropsychological Assessment. Oxford: Oxford University Press; 2012. [Google Scholar]
- 31.Patenaude B, Smith SM, Kennedy DN, Jenkinson M. A bayesian model of shape and appearance for subcortical brain segmentation. Neuroimage 2011;56:907–922. [DOI] [PMC free article] [PubMed] [Google Scholar]
- 32.Lutkenhoff ES, Rosenberg M, Chiang J, et al. Optimized brain extraction for pathological brains (optiBET). PLoS One 2014;9:e115551. [DOI] [PMC free article] [PubMed] [Google Scholar]
- 33.Smith SM, Zhang Y, Jenkinson M, et al. Accurate, robust, and automated longitudinal and cross-sectional brain change analysis. Neuroimage 2002;17:479–489. [DOI] [PubMed] [Google Scholar]
- 34.Stonnington CM, Tan G, Kloppel S, et al. Interpreting scan data acquired from multiple scanners: a study with Alzheimer's disease. Neuroimage 2008;39:1180–1185. [DOI] [PMC free article] [PubMed] [Google Scholar]
- 35.Hagler DJ Jr, Saygin AP, Sereno MI. Smoothing and cluster thresholding for cortical surface-based group analysis of fMRI data. Neuroimage 2006;33:1093–1103. [DOI] [PMC free article] [PubMed] [Google Scholar]
- 36.Smith SM, Nichols TE. Threshold-free cluster enhancement: addressing problems of smoothing, threshold dependence and localisation in cluster inference. Neuroimage 2009;44:83–98. [DOI] [PubMed] [Google Scholar]
- 37.Hand DJ. Evaluating diagnostic tests: the area under the ROC curve and the balance of errors. Stat Med 2010;29:1502–1510. [DOI] [PubMed] [Google Scholar]
- 38.Behrens TE, Johansen-Berg H, Woolrich MW, et al. Non-invasive mapping of connections between human thalamus and cortex using diffusion imaging. Nat Neurosci 2003;6:750–757. [DOI] [PubMed] [Google Scholar]
- 39.Tziortzi AC, Haber SN, Searle GE, et al. Connectivity-based functional analysis of dopamine release in the striatum using diffusion-weighted MRI and positron emission tomography. Cereb Cortex 2013;24:1165–1177. [DOI] [PMC free article] [PubMed] [Google Scholar]
- 40.Keuken MC, Bazin PL, Crown L, et al. Quantifying inter-individual anatomical variability in the subcortex using 7T structural MRI. Neuroimage 2014;94:40–46. [DOI] [PubMed] [Google Scholar]
- 41.Desikan RS, Segonne F, Fischl B, et al. An automated labeling system for subdividing the human cerebral cortex on MRI scans into gyral based regions of interest. Neuroimage 2006;31:968–980. [DOI] [PubMed] [Google Scholar]
- 42.Makris N, Goldstein JM, Kennedy D, et al. Decreased volume of left and total anterior insular lobule in schizophrenia. Schizophr Res 2006;83:155–171. [DOI] [PubMed] [Google Scholar]
- 43.Schiff ND. Central thalamic deep brain stimulation to support anterior forebrain mesocircuit function in the severely injured brain. J Neural Transm (Vienna) 2016;123:797–806. [DOI] [PubMed] [Google Scholar]
- 44.Hwang K, Bertolero MA, Liu WB, D'Esposito M. The human thalamus is an integrative hub for functional brain networks. J Neurosci 2017;37:5594–5607. [DOI] [PMC free article] [PubMed] [Google Scholar]
- 45.Van der Werf YD, Witter MP, Uylings HB, Jolles J. Neuropsychology of infarctions in the thalamus: a review. Neuropsychologia 2000;38:613–627. [DOI] [PubMed] [Google Scholar]
- 46.Scott RB, Harrison J, Boulton C, et al. Global attentional-executive sequelae following surgical lesions to globus pallidus interna. Brain 2002;125:562–574. [DOI] [PubMed] [Google Scholar]
- 47.Crone JS, Lutkenhoff ES, Bio BJ, Laureys S, Monti MM. Testing proposed neuronal models of effective connectivity within the cortico-basal ganglia-thalamo-cortical loop during loss of consciousness. Cerebral Cortex 2016;27:2727–2738. [DOI] [PubMed] [Google Scholar]
- 48.Zheng ZS, Monti MM. Thalamic and extra-thalamic connections of the globus pallidus in the human brain: the ultradirect pathway. bioRxiv 2019:688283. [Google Scholar]
- 49.Graham DI, Adams JH, Murray LS, Jennett B. Neuropathology of the vegetative state after head injury. Neuropsychol Rehabil 2005;15:198–213. [DOI] [PubMed] [Google Scholar]
Associated Data
This section collects any data citations, data availability statements, or supplementary materials included in this article.
Data Availability Statement
Anonymized shape data are available from the first (lutkenhoff@ucla.edu) or last (monti@ucla.edu) author and can be obtained through a material transfer agreement between the requesting principal investigator/institution and the UCLA Technology Development Group. Supplementary tabular data (tables S1–S7) are available from Dryad at doi.org/10.5068/D1ZM2Q.