Abstract
Objective
To test the hypothesis that in periventricular nodular heterotopia (PVNH) structure and function of cortical areas overlying the heterotopic gray matter are preferentially affected.
Methods
We studied a group of 40 patients with PVNH and normal-appearing cortex and compared their quantitative MRI markers of brain development, structure, and function to those of 43 age- and sex-matched healthy controls. Inspired by models of neocortical development suggesting that neuronal migration follows a curvilinear path to preserve topologic correspondence between the outer ventricular zone and the cortical surface, we computationally defined the overlying cortex using the Laplace equation and generated synthetic streamlines that link the ventricles, where nodules are located, and the neocortex.
Results
We found multilobar cortical thickening encompassing prefrontal, latero-basal temporal, and temporoparietal cortices largely corresponding with the PVNH group-averaged map of the overlying cortex, the latter colocalized with areas of abnormal function, as defined by resting-state fMRI. Patients also presented hippocampal functional hyperconnectivity and malrotation, the latter positively correlating with neocortical maldevelopment indexed by increased folding complexity of the parahippocampus. In clusters of thickness and curvature findings, there were no significant differences between unilateral and bilateral PVNH; contrasting brain-wide metrics between cohorts was also unrevealing. There was no relationship between imaging markers and disease duration except for positive correlation with functional anomalies.
Conclusion
Our quantitative image analysis demonstrates widespread structural and functional alterations in PVNH with differential interaction with the overlying cortex and the hippocampus. Right hemispheric predominance may be explained by an early insult, likely genetically determined, on brain morphogenesis.
Periventricular nodular heterotopia (PVNH) is the most commonly identified gray matter (GM) heterotopia on MRI.1 This epileptogenic malformation features isolated or confluent ectopic neuronal nodules along the walls of the lateral ventricles. While the pathogenic mechanisms underlying PVNH remain largely unknown, recent preclinical models suggest a disruption of the ventricular ependymal lining, leading to the disorganization of radial glial fibers anchored to it. Radial cell migration is thus impaired, and neuronal aggregates remain close to the ventricular surface.2 PVNH may be associated with a spectrum of other developmental brain anomalies such as polymicrogyria1 and hippocampal malrotation.3,4
Several lines of evidence, including electrophysiology5,6 and fMRI,7 suggest interactions between the heterotopic and normotopic cortex; coactivation with epileptiform discharges8,9 supports joint contribution to the epileptogenic circuitry, which may involve the hippocampus. The laminar organization of the normotopic GM may be altered, as shown by histologic analysis of resected specimen in patients undergoing epilepsy surgery.5,10,11 These findings notwithstanding, structural MRI is often unrevealing, likely due to a lack of sensitivity of visual inspection. Another difficulty lies in the precise anatomic definition of the cortex overlying PVNH, given the highly convoluted configuration of the human brain. These challenges may explain the paucity of in vivo analysis of brain morphology in this condition.12
Given the evidence for a defect of radial neuronal migration in PVNH, it is expected that the structure and function of cortical areas overlying the heterotopic GM are preferentially affected. Models of neocortical development and expansion suggest that neuronal migration along radial glial fibers follows a curvilinear path to preserve topologic correspondence between the outer ventricular zone and the increasingly convoluted cortical surface.13,14 Accordingly, the overlying cortex would be considered the area where heterotopic neurons would have otherwise migrated to form a normal cortical architecture. Inspired by these models, we computationally defined the overlying cortex using the Laplace equation and generated synthetic streamlines that link the ventricular surface, where nodules are located, and the neocortex. Indeed, the Laplace streamlines may serve as a proxy for radial glial migration because their trajectory satisfies biologically meaningful rules by following a perpendicular path that gradually curves as they propagate from one surface toward the other without intersection, guaranteeing a one-to-one mapping between the 2 surfaces.15 Here, we studied a large cohort of patients with PVNH and normal-appearing cortex. Our whole-brain MRI phenotyping included markers of morphology and development, namely cortical thickness, sulco-gyral complexity, and hippocampal malrotation indices. Morphometry was complemented by resting-state fMRI metrics of regional homogeneity (ReHo) and degree centrality (DC) to benchmark local and global function. Linear models assessed differences between patients and healthy controls, as well as interactions between PVNH nodules, neocortical morphology and function, and hippocampal malrotation.
Methods
Participants
From a database of 107 patients with heterotopias admitted to the Montreal Neurologic Institute and Hospital for investigation of drug-resistant epilepsy, we selected 40 with sporadic PVNH (22 male participants, age 29 ± 8 years) who had a research-dedicated MRI investigation on either a 1.5T (n = 21) or 3T (n = 19) scanner that included a 3D millimetric resolution structural MRI and who did not have obvious coexisting cortical malformations such as subcortical heterotopias, schizencephaly, lissencephaly-pachygyria, cortical dysplasia, or polymicrogyria. Periventricular nodules were bilateral in 18 patients and unilateral in 22 (8 left-sided and 14 right-sided). Associated brain anomalies did not differ between bilateral and unilateral PVNH and included hippocampal malrotation (83% vs 59%, respectively; p = 0.2, Fisher exact test), posterior fossa cysts/megacysterna (50% vs 14%; p = 0.02 uncorrected), cerebellum hypoplasia (22% vs 23%; p = 1), ventricular enlargement or colpocephaly (61% vs 41%; p = 0.3), or a thin callosum (50% vs 46%; p = 1).
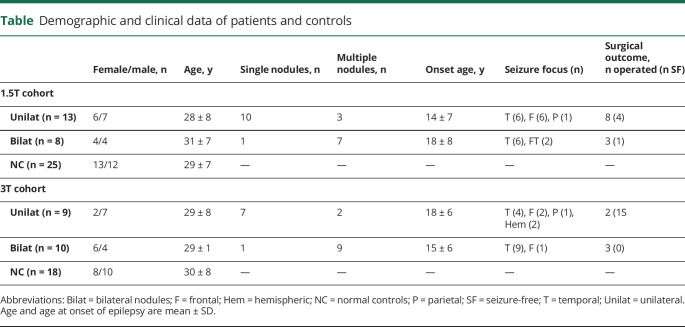
Clinical assessment included a comprehensive evaluation of seizure history and semiology, neurologic examination, video-EEG telemetry, and neuroimaging. Patients were compared to 43 healthy controls matched for age, sex, and scanner; 25 were examined at 1.5T (10 male participants, age 30 ± 8 years) and 18 at 3T (12 male participants, age 29 ± 7 years). There were no differences in age and sex between unilateral and bilateral PVNH and controls in either the 1.5T or 3T cohort. Demographic and electroclinical data are summarized in the table.
Table.
Demographic and clinical data of patients and controls
Standard protocol approvals, registrations, and patient consents
The Ethics Committee of the Montreal Neurological Institute and Hospital approved the study, and written informed consent was obtained from all participants in accordance with the standards of the Declaration of Helsinki.
MRI acquisition
For the 1.5T dataset, the 3D T1-weighted MRI was acquired on a Philips Gyroscan (Philips, Best, the Netherlands) with a fast-field-echo sequence (repetition time 18 milliseconds, echo time 10 milliseconds, flip angle 30°, matrix 256 × 256, field of view 256 × 256 mm2, 176 sagittal slices with 1 mm isotropic thickness). The 3T dataset was acquired on a Siemens TimTrio scanner (Siemens Medical Solutions, Malvern, PA) with a 32-channel head coil and included 3D T1-weighted magnetization-prepared rapid acquisition with gradient echo (repetition time 2,300 milliseconds, echo time 2.98 milliseconds, flip angle 9°, voxel size 1 × 1 × 1 mm3) and echo planar resting-state fMRI (repetition time 2,020 milliseconds, echo time 30 milliseconds, flip angle 90°, 34 slices, voxel size 4 × 4 × 4 mm3, 150 volumes). For the latter, to reduce signal loss and distortions in the orbitofrontal and mesiotemporal regions, slices were tilted in an oblique axial orientation, and participants were instructed to lie still with their eyes closed while remaining awake.
MRI preprocessing
T1-weighted MRI
Images underwent automated intensity nonuniformity correction and standardization.16 They were linearly registered to the Montreal Neurological Institute 152 template,17 followed by tissue classification into white matter (WM), GM, and CSF.18 We applied the Constrained Laplacian Anatomic Segmentation Using Proximity (CLASP) algorithm to generate models of GM-WM and GM-CSF surfaces.19 CLASP iteratively warps a surface to the GM-WM boundary and estimates the outer surface by expanding the inner along a laplacian map. Surfaces were aligned on the basis of cortical folding, improving anatomic correspondence.20 Surface extraction accuracy was visually verified, and corrections were made when necessary.
Resting-state fMRI
Processing was carried out in native functional space with the DPARSF toolbox.19 After discarding the first 5 volumes, we performed slice-time and motion correction, followed by statistical correction for WM and CSF signal and head motion. To correct for residual motion, image frames with a displacement exceeding 0.5 mm were regressed out from the analysis.21 We filtered the time series to 0.01 to 0.08 Hz and mapped their mean to T1-weighted magnetization-prepared rapid acquisition with gradient echo using a boundary-based linear registration that maximizes the alignment between intensity gradients of structural and echo-planar data.22
Computation of morphologic and functional features
PVNH segmentation
Nodules were manually segmented on T1-weighted images by expert observers (A.B. and N.B.). Manual labels were used to generate a statistical parametric map of distribution, which was overlaid on a 3D reconstruction of the ventricular system.
Cortical thickness
We measured cortical thickness as the euclidean distance between corresponding vertices on GM-WM and GM-CSF surfaces.23
Cortical folding complexity
As in previous work,24,25 we generated a surface running at mid-distance between the GM-WM and GM-CSF surfaces. We then applied a barycentric smoothing with 3 iterations to reduce high-frequency noise in vertex positions.26 Absolute mean curvature was calculated at each vertex to quantify changes in frequency and depth of sulco-gyral folds, expressing gyrification complexity.
Hippocampal malrotation
Vertical orientation and medial positioning are features of the fetal hippocampus until ≈18 weeks of gestation27; their persistence into adult life represents maldevelopment, referred to as malrotation.4 In each participant, 3D models of the left and right hippocampi were created from manually segmented labels to determine sagittal translation, measuring the position of the hippocampus relative to the midline, and longitudinal rotation indexing a relative vertical deviation of the entire hippocampus from its normally horizontal orientation.24 We calculated curvature across multiple points along the length of the hippocampus using a medial axis model.28 In all participants, these features were computed with respect to deviation from a reference average hippocampus manually segmented on the ICBM-152 template.
Functional markers
To evaluate local function, we calculated ReHo, which estimates time-series concordance between a voxel and its neighbors (namely 26 surrounding voxels in a 3 × 3×3 cube) based on the Kendall coefficient of concordance29; this coefficient ranges from 0 to 1, with higher values indicating greater similarity (as a proxy for homogeneous neural activity). DC, quantifying the total number of connections of each voxel to the rest of the brain, evaluated global function.30 These markers were sampled at mid-thickness surface between GM-CSF and GM-WM boundaries and the hippocampal medial surface.
Computational model of the overlying cortex
Figure 1 illustrates the processing steps used to define the cortex overlying the PVNH. Our computational model estimated the fanning shape of trajectories of radial migratory neurons observed in the microscopic studies of developing brains13; to this end, we generated synthetic streamlines linking the ventricular wall and the neocortex. Specifically, in each patient, we computed a Laplacian vector field; the Laplace equation provides layers of equidistant nested surfaces that successively make a smooth transition between 2 boundaries without intersections and a unique curvilinear streamline from a given point on one surface to its counterpart on the other, thus maintaining point-wise correspondence.15 To localize the overlying cortex, we selected those streamlines that intersected with the manually segmented PVNH nodules; we then counted the number of heterotopic GM voxels that overlapped each streamline and projected this value onto the normotopic cortex. Averaging the number of projections across patients provided the group-level map of the overlying cortex.
Figure 1. Computational model of the overlying cortex.
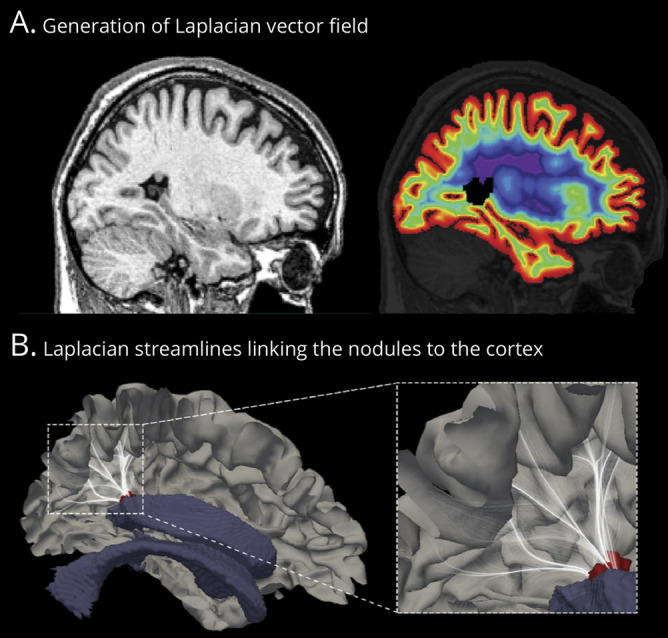
(A) Sagittal MRI section with a single nodule in the atrium of the lateral ventricle (left). We estimated radial migration by generating synthetic streamlines linking the ventricular wall and the neocortex. The laplacian vector field is overlaid on MRI with color-coded equipotential propagation from the ventricles to the neocortex (right). (B) This isopotential field allows the generation of streamlines linking the neocortex and ventricles, thereby providing a guideline to estimate the cortex overlying the nodule. We selected those streamlines (white) that intersected with the manually segmented nodules (red); we then counted the number of heterotopic gray matter voxels that intersected with each streamline and projected this number onto the normotopic cortex. Averaging the number of projections across patients provided the group-level map of the overlying cortex (shown in Figure 2). For visualization purpose, streamlines are displayed with 5% opacity.
Statistical analysis
Analyses were performed with SurfStat for MatLab (MathWorks, Inc, Natick, MA).
Mapping neocortical morphology and function
Before analysis, for each patient cohort (1.5T, 3T), surface-based measurements (cortical thickness, curvature, ReHo, and DC) were blurred with the use of a diffusion kernel that respects topology (full-width half-maximum bandwidth 20 mm) and z normalized at each surface point with respect to the distribution of controls acquired on the same scanner. Linear models assessed group differences in patients relative to controls, with scanner as the covariate. In clusters of findings, we computed the average effect size using the Cohen d. Because curvature might be affected by variations of cortical thickness, we statistically adjusted this metric at every vertex by the corresponding thickness measure.24
Analysis of hippocampal malrotation
Sagittal translation, longitudinal rotation, and point-wise hippocampal curvature were z normalized relative to the corresponding distribution in controls. We assessed differences in patients relative to controls using Student t tests.
Correlational analysis
We assessed the spatial overlap between group-level morphologic findings and the group-level map of the overlying cortex using vertex-wise logistic regression, with thickness/complexity as the dependent variable (set to 1 if a given vertex overlapped with the cluster of significant group difference, 0 if otherwise) and the mean nodular volume (projected onto the overlying cortex) as the independent variable. To verify that associations were not driven by a high number of vertices, we repeated the analysis after parcellating the cortex on the basis of a coarser resolution using the Automated Anatomical Labeling algorithm.31 Linear models assessed statistical associations between neocortical morphology, function, and hippocampal malrotation metrics. To examine possible secondary effects of seizures on findings, we used linear models to relate imaging parameters and disease duration.
Corrections for multiple comparisons
Surface-based analyses were corrected with the random field theory,32 controlling the family-wise error to pFWE < 0.05. For the analysis of hippocampal curvature, a cluster-wise correction for multiple comparisons was carried out using permutation tests with 5,000 iterations.33
Data availability
Surface-based features for all analyses are available on request.
Results
Neocortical morphometry and relationship to the overlying cortex
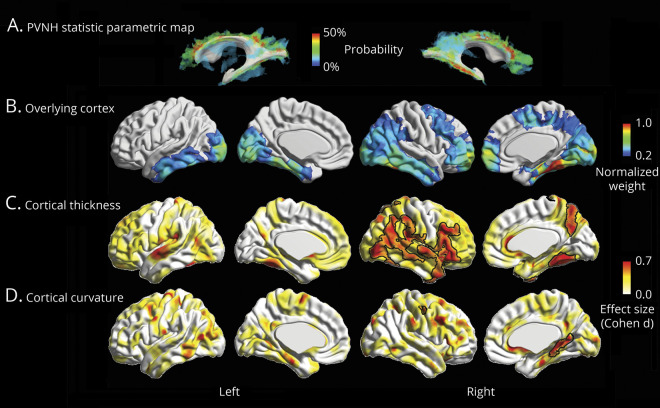
As shown by the statistical parametric map (figure 2A), the majority of PVNH nodules were located in the frontal and temporal horns of the lateral ventricles bilaterally, with a slight tendency for right hemispheric predominance (right vs left nodular volume 4.22 ± 6.3 cm3 vs 3.13 ± 5.6 cm3; p = 0.04, Wilcoxon signed-rank test). The group-average map of the computational model of the overlying cortex was well in correspondence with the spatial distribution of the nodules (figure 2B).
Figure 2. Neocortical morphometry and relationship to the overlying cortex.
(A) Group-level statistical parametric map displaying the probability of periventricular nodular heterotopia (PVNH) along the ventricular walls. (B) Group-level map of the overlying cortex obtained by averaging the number of heterotopic voxels intersecting with the synthetic laplacian streamlines (see figure 1 and text for details), expressed as normalized weight (1 is the highest value, 0 the lowest value). Group-level (C) cortical thickness and (D) complexity increases relative to controls, expressed as Cohen d effect size. Significant clusters corrected for multiple comparisons with random field theory at pFWE < 0.05 are outlined in black.
Compared to controls, patients showed bilateral multilobar cortical thickening (figure 2C). Effects were stronger in the right hemisphere, encompassing the ventrolateral prefrontal, lateral, and basal temporal cortices, as well as the temporoparietal junction (pFWE < 0.02; Cohen d = 0.70). The distribution of group-level increases in cortical thickness showed good correspondence with the group-averaged map of the overlying cortex. Moreover, findings were quantitatively validated through vertex-wise (p < 0.001) and parcel-wise (p = 0.03) logistic regression.
Analysis of cortical complexity revealed bilaterally increased curvature (figure 2D), with the strongest effect in the right posterior parahippocampal area (pFWE < 0.001; d = 0.64) and a small cluster in the left central cortex (pFWE = 0.037; d = 0.60). The distribution of these alterations did not show overlap with the cortex overlying the nodules.
In clusters of cortical thickness and curvature findings, we found no differences between unilateral and bilateral PVNH; contrasting brain-wide metrics directly between the 2 cohorts also was unrevealing. In addition, there was no relationship to disease duration.
Neocortical functional analysis
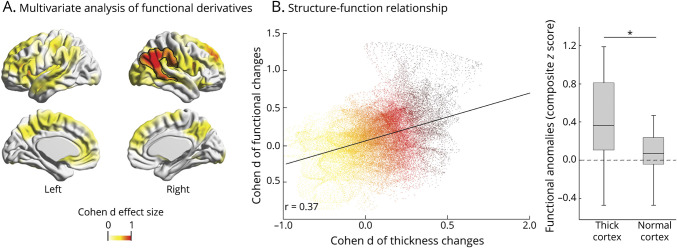
While univariate analysis of ReHo and DC showed subthreshold differences compared to controls, their joint (multivariate) assessment revealed a significant difference in the right temporoparietal junction (Hoteling T tests; pFWE = 0.04; d = 0.95; figure 3A) largely colocalized with clusters of group-wise increased cortical thickness. Two complementary analyses confirmed pathologic structure-function coupling (figure 3B). First, we found a positive correlation (r = 0.37, p < 0.001) between whole-brain vertex-wise effect sizes of cortical thickness changes and functional anomalies. Second, functional anomalies were higher in clusters of increased cortical thickness (figure 2) than in those with no group differences (t = 2.56, p = 0.02). In addition, we found a trend for positive correlation between longer disease duration and increased severity of functional anomalies (r = 0.46, p = 0.07).
Figure 3. Neocortical functional analysis and relationship to morphology.
(A) Multivariate group differences of degree centrality and regional homogeneity in patients relative to healthy controls; significant clusters, expressed as the Cohen d effect size, are corrected for multiple comparisons using random field theory at pFWE < 0.05 and outlined in black. (B) Two complementary analyses assessed structure-function relationship. Scatterplot shows a positive cortex-wide correlation between the Cohen d effect sizes of periventricular nodular heterotopia against healthy control group differences in cortical thickness and function. Box-and-whisker plot in patients shows that areas with increased cortical thickness have altered function compared to those with normal thickness (*paired t test, p < 0.05). Only patients with 3T MRI were included in these analyses.
Hippocampal analysis
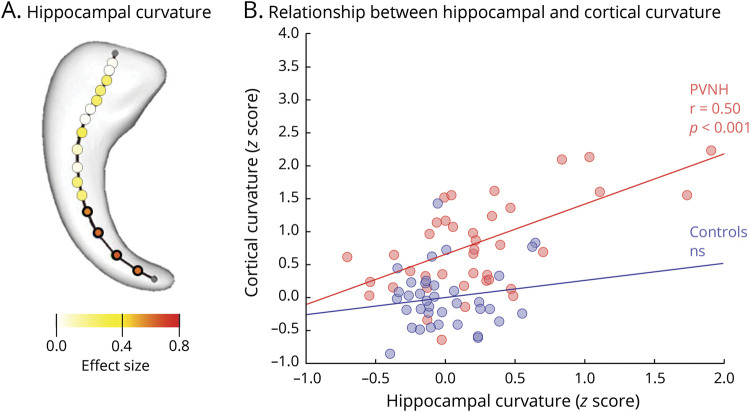
Given the absence of hemispheric differences in either controls or patients, we averaged left and right measurements into a single value. Compared to controls, patients showed increased sagittal translation, signifying medial positioning (pBonferroni = 0.008), and longitudinal rotation, reflecting verticalization (pBonferroni = 0.05). Hippocampal curvature also was increased (pBonferroni = 0.012) with marked bending at the level of the tail (pFWE < 0.002; figure 4A).
Figure 4. Hippocampal malrotation and relationship to morphology.
(A) Gaussian curvature of the hippocampal main axis computed across 18 equidistant points are color-coded with respect to the effect size of changes between patients and controls, showing marked bending in patients, particularly at the level of hippocampal tail. (B) Scatterplot shows a positive correlation between hippocampal curvature and clusters of increased cortical complexity in patients (r = 0.50, p < 0.001) but not in healthy controls. PVNH = periventricular nodular heterotopia.
With respect to functional derivatives, we found increased ReHo, suggesting local hippocampal hyperconnectivity (pFWE = 0.02, d = 1.1).
Hippocampal malrotation indices positively correlated with cortical complexity in patients (r = 0.50, p < 0.001; figure 4B), while no relationship was found in controls. Conversely, no relationship was found among malrotation, hippocampal function, cortical thickness, nodular volume, or disease duration.
Discussion
Our findings show widespread structural and functional alterations in PVNH with differential link to the overlying cortex and the hippocampus. Confirming our hypothesis, we observed cortical thickening preferentially in cortices overlying the nodules, which colocalized with areas of abnormal function. Complementary analyses confirmed pathologic structure-function coupling, first through a positive correlation between whole-brain vertex-wise effect sizes of cortical thickness changes and functional anomalies and second in functional anomalies that were higher in clusters of increased cortical thickness than in those with no group differences. In addition, we found increased complexity of the parahippocampal cortex, which did not overlap with the cortex overlying the nodules but correlated with indices of hippocampal malrotation. Overall findings predominated in the right hemisphere, in line with molecular studies showing higher levels of gene transcription during neuronal proliferation and migration.
Contrary to previous work in which the overlying cortex was undefined or estimated qualitatively on the basis of 2D orthogonal imaging planes,5,11,34,35 we used Laplace streamlines as an objective mean to quantify migratory routes in 3 dimensions. Given its inherent nonintersecting and topology-preserving properties, this computational model has applicability over a broad range of phenomena in neuroscience, including efficient extraction of the highly convoluted brain surfaces.36–38 In our patients, the group-average map of the overlying cortex was well in correspondence with the spatial distribution of periventricular nodules and showed increased thickness, findings further validated through vertex-wise and parcel-wise logistic regression. These anomalies, not noticeable in single patients, are suggestive of an underlying subtle cortical dysplasia.5,11 Another contributing factor may be altered cellular maturation with deficient synaptic pruning. Indeed, in a preclinical model, abnormal expression of filamin A protein, responsible for neuroblast migration, led to hypertrophic dendrites with complex arborization and increased length,39 which may translate into increased thickness of the cortex. In our cohort of sporadic cases including both bilateral and unilateral PVNH, while a genetic origin cannot be excluded, only 4 female patients presented with bilateral contiguous nodules, a phenotype associated with filamin A mutation. In 2 of them who underwent testing, results were negative. Therefore, we could not establish a possible link between the observed structural alterations on MRI and a given genetic fingerprint. Regardless of the pathogenic mechanisms, similar to our results, aberrant morphogenesis has been shown to contribute to abnormal connectivity and function in both preclinical models40 and humans,23,41,42 a notion also reflected by the epileptogenicity of the normotopic cortex.43 Similarly, in our patients, the progression of functional anomalies, as shown by the positive correlation with disease duration, may have been at least partially related to secondary effect of seizures.
A striking finding was the burden of temporal lobe pathology, comprising high nodular load with associated thickening of the overlying cortex, increased folding complexity of the parahippocampal region, hippocampal malrotation, and hyperconnectivity. Admittedly, a right-sided predominance of anomalies may be due to a sample bias specific to our cohort. However, when examining our database of >100 patients, we found a similar hemispheric prevalence of nodular load regardless of the heterotopia subtypes. Thus, a plausible explanation may lie in the differential hemispheric impact of an early insult, likely genetically determined, on brain morphogenesis. Indeed, molecular studies have shown asymmetry of gene transcription in early phases of cortical development, with higher levels in the right hemisphere compared to the left.44 In support of our finding, this side preponderance is also suggested by surgical series showing that, regardless of the heterotopia subtype and lateralization, the seizure onset zone and PET hypometabolism are often found on the right.5,11,43 Furthermore, fetal imaging indicates that the right hemisphere, including the hippocampus and parahippocampus, develops early.45
Hippocampal malrotation features have previously been shown to be most prevalent and severe in heterotopias compared to other cortical malformations.4,28 Here, we found a positive relationship between malrotation and sulco-gyral complexity of the parahippocampal region. Comparative studies across species, including primates, provide evidence for a correlation between dentate gyrus convolution and neocortical gyrification.46 This suggests that processes leading to cortical and hippocampal folding are similar and likely involve mechanical forces resulting from variable tension of growth between early cortical strata, internal and cross-regional axonal tension, and changes in connectivity.47 It is thus plausible that pathologic mechanisms affecting hippocampal development in PVNH may alter the gyrification of the parahippocampal region, receiving their main projections from the hippocampus.48 Aberrant connectivity is also suggested by our findings of hippocampal functional hyperconnectivity and WM microstructural anomalies previously reported in this condition.49 While hippocampal malrotation may be considered a nonpathologic variant in other syndromes, particularly temporal lobe epilepsy,50 its role beyond a general marker of maldevelopment remains to be further clarified in PVNH. Given the involvement of the mesial temporal structures in the epileptic circuitry,8,9 future studies relating the severity of malrotation features to measure of epileptogenicity may shed light on the possible modulatory effects of hippocampal maldevelopment in this condition.
Glossary
- CLASP
Constrained Laplacian Anatomic Segmentation Using Proximity
- DC
degree centrality
- GM
gray matter
- PVNH
periventricular nodular heterotopia
- ReHo
regional homogeneity
- WM
white matter
Appendix. Authors
Study funding
This work was funded by the Canadian Institutes of Health Research (CIHR MOP-57840 to A.B. and CIHR MOP-123520 to N.B.), Natural Sciences and Research Council (Discovery-243141 to A.B. and 24,779 to N.B.), Epilepsy Canada (Jay & Aiden Barker Breakthrough Grant in Clinical & Basic Sciences to A.B.), and Canada First Research Excellence Fund (HBHL-1a-5a-06 to N.B.). Salary supports were provided by Paolo Zorzi Association for Neurosciences and Fondazione Banca del Monte di Lombardia (F.D.), Canadian league Against Epilepsy (S.-J. Hong), Savoy Foundation for Epilepsy (F.F.), and Lloyd Carr-Harris Foundation (B.C.).
Disclosure
The authors report no disclosures relevant to the manuscript. Go to Neurology.org/N for full disclosures.
References
- 1.Guerrini R, Dobyns WB. Malformations of cortical development: clinical features and genetic causes. Lancet Neurol 2014;13:710–726. [DOI] [PMC free article] [PubMed] [Google Scholar]
- 2.Matsumoto N, Hoshiba Y, Morita K, et al. Pathophysiological analyses of periventricular nodular heterotopia using gyrencephalic mammals. Hum Mol Genet 2017;26:1173–1181. [DOI] [PubMed] [Google Scholar]
- 3.Thom M, Martinian L, Parnavelas JG, Sisodiya SM. Distribution of cortical interneurons in grey matter heterotopia in patients with epilepsy. Epilepsia 2004;45:916–923. [DOI] [PubMed] [Google Scholar]
- 4.Bernasconi N, Kinay D, Andermann F, Antel S, Bernasconi A. Analysis of shape and positioning of the hippocampal formation: an MRI study in patients with partial epilepsy and healthy controls. Brain 2005;128:2442–2452. [DOI] [PubMed] [Google Scholar]
- 5.Tassi L, Colombo N, Cossu M, et al. Electroclinical, MRI and neuropathological study of 10 patients with nodular heterotopia, with surgical outcomes. Brain 2005;128:321–337. [DOI] [PubMed] [Google Scholar]
- 6.Pizzo F, Roehri N, Catenoix H, et al. Epileptogenic networks in nodular heterotopia: a stereoelectroencephalography study. Epilepsia 2017;58:2112–2123. [DOI] [PubMed] [Google Scholar]
- 7.Christodoulou JA, Walker LM, Del Tufo SN, et al. Abnormal structural and functional brain connectivity in gray matter heterotopia. Epilepsia 2012;53:1024–1032. [DOI] [PMC free article] [PubMed] [Google Scholar]
- 8.Tyvaert L, Hawco C, Kobayashi E, LeVan P, Dubeau F, Gotman J. Different structures involved during ictal and interictal epileptic activity in malformations of cortical development: an EEG-fMRI study. Brain 2008;131:2042–2060. [DOI] [PMC free article] [PubMed] [Google Scholar]
- 9.Archer JS, Abbott DF, Masterton RaJ, Palmer SM, Jackson GD. Functional MRI interactions between dysplastic nodules and overlying cortex in periventricular nodular heterotopia. Epilepsy Behav 2010;19:631–634. [DOI] [PubMed] [Google Scholar]
- 10.Garbelli R, Rossini L, Moroni RF, et al. Layer-specific genes reveal a rudimentary laminar pattern in human nodular heterotopia. Neurology 2009;73:746–753. [DOI] [PubMed] [Google Scholar]
- 11.Meroni A, Galli C, Bramerio M, et al. Nodular heterotopia: a neuropathological study of 24 patients undergoing surgery for drug-resistant epilepsy. Epilepsia 2009;50:116–124. [DOI] [PubMed] [Google Scholar]
- 12.Gonzaĺez G, Vedolin L, Barry B, Poduri A, Walsh C, Barkovich AJ. Location of periventricular nodular heterotopia is related to the malformation phenotype on MRI. Am J Neuroradiol 2013;34:877–883. [DOI] [PMC free article] [PubMed] [Google Scholar]
- 13.Lui JH, Hansen DV, Kriegstein AR. Development and evolution of the human neocortex. Cell 2011;146:18–36. [DOI] [PMC free article] [PubMed] [Google Scholar]
- 14.Kolasinski J, Takahashi E, Stevens AA, et al. Radial and tangential neuronal migration pathways in the human fetal brain: anatomically distinct patterns of diffusion MRI coherence. Neuroimage 2013;79:412–422. [DOI] [PMC free article] [PubMed] [Google Scholar]
- 15.Jones SE, Buchbinder BR, Aharon I. Three-dimensional mapping of cortical thickness using Laplace's equation. Hum Brain Mapp 2000;11:12–32. [DOI] [PMC free article] [PubMed] [Google Scholar]
- 16.Sled JG, Zijdenbos AP, Evans AC. A nonparametric method for automatic correction of intensity nonuniformity in MRI data. IEEE Trans Med Imaging 1998;17:87–97. [DOI] [PubMed] [Google Scholar]
- 17.Fonov V, Evans AC, Botteron K, Almli CR, McKinstry RC, Collins DL. Unbiased average age-appropriate atlases for pediatric studies. Neuroimage 2011;54:313–327. [DOI] [PMC free article] [PubMed] [Google Scholar]
- 18.Kim H, Caldairou B, Hwang JW, et al. Accurate cortical tissue classification on MRI by modeling cortical folding patterns. Hum Brain Mapp 2015;36:3563–3574. [DOI] [PMC free article] [PubMed] [Google Scholar]
- 19.Chao-Gan Y, Yu-Feng Z. DPARSF: a MATLAB toolbox for “pipeline” data analysis of resting-state fMRI. Front Syst Neurosci 2010;4:13. [DOI] [PMC free article] [PubMed] [Google Scholar]
- 20.Lyttelton O, Boucher M, Robbins S, Evans A. An unbiased iterative group registration template for cortical surface analysis. Neuroimage 2007;34:1535–1544. [DOI] [PubMed] [Google Scholar]
- 21.Power JD, Barnes KA, Snyder AZ, Schlaggar BL, Petersen SE. Spurious but systematic correlations in functional connectivity MRI networks arise from subject motion. Neuroimage 2012;59:2142–2154. [DOI] [PMC free article] [PubMed] [Google Scholar]
- 22.Greve DN, Fischl B. Accurate and robust brain image alignment using boundary-based registration. Neuroimage 2009;48:63–72. [DOI] [PMC free article] [PubMed] [Google Scholar]
- 23.Hong SJ, Bernhardt BC, Caldairou B, et al. Multimodal MRI profiling of focal cortical dysplasia type II. Neurology 2017;88:734–742. [DOI] [PMC free article] [PubMed] [Google Scholar]
- 24.Voets NL, Bernhardt BC, Kim H, Yoon U, Bernasconi N. Increased temporolimbic cortical folding complexity in temporal lobe epilepsy. Neurology 2011;76:138–144. [DOI] [PMC free article] [PubMed] [Google Scholar]
- 25.Hong S-J, Bernhardt BC, Schrader DS, Bernasconi N, Bernasconi A. Whole-brain MRI phenotyping in dysplasia-related frontal lobe epilepsy. Neurology 2016;86:643–650. [DOI] [PMC free article] [PubMed] [Google Scholar]
- 26.Im K, Lee JM, Lyttelton O, Kim SH, Evans AC, Kim SI. Brain size and cortical structure in the adult human brain. Cereb Cortex 2008;18:2181–2191. [DOI] [PubMed] [Google Scholar]
- 27.Humphrey T. The development of the human hippocampal fissure. J Anat 1967;101:655–676. [PMC free article] [PubMed] [Google Scholar]
- 28.Kim H, Mansi T, Bernasconi N. Disentangling hippocampal shape anomalies in epilepsy. Front Neurol 2013;4:131. [DOI] [PMC free article] [PubMed] [Google Scholar]
- 29.Zang Y, Jiang T, Lu Y, He Y, Tian L. Regional homogeneity approach to fMRI data analysis. Neuroimage 2004;22:394–400. [DOI] [PubMed] [Google Scholar]
- 30.Zuo XN, Ehmke R, Mennes M, et al. Network centrality in the human functional connectome. Cereb Cortex 2012;22:1862–1875. [DOI] [PubMed] [Google Scholar]
- 31.Tzourio-Mazoyer N, Landeau B, Papathanassiou D, et al. Automated anatomical labeling of activations in SPM using a macroscopic anatomical parcellation of the MNI MRI single-subject brain. Neuroimage 2002;15:273–289. [DOI] [PubMed] [Google Scholar]
- 32.Worsley KJ, Andermann M, Koulis T, MacDonald D, Evans AC. Detecting changes in nonisotropic images. Hum Brain Mapp 1999;8:98–101. [DOI] [PMC free article] [PubMed] [Google Scholar]
- 33.Nichols TE, Holmes AP. Nonparametric permutation tests for functional neuroimaging: a primer with examples. Hum Brain Mapp 2002;15:1–25. [DOI] [PMC free article] [PubMed] [Google Scholar]
- 34.Aghakhani Y, Kinay D, Gotman J, et al. The role of periventricular nodular heterotopia in epileptogenesis. Brain 2005;128:641–651. [DOI] [PubMed] [Google Scholar]
- 35.Kitaura H, Oishi M, Takei N, et al. Periventricular nodular heterotopia functionally couples with the overlying hippocampus. Epilepsia 2012;53:e127–e131. [DOI] [PubMed] [Google Scholar]
- 36.Kim JS, Singh V, Lee JK, et al. Automated 3-D extraction and evaluation of the inner and outer cortical surfaces using a laplacian map and partial volume effect classification. Neuroimage 2005;27:210–221. [DOI] [PubMed] [Google Scholar]
- 37.Vasung L, Lepage C, Radoš M, et al. Quantitative and qualitative analysis of transient fetal compartments during prenatal human brain development. Front Neuroanat 2016;10:11. [DOI] [PMC free article] [PubMed] [Google Scholar]
- 38.Kim H, Lepage C, Maheshwary R, et al. NEOCIVET: towards accurate morphometry of neonatal gyrification and clinical applications in preterm newborns. Neuroimage 2016;138:28–42. [DOI] [PMC free article] [PubMed] [Google Scholar]
- 39.Zhang L, Bartley CM, Gong X, et al. MEK-ERK1/2-dependent FLNA overexpression promotes abnormal dendritic patterning in tuberous sclerosis independent of mTOR. Neuron 2014;84:78–91. [DOI] [PMC free article] [PubMed] [Google Scholar]
- 40.Zhan Y, Paolicelli RC, Sforazzini F, et al. Deficient neuron-microglia signaling results in impaired functional brain connectivity and social behavior. Nat Neurosci 2014;17:400–406. [DOI] [PubMed] [Google Scholar]
- 41.Hong SJ, Bernhardt BC, Gill RS, Bernasconi N, Bernasconi A. The spectrum of structural and functional network alterations in malformations of cortical development. Brain 2017;140:2133–2143. [DOI] [PubMed] [Google Scholar]
- 42.Hong SJ, Lee HM, Gill R, et al. A connectome-based mechanistic model of focal cortical dysplasia. Brain 2019;142:688–699. [DOI] [PMC free article] [PubMed] [Google Scholar]
- 43.Mirandola L, Mai RF, Francione S, et al. Stereo-EEG: diagnostic and therapeutic tool for periventricular nodular heterotopia epilepsies. Epilepsia 2017;58:1962–1971. [DOI] [PubMed] [Google Scholar]
- 44.Sun T, Patoine C, Abu-Khalil A, et al. Early asymmetry of gene transcription in embryonic human left and right cerebral cortex. Science 2005;308:1794–1798. [DOI] [PMC free article] [PubMed] [Google Scholar]
- 45.Habas PA, Scott JA, Roosta A, et al. Early folding patterns and asymmetries of the normal human brain detected from in utero MRI. Cereb Cortex 2012;22:13–25. [DOI] [PMC free article] [PubMed] [Google Scholar]
- 46.Hevner RF. Evolution of the mammalian dentate gyrus. J Comp Neurol 2016;524:578–594. [DOI] [PMC free article] [PubMed] [Google Scholar]
- 47.Garcia KE, Kroenke CD, Bayly PV. Mechanics of cortical folding: stress, growth and stability. Philos Trans R Soc Lond B Biol Sci 2018;373:20170321. [DOI] [PMC free article] [PubMed] [Google Scholar]
- 48.Blatt GJ, Rosene DL. Organization of direct hippocampal efferent projections to the cerebral cortex of the rhesus monkey: projections from CA1, prosubiculum, and subiculum to the temporal lobe. J Comp Neurol 1998;392:92–114. [DOI] [PubMed] [Google Scholar]
- 49.Farquharson S, Tournier J-D, Calamante F, et al. Periventricular nodular heterotopia: detection of abnormal microanatomic fiber structures with whole-brain diffusion MR imaging tractography. Radiology 2016;281:896–906. [DOI] [PubMed] [Google Scholar]
- 50.Tsai MH, Vaughan DN, Perchyonok Y, et al. Hippocampal malrotation is an anatomic variant and has no clinical significance in MRI-negative temporal lobe epilepsy. Epilepsia 2016;57:1719–1728. [DOI] [PubMed] [Google Scholar]
Associated Data
This section collects any data citations, data availability statements, or supplementary materials included in this article.
Data Availability Statement
Surface-based features for all analyses are available on request.


