INTRODUCTION
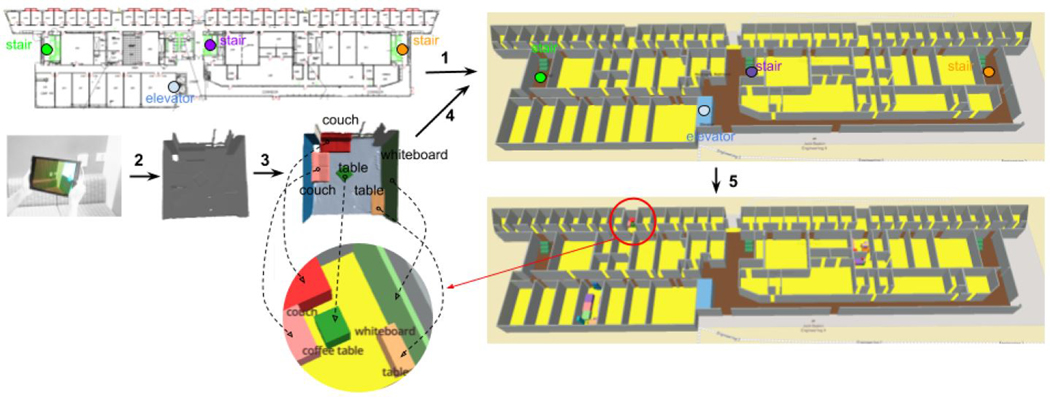
Interactive 3D visualization of building interiors provides enhanced experience of spatial exploration with respect to traditional static maps. Using mapping platforms such as Mapbox1, 3D pop-up environments can be easily rendered on top of generic 2D maps from web applications such as Google Map or OpenStreetMap (Fig. 1). This type of 3D rendering may afford more intuitive and engaging access to complex building layouts, and may enable interactive features such as displaying a selected floor of a building, or activating groups of features on different levels of detail. This contribution introduces Semantic Interior Mapology (SIM), a toolbox for the conversion of a floor plan and its room contents (such as furnitures) to a vectorized form (Fig. 1.) SIM has two main components: Map Conversion and Map Population.
Figure 1:
The SIM toolbox workflow. (1) A floor plan is manually traced and visualized as an extruded 3D object on OpenStreetMap, with some of its fixtures labeled. (2) A room is scanned with an RGB-D sensor. (3) Objects of interest, such as furnitures, are segmented using a semi-automatic process. (4) The 3D room scan is registered with the floor plan, and (5) objects are automatically placed onto the map at their correct location.
MAP CONVERSION
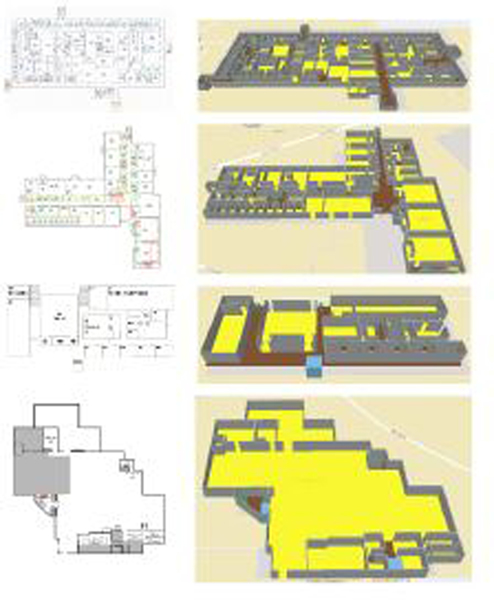
The Map Conversion toolkit is a web application with an intuitive interface designed to easily convert floor plans into a digital format amenable to interactive visualization. It allows one to quickly and accurately trace a floor plan from an image of it, and generate a vectorized map. SIM’s tracing interface exploits the fact that most floor plans have straight walls intersecting at 90 degrees (although the toolkit also supports less common situations with walls at arbitrary orientation). Rather than tracing wall segments by selecting endpoints (as with other web applications such as Google My Map or Mapbox Studio), the Map Conversion toolkit lets the user define a grid of horizontal and vertical lines, where each line overlaps with a segment in the floor plan representing a wall. The user simply Shift-clicks on a segment to generate a line with the desired orientation. In typical layouts, the same line may contain multiple disjoint wall segments that happen to be co-planar. This strategy is very convenient in the case of repetitive layouts, as it reduces the number of required input selections, and ensures that co-planar walls are traced by segments that are correctly aligned with each other. Complex building layouts, like those shown in Fig. 3, can be traced in just a few minutes. Floor plan tracing produces a spatial information hierarchically organized in terms of spaces. Each space is characterized by a set of wall corners and possibly entrance corners, where pairs of adjacent wall corners may or may not be joined by a wall. We store this information in sim, a file format inspired by the Polygon File Format (PLY). The Map Conversion toolkit contains a converter from sim into GeoJSON, a popular format for representing spatial information.
Figure 3:
Examples of application of our Map Conversion toolkit.
MAP POPULATION
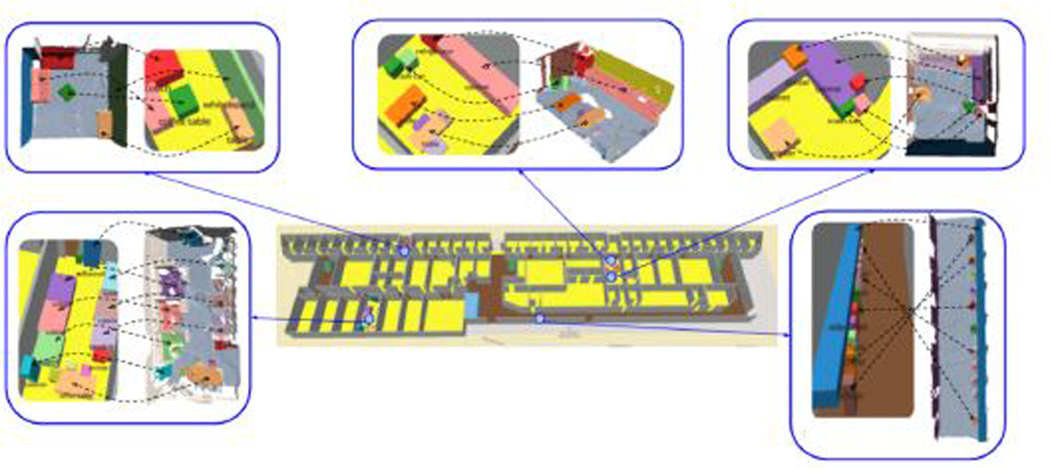
The Map Population toolkit allows one to insert 3D objects, such as furniture, into a GeoJSON representation of a floor plan. Objects are extracted from a 3D scan of the environment, and represented as cuboids (see Fig. 2). The 3D scans can be obtained using off-the-shelf RGB-D cameras, such as Occipital’s Structure Sensor2, which has a RGB-D camera and software for registration and stitching of multiple 3D point clouds into one mesh, stored in a PLY format. A semi-automatic procedure, organized in a sequence of stages (orientation, rectification/rescaling, segmentation), enables segmentation of the visible surfaces into objects of interest. This spatial data is then geo-registered with the GeoJSON representation of the same environment, generated by the Map Conversion toolkit, and used to “populate” the interior by adding the desired items into the same GeoJSON file. To render a floor plan’s 3D map view, we employ the MapboxGL JS3 engine, a location data platform. Geodetic features stored in a GeoJSON file are shown as extruded 3D objects on OpenStreetMap, which can be accessed and interacted with from a regular web browser.
Figure 2:
The bounding boxes of individually segmented objects are placed in the GeoJSON file containing the building’s floor plan. The entire building with its objects of interest is displayed over OpenStreetMap.
Footnotes
Mapbox. https://www.mapbox.com/
Structure Sensor. https://structure.io/
MapboxGL JS. https://docs.mapbox.com/mapbox-gl-js/
Contributor Information
Viet Trinh, Computer Science and Engineering University of California, Santa Cruz.
Roberto Manduchi, Computer Science and Engineering University of California, Santa Cruz.


