Abstract
Accumulation of abnormal tau in neurofibrillary tangles (NFT) occurs in Alzheimer disease (AD) and a spectrum of tauopathies. These tauopathies have diverse and overlapping morphological phenotypes that obscure classification and quantitative assessments. Recently, powerful machine learning-based approaches have emerged, allowing the recognition and quantification of pathological changes from digital images. Here, we applied deep learning to the neuropathological assessment of NFT in postmortem human brain tissue to develop a classifier capable of recognizing and quantifying tau burden. The histopathological material was derived from 22 autopsy brains from patients with tauopathies. We used a custom web-based informatics platform integrated with an in-house information management system to manage whole slide images (WSI) and human expert annotations as ground truth. We utilized fully annotated regions to train a deep learning fully convolutional neural network (FCN) implemented in PyTorch against the human expert annotations. We found that the deep learning framework is capable of identifying and quantifying NFT with a range of staining intensities and diverse morphologies. With our FCN model, we achieved high precision and recall in naive WSI semantic segmentation, correctly identifying tangle objects using a SegNet model trained for 200 epochs. Our FCN is efficient and well suited for the practical application of WSIs with average processing times of 45 min per WSI per GPU, enabling reliable and reproducible large-scale detection of tangles. We measured performance on test data of 50 pre-annotated regions on eight naive WSI across various tauopathies, resulting in the recall, precision, and an F1 score of 0.92, 0.72, and 0.81, respectively. Machine learning is a useful tool for complex pathological assessment of AD and other tauopathies. Using deep learning classifiers, we have the potential to integrate cell- and region-specific annotations with clinical, genetic, and molecular data, providing unbiased data for clinicopathological correlations that will enhance our knowledge of the neurodegeneration.
Introduction
Tau-related neurodegenerative disorders, the tauopathies, comprise a heterogeneous group of disorders with a clinical spectrum that includes primary motor symptoms, movement disorder, psychiatric dysfunction, and cognitive impairment [1]. Histomorphologically, tauopathies are characterized by intracellular deposition of hyperphosphorylated tau protein. Various isoform compositions, morphology, and anatomical distributions of intracellular tau represent distinct diagnostic features of tauopathies [1–3]. How pathological tau causes neuronal dysfunction and degeneration is unclear. Several mechanisms have been implicated, including both genetic and environmental risk factors, but most cases are idiopathic [1, 3–5]. Sporadic tauopathies, such as the vast majority of Alzheimer disease (AD) and progressive supranuclear palsy (PSP) cases, are associated with common genetic risk alleles [1, 3]. Rare highly penetrant mutations in the microtubule-associated protein tau gene are associated with some forms of frontotemporal lobar degeneration [6]. Environmental factors, such as traumatic brain injury in the case of chronic traumatic encephalopathy (CTE) or putative neurotoxins, have also been implicated [7, 8]. Pathological changes in tau metabolism and post-translational modifications result in the accumulation of toxic forms of misfolded tau aggregates in neurons and glial cells in various brain regions. These misfolded aggregates are associated with loss of function and ultimately cell death [1, 2].
Pathological tau forms inclusions in neurons and glia with histomorphologically distinguishable features. In neurons, these take the form of the classical flame-shaped intracellular neurofibrillary tangles (NFTs), granular pre-NFTs, extracellular “ghost” tangles, ring tangles, and globose tangles, among others [9]. In glia, there is a spectrum of characteristic histomorphological forms that are commonly associated with specific diseases, including glial plaques of corticobasal degeneration, tufted astrocytes of PSP, globular astroglial inclusions in globular glial tauopathy, ramified astrocytes of Pick disease, and thorn-shaped astrocytes as well as granular fuzzy astrocytes of aging-related tau astrogliopathy [9–11]. One recently proposed classification scheme codifies seven primary tauopathies, and two secondary tauopathies under the umbrella of neurodegenerative diseases, each with a unique constellation of regional vulnerability and histomorphology of tau aggregates that define them [1, 2]. Pathological accumulation of hyperphosphorylated tau is also described in various infectious/post-infectious, metabolic, genetic/chromosomal, neoplastic/hamartomatous, and myopathic diseases [12]. Given the complexity and morphological overlap, diagnosing these diseases is a challenge for neuropathologists, and commands a high degree of expertise.
Microscopic analysis of stained postmortem sections by a trained expert remains the only modality of confirmatory diagnosis of tauopathies. Despite the continuous effort and improvements in the field, the analyses required for definitive diagnosis and subtyping of neurodegenerative diseases remain highly time- and cost-consuming and are subject to a substantial degree of inter- and intra-observer variability, thus lacking overall accuracy and precision. The gold standard for histomorphological assessment of tau burden and progression in Alzheimer’s disease is the Braak staging system, which focuses on the hierarchical sequence of tau accumulation, but not a quantitative measurement of tau burden, although distribution and qualitative NFT and thread density are correlated in this staging system [13]. Despite this limitation, the Braak staging system has been widely accepted and adopted for decades for its simplicity and robustness. Recent interest in differential semi-quantitative assessment of tau burden in AD is exemplified in the work of Jellinger [14]. Further, various stages of intracellular pathologic tau accumulation are described (e.g., pre-tangles, mature NFTs, and so-called “ghost” tangles—the remnants of the tau fibrillary scaffold after neuronal cell death; Fig. 1). The Braak staging approach does not address these features, and thus inherently lacks granularity and quantification. At the same time, the field of diagnostic neuropathology is facing challenges related to the overall lack of accuracy, demanded by the ever-evolving research and healthcare standards, and discrepancies with clinicopathological correlations, with a recognized need to address these issues [15].
Fig. 1.
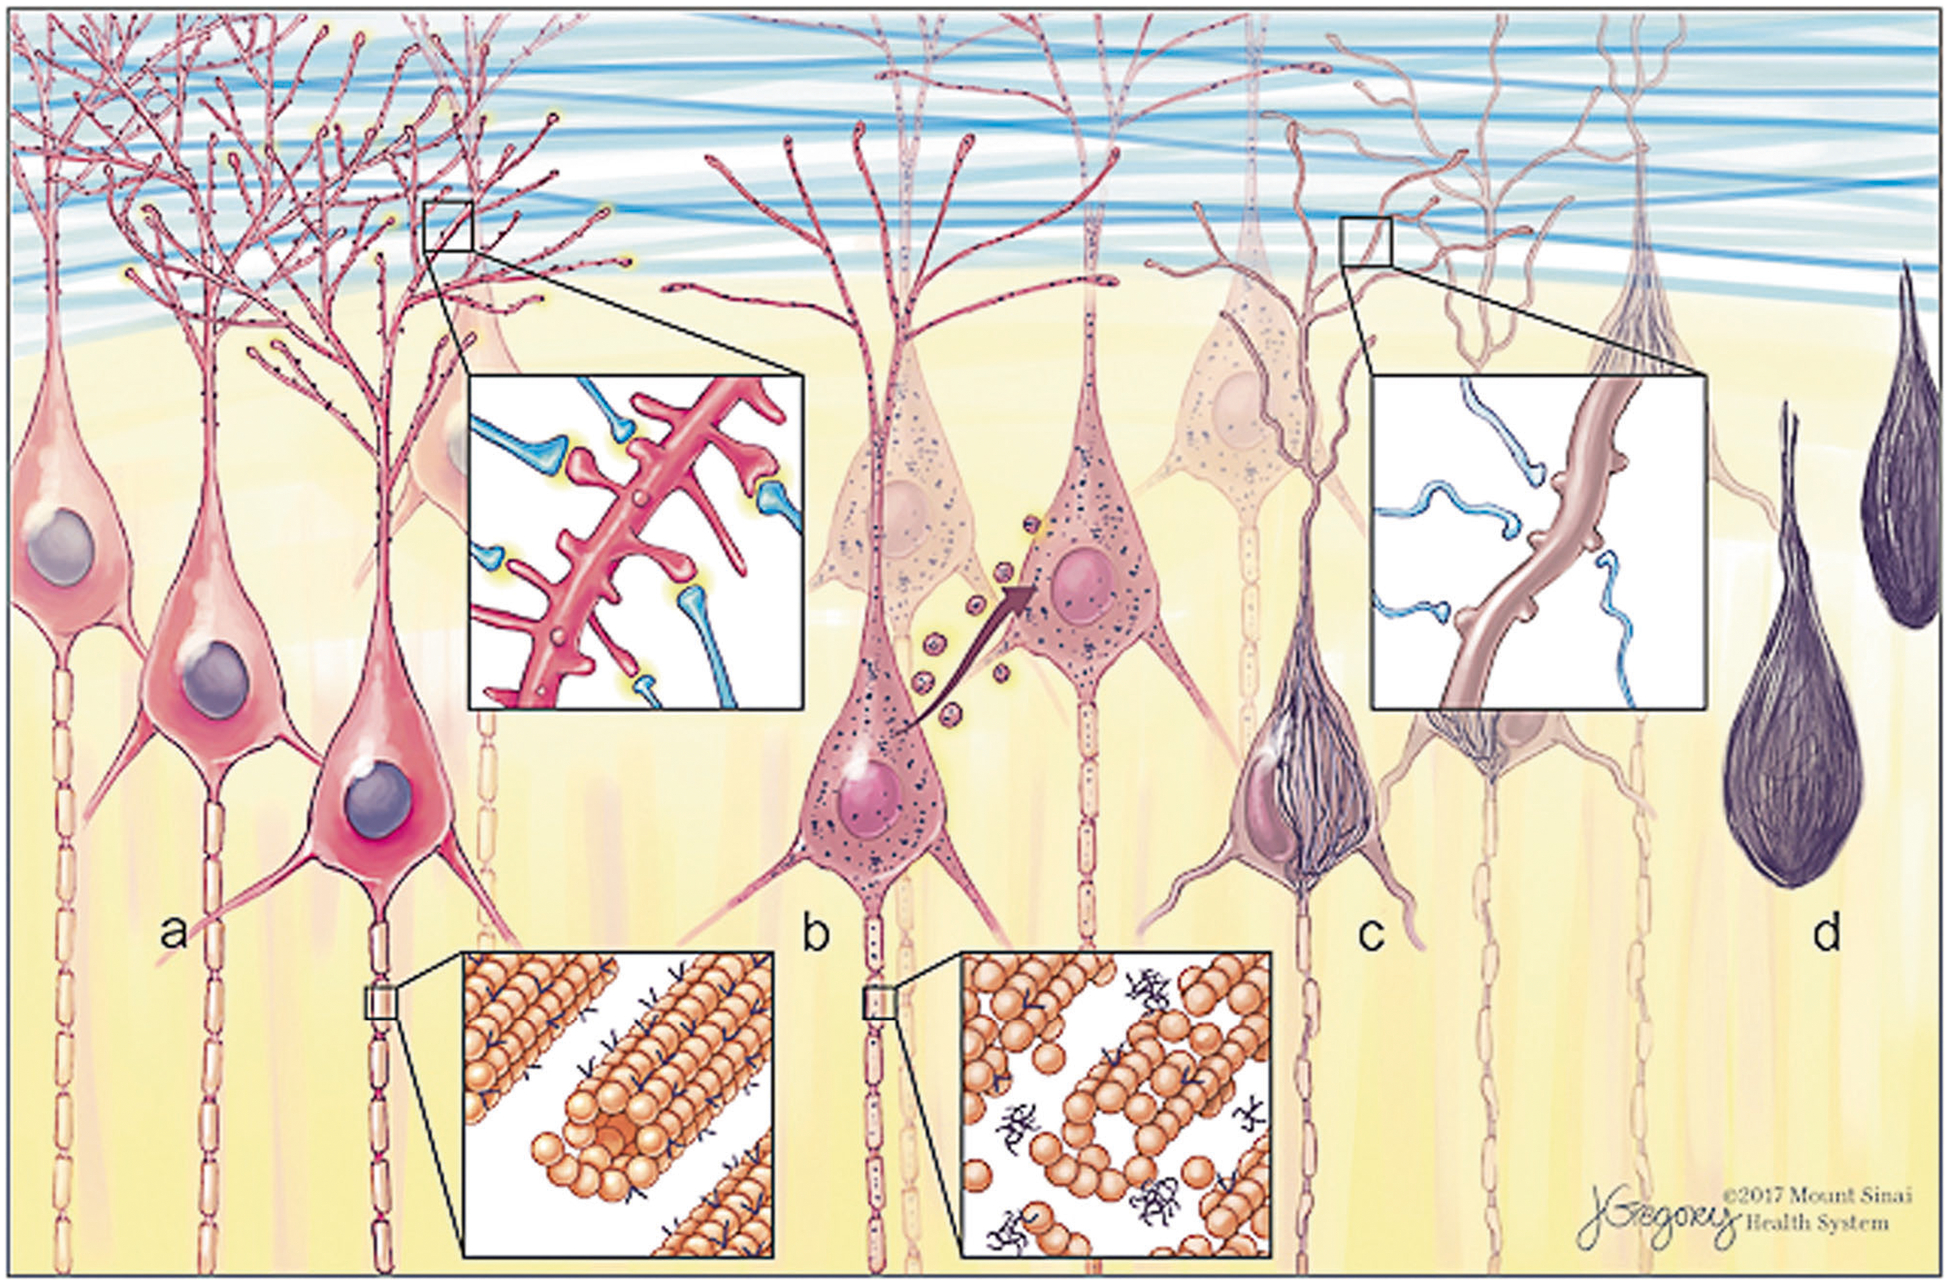
Morphological forms of neurofibrillary tangles (NFT) and progression. Tau is a microtubule-associated protein with normal roles in cytoskeletal stability and synaptic function. Early in disease progression, abnormal hyperphosphorylated tau aggregates (“oligomers”) accumulate as pre-NFT visible by immunohistochemistry as fine granular puncta in neurons. Tau oligomers are proposed to propagate from cell to cell. Aggregates coalesce to form fibrillary inclusions as mature intracellular NFT (iNFT). Neurites begin to die back or collapse and synaptic failure ensues. Cell death leaves only the extracellular aggregate remnant (eNFT), sometimes referred to as a tombstone or ghost tangle
Recently, there has been an increasing interest in developing computational methods to assist the pathologist in histological analysis via digital microscopic whole slide images (WSI). This is primarily intended to reduce the human error rate and bring about uniformity and accuracy in pathological diagnosis [16]. One of the approaches that has been anticipated and sought after for nearly half a century is artificial intelligence (AI) [17, 18]. The most advanced AI, called deep learning (DL), is now used for complex tasks such as speech recognition, language translation, and image recognition and interpretation [19–21]. Litjens et al. provide a comprehensive survey of published studies on the use of AI/DL in medical image analysis including WSI in pathology [17]. Although machine learning-based methods have had limited application in diagnostic pathology to date, due to the variability of laboratory standards and outcomes, and lack of reliable computer-backed platforms, advances have been made recently. The relevance and potential of automated classification algorithms in surgical pathology are exemplified by its application to the histologic grading and progression of breast and prostate cancer [17, 22, 23]. These endeavors pave a way toward increased use of machine learning for improving stratification, characterization, and quantification for many other disease processes, including the neuropathological assessment of tauopathies and AD cohorts. To date, no datasets derived from the application of machine-based learning to neurodegenerative disease are available.
We aimed to develop and test a novel DL algorithm using convolutional neural networks [20] that would be able to recognize, classify, and quantify diagnostic elements of tauopathies on WSI of postmortem human brain tissue specimens from patients with tau-associated neurodegenerative conditions in order to better stratify patients for clinical and other correlative studies (Fig. 2). In this study, we focused on the development, validation, and testing of the DL algorithms for recognition and quantification of NFT in an array of tauopathies. This will allow us to apply these trained networks for larger disease-specific cohorts and to generate quantitative data for clinicopathological correlations, as well as for molecular and genetic studies, and enable further diagnostic and therapeutic strategies.
Fig. 2.
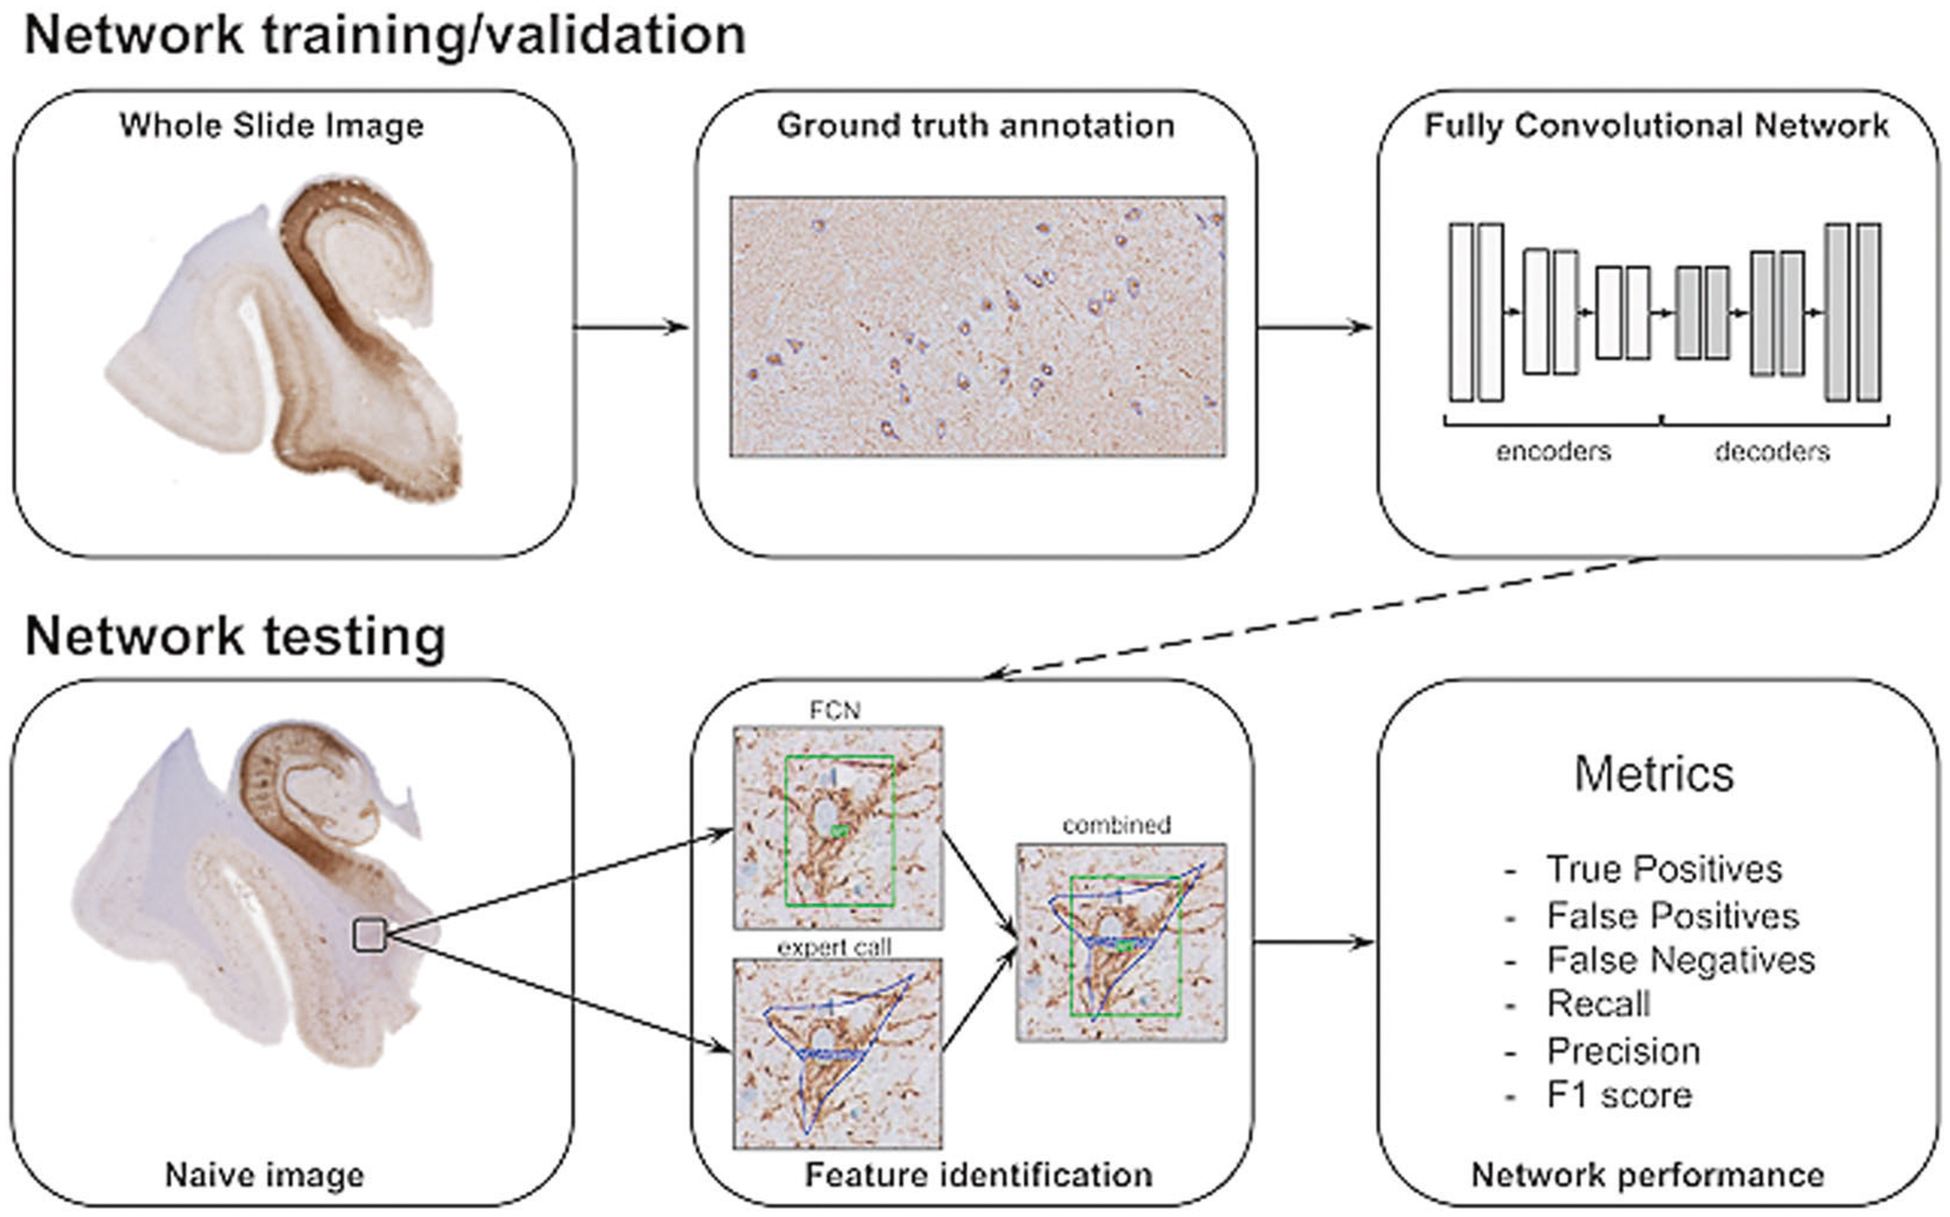
Schematic overview of data annotation and deep learning pipeline. NFT are annotated using whole slide images, marking rectangular areas with complete annotations of NFT objects to give a visual context of NFT against the background. Image patches are extracted for network training that generates pixel-wise segmentations for NFT and background. Performance is determined using a separate novel set of images (test set) by comparing expert annotation with the trained network. Quantitative evaluation on unseen test slides provides a characterization of the behavior of the trained network in terms of robustness, reliability, and reproducibility
Materials and methods
Case material
De-identified autopsy brain tissues were obtained from 22 representative individuals with AD, primary age-related tauopathy (PART), PSP, and CTE [24] (Table 1). This cohort was a convenience sample selected by the investigators. We used the following selection criteria: (i) clinical/pathological: well-characterized clinical case, representative of a variety of pathognomonic diagnostic histomorphological features, and with minimal or absent neuropathological comorbidities; (ii) technical: adequately stained tissue with minimal or no artifacts.
Table 1.
Sample data
| ID | Age | Sex | Diagnosis | Scanner | Source |
|---|---|---|---|---|---|
| Training/validation set | |||||
| 1 | 102 | F | PART | Aperio | UTSW |
| 2 | 103 | M | PART | Aperio | UTSW |
| 3 | 100 | M | PART | Aperio | UTSW |
| 4 | 102 | F | PART | Aperio | UTSW |
| 5 | 97 | F | PART | Aperio | UTSW |
| 6 | 98 | M | PART | Aperio | UTSW |
| 7 | 67 | F | PART | Aperio | UTSW |
| 8 | 85 | F | PART | Aperio | UTSW |
| 9 | 73 | M | CTE | Philips | BU/VA |
| 10 | 73 | M | CTE | Philips | BU/VA |
| 11 | 84 | M | CTE | Philips | BU/VA |
| 12 | 84 | M | CTE | Philips | BU/VA |
| 13 | 84 | M | CTE | Philips | BU/VA |
| 14 | 80 | M | PSP | Philips | ISMMS |
| Testing set | |||||
| 1 | 91 | F | PART | Aperio | UTSW |
| 2 | 87 | M | AD | Aperio | UTSW |
| 3 | 102 | F | PART | Aperio | UTSW |
| 4 | 84 | M | CTE | Philips | BU/VA |
| 5 | 73 | M | CTE | Philips | BU/VA |
| 6 | 80 | F | PSP | Philips | ISMMS |
| 7 | 87 | F | PSP | Philips | ISMMS |
| 8 | 80 | F | PSP | Philips | ISMMS |
UTSW University of Texas Southwestern; ISMMS Icahn School of Medicine at Mount Sinai; BU Boston University; PART primary age-related tauopathy; CTE chronic traumatic encephalopathy; AD Alzheimer diseases; PSP progressive supranuclear palsy
Immunohistochemistry
We used standard histological coronal sections from formalin-fixed paraffin-embedded (FFPE) postmortem brain tissue, representing hippocampal formation and dorsolateral prefrontal cortex. For PART and AD cases, the immunohistochemistry (IHC) of all cases was performed at the University of Texas Southwestern (UTSW) using anti-phosphorylated tau antibodies (AT8, Invitrogen, Waltham, MA) at 1:200 dilution using a Leica Bond III automated immunostainer (Leica Microsystems, Buffalo Grove, IL). PSP and CTE cases were immunostained at the Neuropathology Research Core at Mount Sinai with anti-phosphorylated tau antibodies (AT8, Invitrogen) at 1:2000 dilution using a Ventana autostainer (Roche Diagnostics, Rotkreuz, Switzerland).
Slide digitization
All sections were digitized to obtain digital WSI. For PSP and CTE, WSI were acquired using the Ultra Fast Scanner Digital Pathology Slide Scanner (Philips, Amsterdam, Netherlands), which scans histological samples mounted on standard glass slides at x40 magnification (0.25 μm/pixel) and saves them in the proprietary iSyntax format. For PART and AD cases, all slides were scanned using an Aperio CS image scanner (Leica Microsystems) at x20 magnification (0.50 μm/pixel) and saved in .svs format. All images in proprietary formats were then converted into a GeoTIFF and stored on the server behind the hospital firewall for interactive display over the intranet.
Pathological annotations
WSI were uploaded to the Precise Informatics Platform (PIP) developed by the Center for Computational and Systems Pathology at Mount Sinai (MP, JK, JZ, and GF), which allows for the management of thousands of images with pathologist annotations. Authors previously have applied machine learning to prostate cancer for Gleason grading [23, 25], and it is currently being used in our CLIA-approved laboratory. In addition, PIP enables graphics processing unit (GPU)-accelerated DL for rapid validation and visualization of how DL classifiers perform in different scenarios (brain regions, cell types, and staining). Annotations were generated using the PIP collaborative web-based user interface for outlining (Fig. 3). An NFT was operationalized as an object, i.e. “foreground”, with cytoplasmic fine granular, coarse granular, or fibrillary/condensed AT8 immunopositivity morphologically consistent with a neuron based on the histological context. In addition, extracellular AT8-positive structures morphologically consistent with the neuronal somatodendritic compartment were counted as ghost tangles. Partial neurites lacking connection to the soma or hillock were excluded. Other AT8-positive structures including neuropil threads, neuropil granules/grains, and ambiguous non-neuronal phospho-tau staining were categorized as “background”. The total number of 22 WSI was divided into 14 for training and validation (model selection), with 8 reserved as a test set for performance evaluation.
Fig. 3.
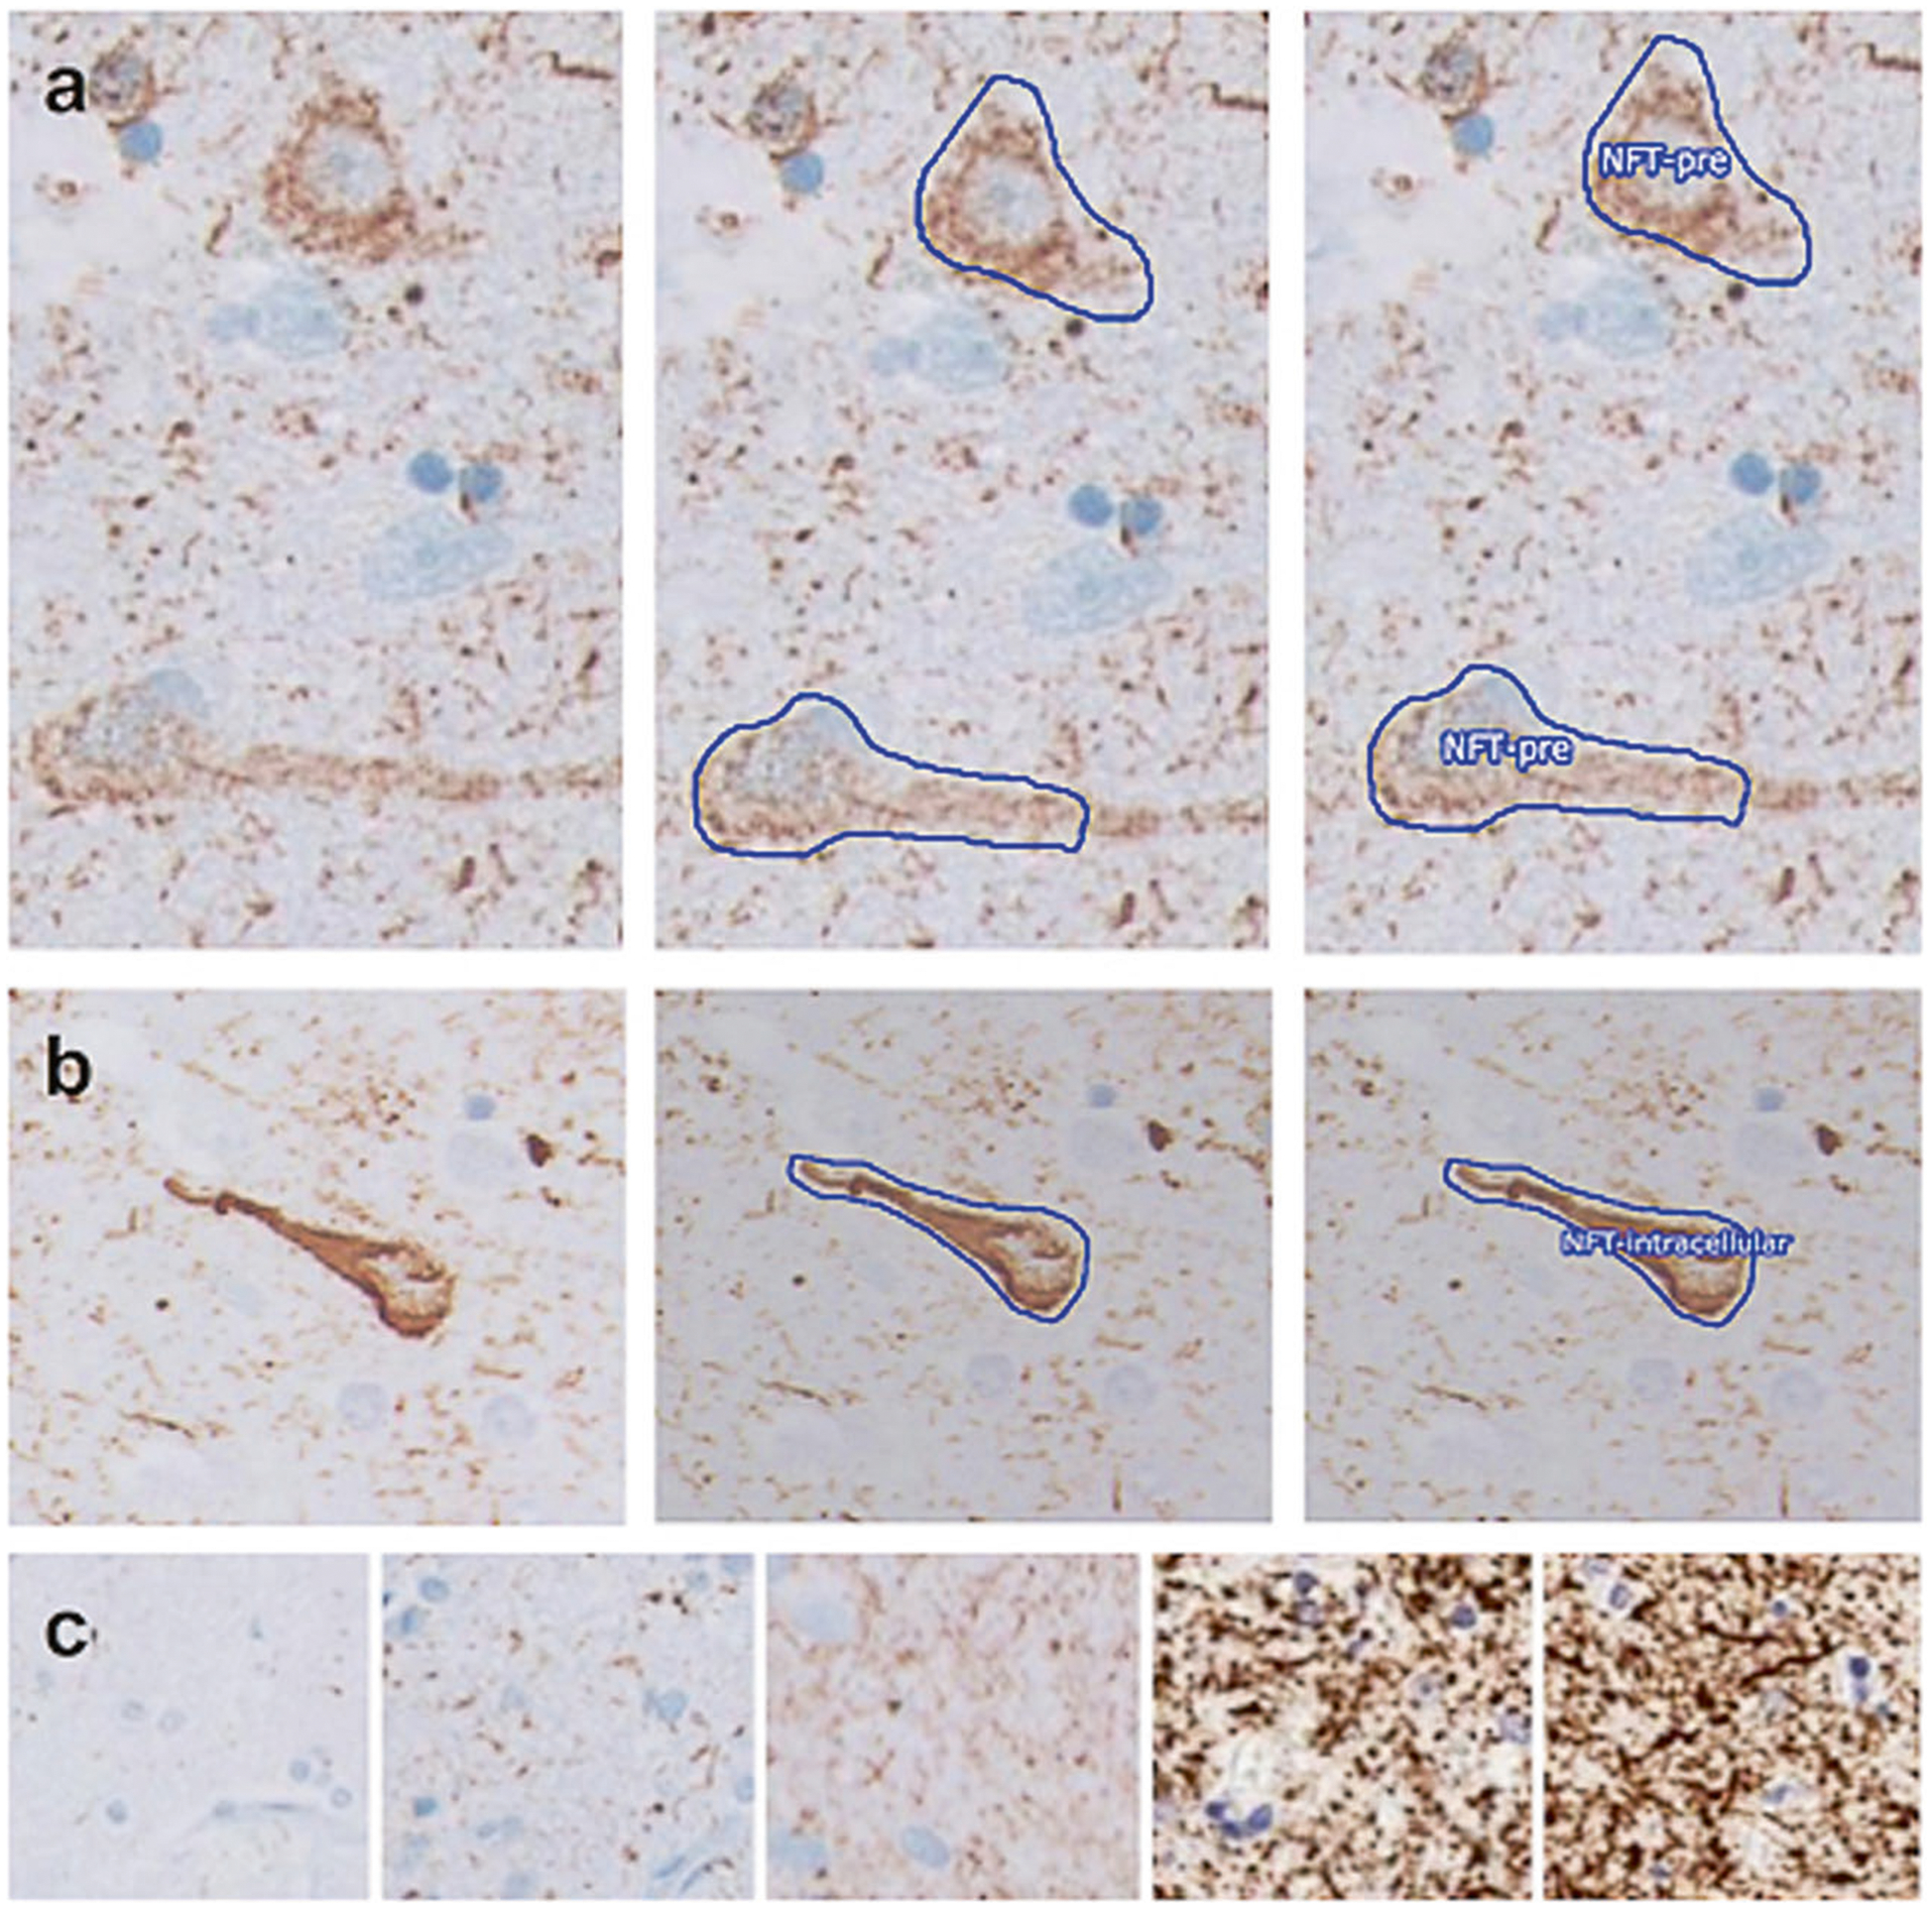
Expert annotation of whole slide images for ground truth ascertainment. a, b Examples of the stepwise process of annotation and assignment of a classifier for a pre-tangle and a mature NFT, respectively. Panels on the left show a naive image, middle panels show the manual outlining performed by an expert, and right panels show the assignment of classifiers. c Sections displayed a spectrum of background intensity
We conducted a concordance study to assess the inter-rater reliability using a custom interface within the PIP platform. A total of 471 unique patches of mixed human expert-annotated ground truth NFTs and AI-detected false positives were independently assessed by three neuropathologists (MS, JFC, or CB) and compared using a Fleiss’ kappa statistic.
Fully convolutional network (FCN) training and model selection
The training dataset consisted of WSI of sections from 14 subjects (Table 1). In total, 178 representative rectangular regions of interests (ROI) were selected by the investigators for analysis. The criteria for ROI were as follows: (1) a representative cortical area with an adequate IHC of diagnostic quality, (2) a representative variety of recognizable distinct histological AT8-stained elements, and (3) intact tissue without detachment or large tissue folds. All NFT forms were computed together. The total number of AT8-positive NFTs of various morphologies ranging from pre-tangles to mature NFTs and ghost tangles used for fully convolutional neural network training and model selection was 2221. We further extracted image patches of size 512 × 512 pixels at x20 by partitioning the ROIs. The total number of patches was 3177, comprising 2414 from Aperio scanned PART and AD WSIs, as well as 763 from Philips scanned CTE and PSP WSIs (Fig. 4). We further assigned 200 patches from this dataset to the validation set (for model selection), with the remainder used for training a neural network classifier.
Fig. 4.
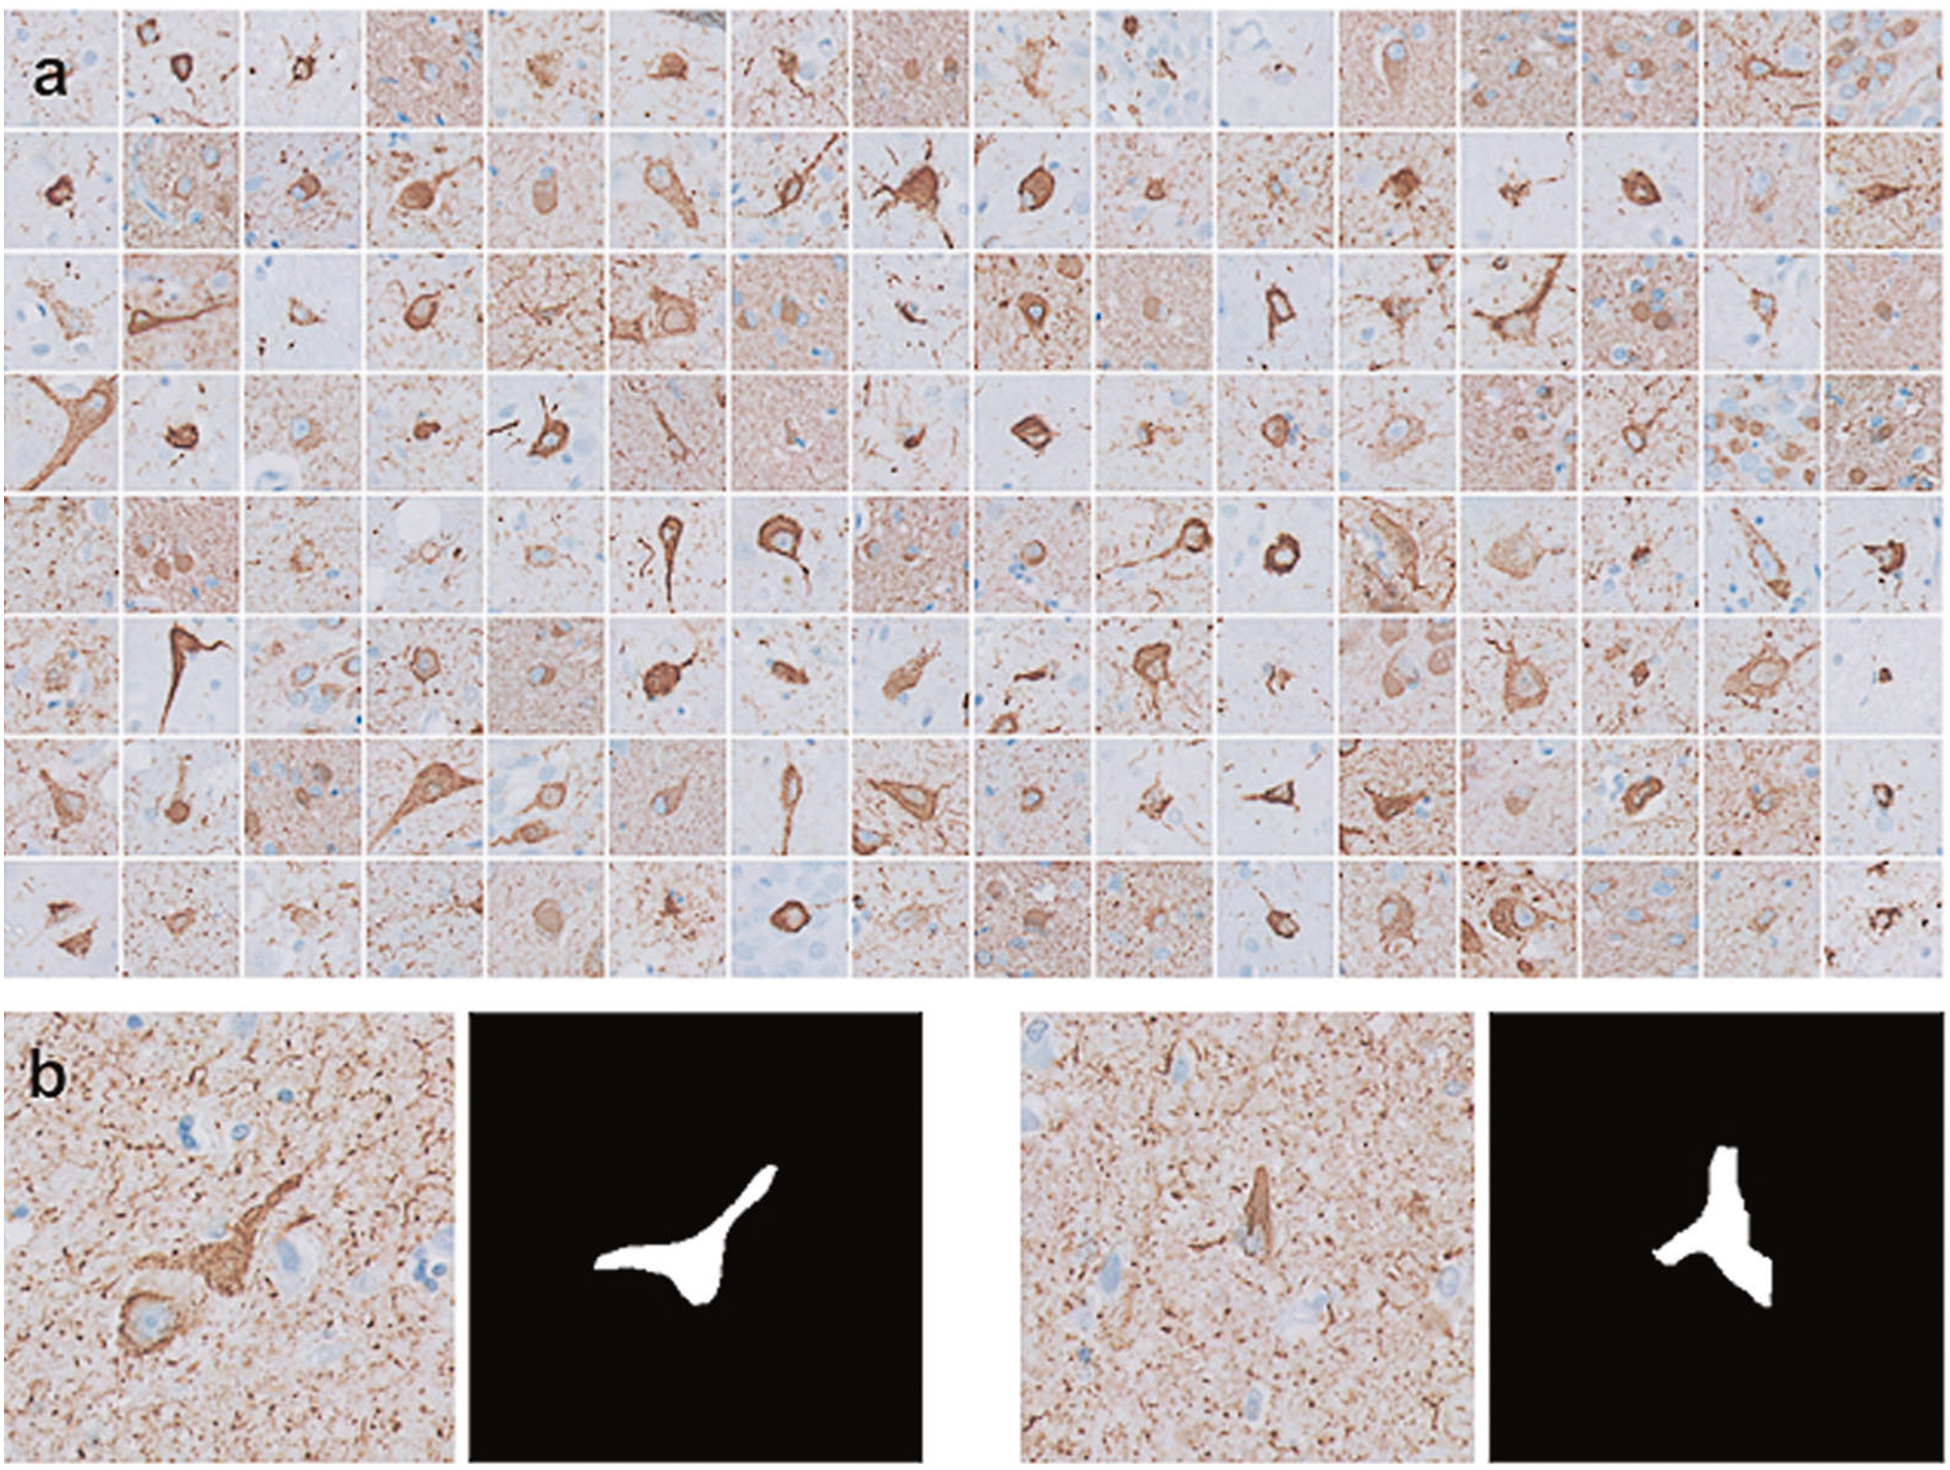
Machine learning training dataset. a Examples of the annotated diagnostically important elements of NFT on sections immunohistochemically stained with anti-phospho-tau antisera (AT8), extracted from the whole slide images. b Examples of image patches
For deep convolutional neural network generation, we used a modified version of the fully convolutional SegNet architecture (Fig. 5) [26]. We used three spatial scales (number of blocks containing multiple convolution layers followed by a pooling layer) in the network to model the visual context for NFT. Weight parameters for the neural network are the minima for the pixel-wise binary cross entropy loss. Specifically, given a set of training example images I with associated ground truth labels y, the FCN with weights w generates pixel probability at each location x for NFT objects as pj(x) = FCN(Ij(x), w), yielding the following loss function:
This differentiable loss function is minimized using stochastic gradient descent, which performs gradient updates on small batches of images. A set of gradient update iterations that utilize the complete set of training images, comprising multiple small batches, is called an epoch. Each update iteration can be computed efficiently in parallel using commodity GPU hardware. We used the PyTorch software package (http://www.pytorch.org) for building our neural network model [27].
Fig. 5.
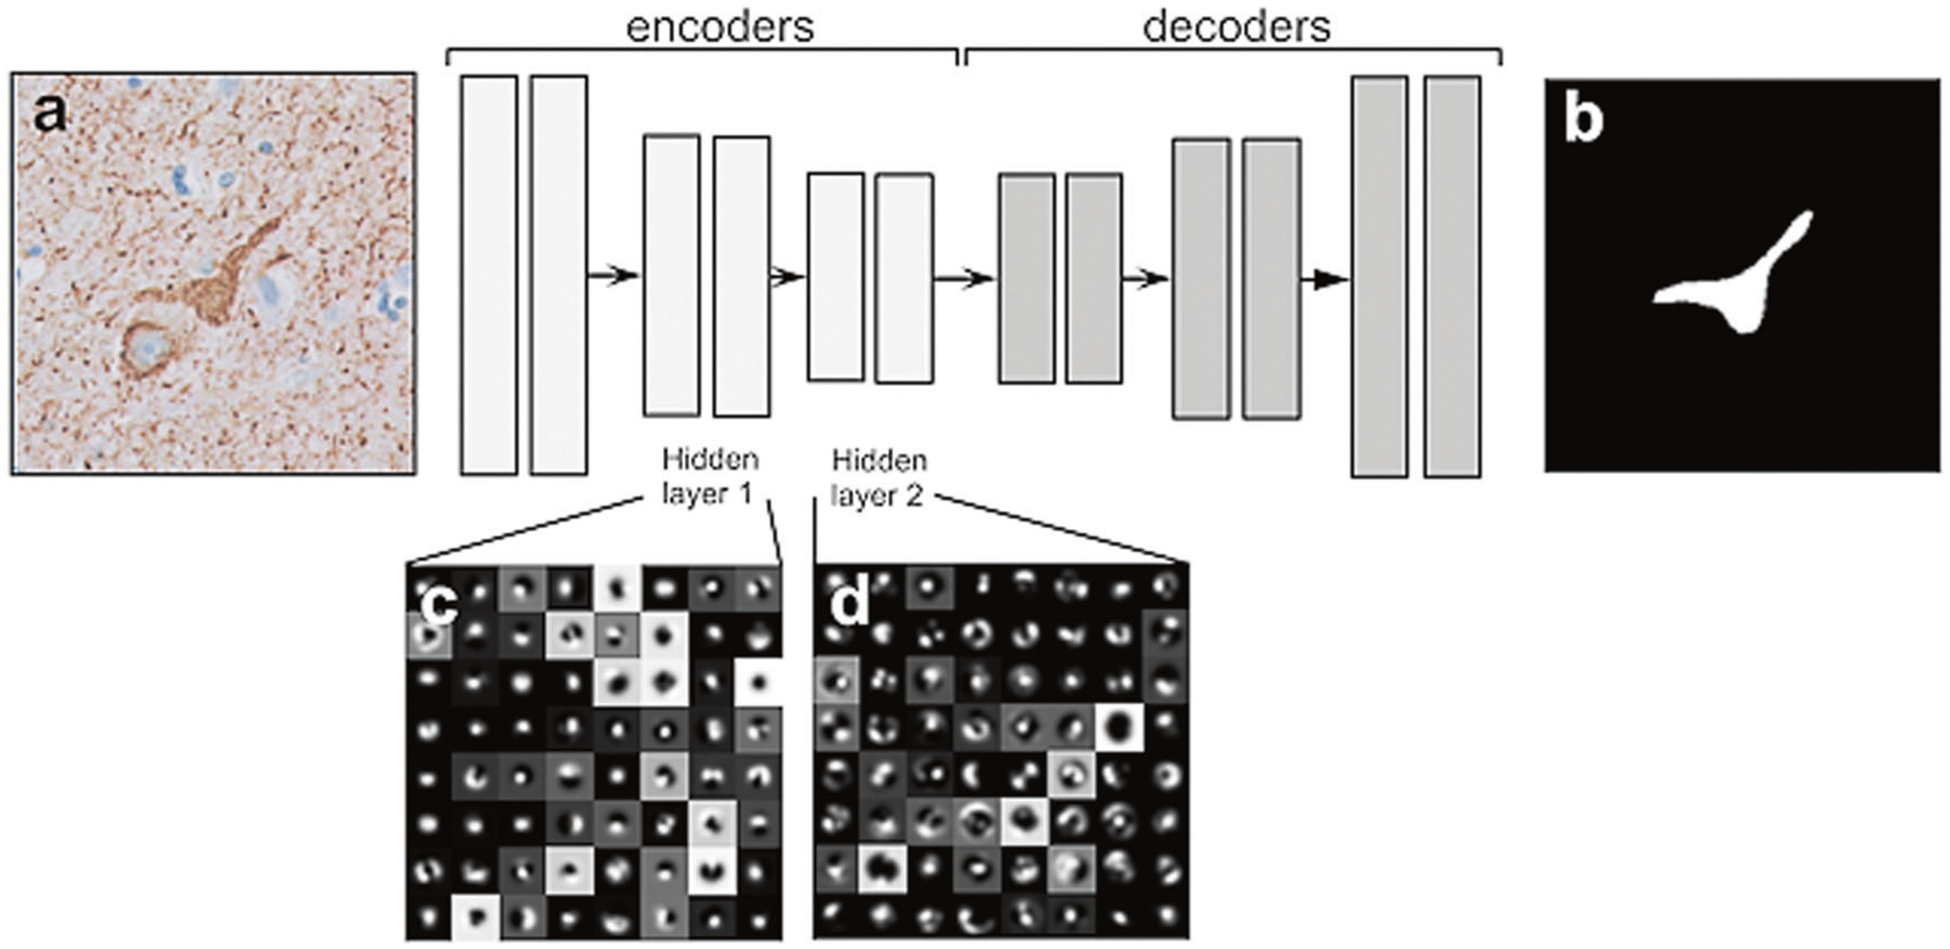
SegNet architecture for NFT detection. The network architecture consists of three encoding and three decoding layers. The network is fully convolutional and utilizes neighborhood visual context to generate pixel-wise segmentation of NFT objects using a softmax classifier at the final layer. We show the visualization of the network features for the first two encoding blocks to provide a conceptual view of how the network utilizes more complex features in deeper layers for pixel classification. a An example input image; b Segmentation image after FCN; c, d Features extracted from FCN-hidden layer blocks 1 and 2, respectively. FCN fully convolutional network
FCN testing
We applied the trained SegNet to a set of eight naive WSIs, capturing a range of scanner and staining variabilities. For these, we used one WSI for AD, two for PART, three for PSP, and two for CTE (Table 1). The total number of fully annotated rectangular ROI on eight naive slides representing various nosologies was 50. The total number of AT8 positive structures among the various morphologies was 618. Positive features were used to interrogate network performance.
Results
First, we computed the optimal weight parameters for NFT detection in 200 epochs. Network weights were updated to reduce training loss, and, at each update, we computed the loss on validation data, which is separate from training data, to ensure that performance between the two does not diverge. In cases where training loss is reduced and validation loss is increased, the estimated network weights will result in a model overfitted to the training set. It will perform well on training data but will have suboptimal performance on novel data. We performed data augmentation at each epoch on a random subset of training samples, which includes contrast shift and geometric changes (flips and rotations). This augmentation step provides a richer example for our network and reduces the likelihood of overfitting. The training process for a deep neural network for detecting NFT by optimization of the cross-entropy loss function is shown (Fig. 6). Optimization was performed using stochastic gradient descent on the training data; selecting the model that minimizes the separate validation data ensures that the network model can be generalized and applied to unseen WSI. These results indicate that our network weights are optimal and are not overfitted to the training data.
Fig. 6.
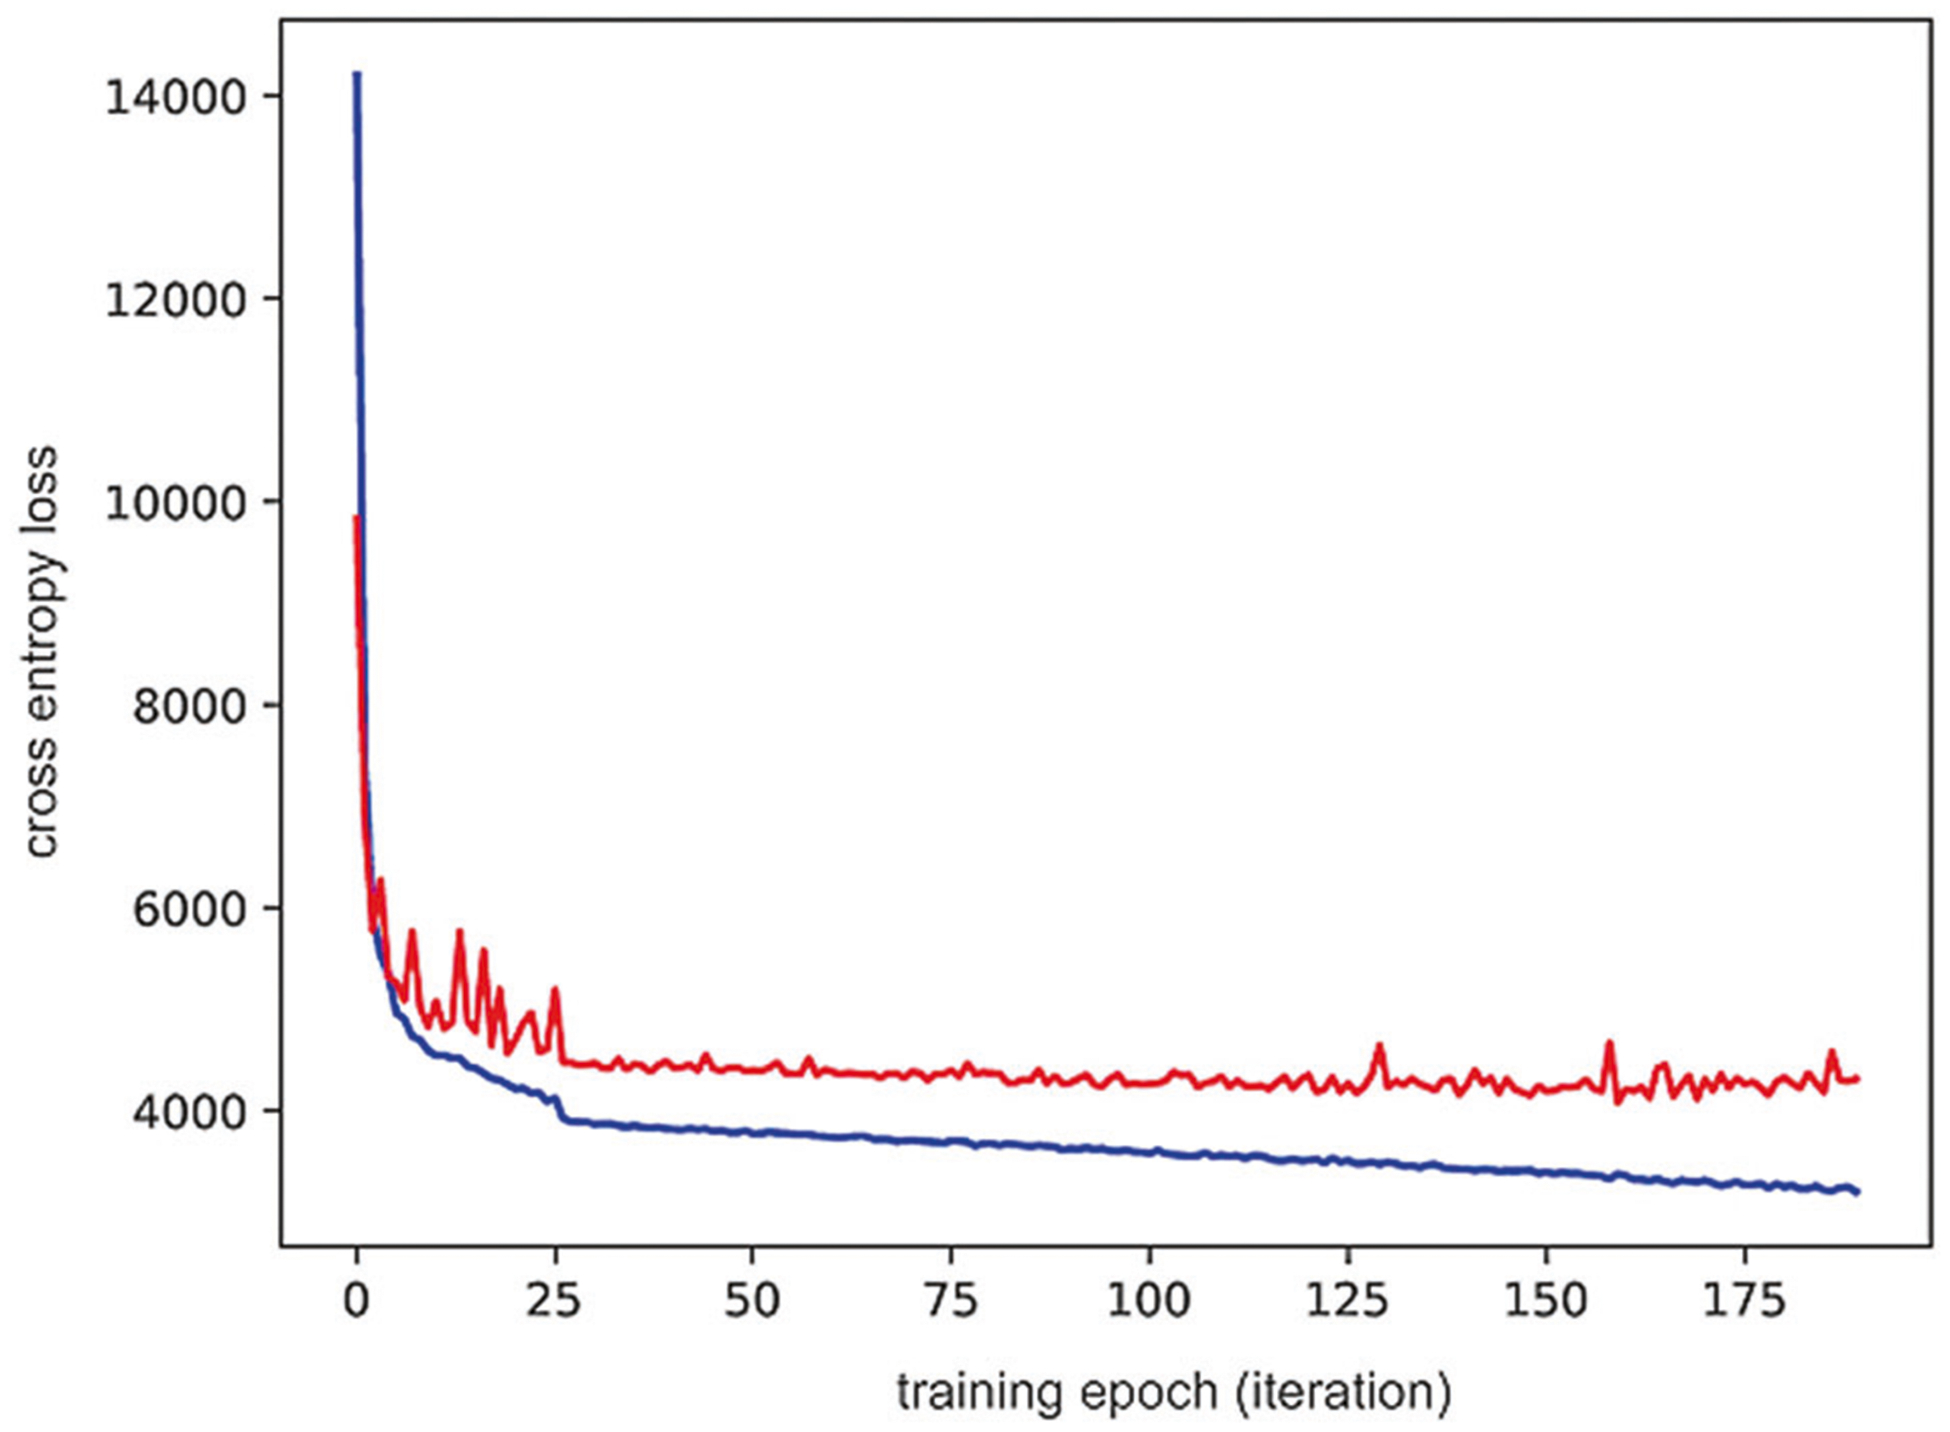
Deep neural network optimization. The model construction was optimized for training loss by selecting the model with the lowest validation loss. The plot shows cross entropy loss at each optimization epoch for training data (blue) and validation data (red). The loss was minimized for the training data and selected the network model as the one that minimizes loss for the validation data
The network achieves high sensitivity for both validation and test data, with a lower precision on the test set compared to the validation set as our current network generates more false positives in the naive test WSIs (Figs. 7, 8). On validation, we have achieved recall, precision, and F1 score of 0.91, 0.80, and 0.86, respectively. On testing, we achieved overall recall, precision, and F1 score of 0.92, 0.72, and 0.81, respectively. The overall FCN performance was higher in the high-tau-burden AD/PART cohort compared to the low-to-moderate tau burden PSP/CTE cohort. The FCN was trained using data where AD/PART is higher in proportion (Table 2). The Fleiss’ kappa for inter-rater reliability between neuropathologists determined on a collection of patches consisting of a mix of network-defined false positives and true positives was 0.78 (p-value < 0.0001) (Table 3).
Fig. 7.
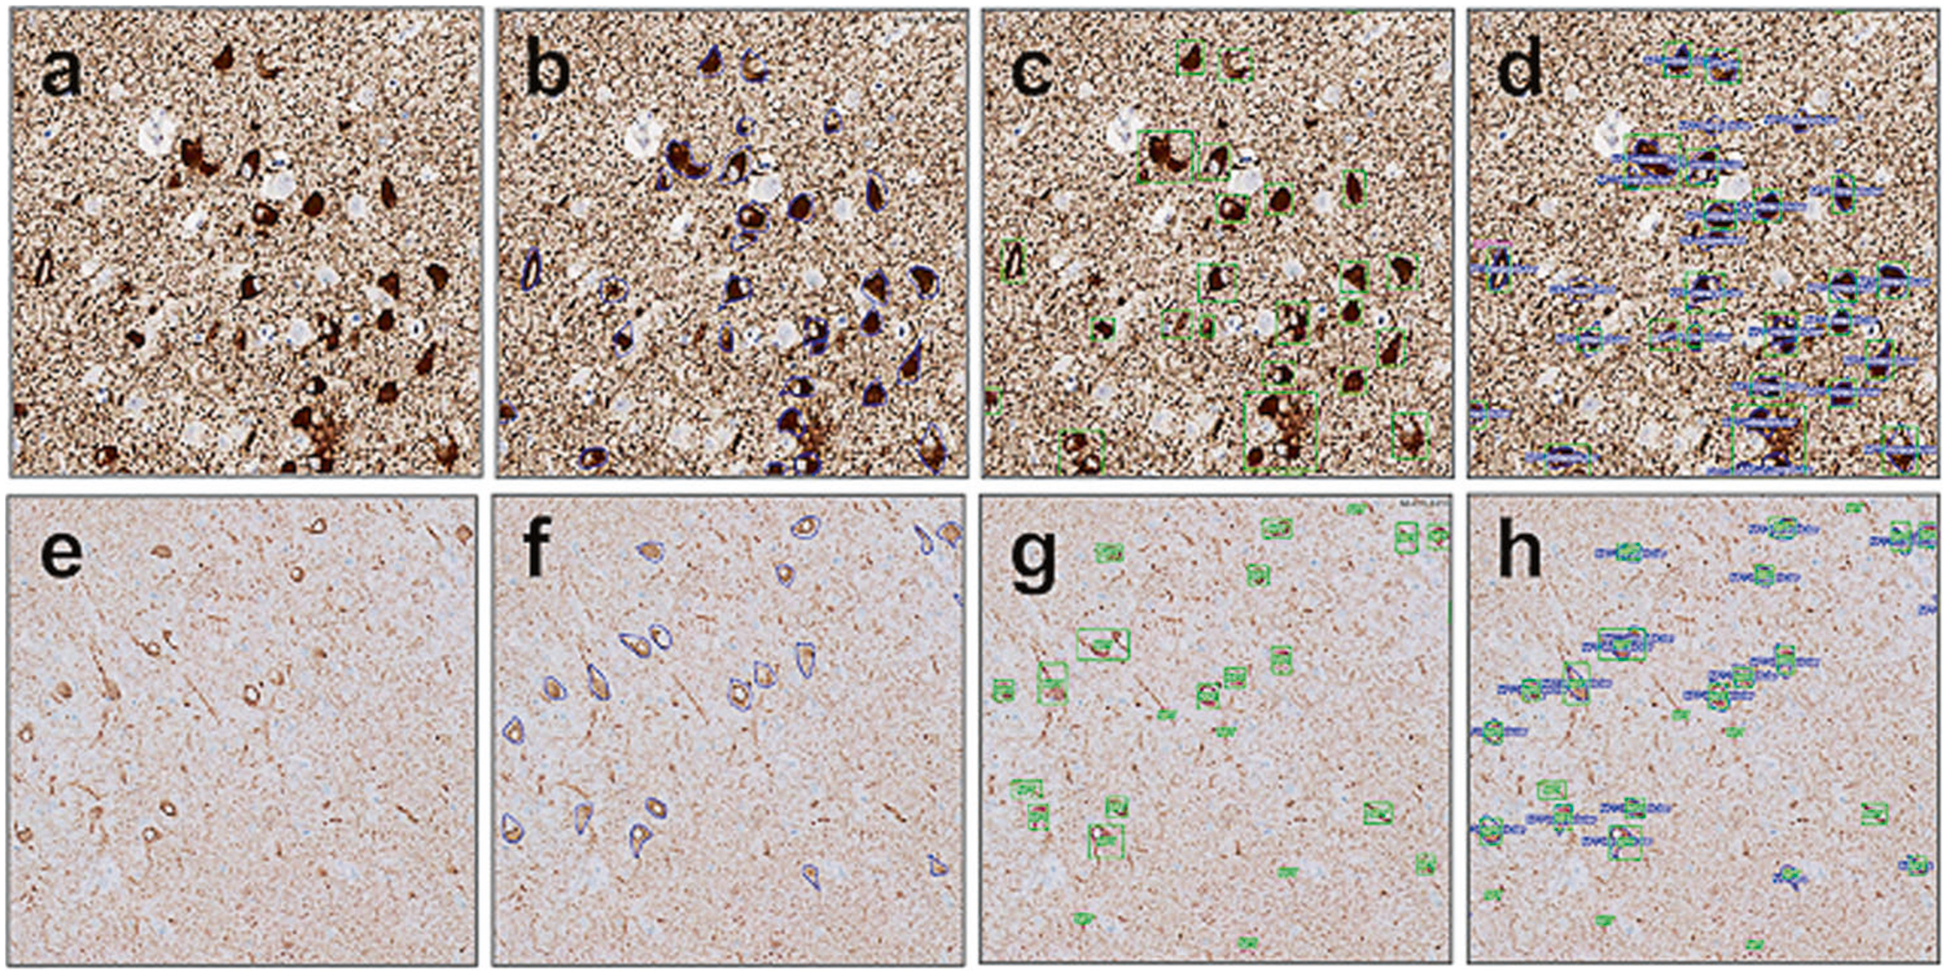
FCN performance in WSI compared to expert annotated ground truth. High (a–d) and low (e–h) background sections showed similar results. a, e Naive digitized slide, AT8 IHC. b, f Expert annotated ground truth. c, g FCN detection of NFTs. d, h Overlapping image of the expert call annotations and FCN performance. The concordance of calls is used to assess true positives (TP) calls, false positives (FP), and false negatives (FN) for further calculation of FCN performance metrics
Fig. 8.

False positives and false negatives examples of FCN calling (green—FCN, blue or magenta—expert annotation). a FCN recognizes two NFTs as one (one TP and one FN), at the same panel FCN labels indeterminate p-tau accumulation is NFT (FP). b FCN recognizes two NFTs as one (one TP and one FN). c panel FCN labels one indeterminate p-tau accumulation is NFT (FP) as well as correctly recognizes one TP
Table 2.
Performance of the fully convolutional neural network for NFT detection
| Training/Validation | Testing | ||||
|---|---|---|---|---|---|
| Metrics | Total | Total | PART | CTE | PSP |
| Recall, TP/(TP + FN), sensitivity | 0.91 | 0.92 | 0.96 | 0.78 | 0.88 |
| Precision, TP/(TP + FP), PPV | 0.80 | 0.72 | 0.77 | 0.75 | 0.63 |
| F1 score (harmonic mean of precision and recall) | 0.85 | 0.81 | 0.85 | 0.77 | 0.73 |
F1 score harmonic mean is calculated as 2*Precision*Recall/(Precision + Recall); NFT neurofibrillary tangle; PART primary age-related tauopathy; CTE chronic traumatic encephalopathy; PSP progressive supranuclear palsy
Table 3.
Inter-rater reliability analysis
| Unique patches, NFT, and background | 471 |
| Raters | 3 |
| Fleiss’ kappa statistic | 0.78 |
| z score | 29.4 |
| p value | <0.0001 |
We trained and tested our FCN on various staining conditions. The true positive (TP), false positive (FP), and false negative (FN) values in high background WSI (Aperio scanned AD and PART cases from UTSW) were 329, 98, and 14, respectively. The TP, FP, and FN values in low background WSI (Philips scanned PSP and CTE cases from MSSM) were 244, 122, and 45, respectively. Overall FCN performance represented with an F1 score was higher in the high-background high-tau-burden AD/PART cohort (0.85) compared to the low-background and low-to-moderate tau-burden PSP/CTE cohort (0.75) (Table 4).
Table 4.
Network performance on various staining and scanning conditions
| Background | ||
|---|---|---|
| Metrics | High (Aperio) | Low (Philips) |
| True positives (TP) | 329 | 244 |
| False positives (FP) | 98 | 122 |
| False negatives (FN) | 14 | 45 |
| Precision | 0.77 | 0.67 |
| Recall | 0.96 | 0.85 |
| F1 score | 0.85 | 0.75 |
The FCN was validated in various staining conditions and in various backgrounds intensity. The TP, FP, and FN values in high background WSI (Aperio scanned AD and PART cases from UTSW) were 329, 98, and 14, respectively. The TP, FP, and FN values in low background WSI (Philips scanned PSP and CTE cases from MSSM) were 244, 122, and 45, respectively. Overall FCN performance exemplified with an F1 score was higher in the high-background high-tau-burden AD/PART cohort (0.85) versus in the low-background and low-to-moderate tau-burden PSP/CTE cohort (0.75). An F1 score harmonic mean is calculated as 2*Precision*Recall/(Precision + Recall)
The object detection time for a single whole slide image ranged from 10 min to 2 h (averaging 45 min) using one NVIDIA Titan Xp GPU, with performance depending on the digital scan resolution and magnification. Fully automatic detection of NFTs at this performance level will enable large-scale analysis of WSI.
Discussion
In this study, we present a novel machine learning-based method using automated qualitative and quantitative assessment of NFT on IHC-stained preparations. The value of a reproducible, rapid, and unbiased approach to augment labor-intensive manual counting of histopathological features is well recognized. Implementation of DL is a compelling computational tool that can address this gap. DL enables the rapid development of new algorithms and tools but requires the creation of computational infrastructure and large neuropathological datasets containing richly varied high-quality annotations. This is greatly facilitated by a collaborative annotation platform that utilizes powerful GPU hardware and rapid feedback from computational algorithms. We have achieved a significant milestone by developing a web-based platform for data management, visual exploration, object outlining, multi-user review, and evaluation of DL algorithm results in WSI. Our NFT classifier currently takes an average of 45 min to 1h to computationally identify and count NFT on an entire WSI, illustrating the feasibility of applying this approach to large datasets. To our knowledge, this is among the first frameworks available for building and evaluating DL algorithms using large-scale image data in neuropathology.
Our long-term goal is to develop a comprehensive platform that can be utilized across contexts (e.g., basic research laboratories, brain banks, and clinical neuropathology laboratories) with variability in sampling protocols, tissue section quality, staining methodology, and pathological features. Hence, in our current study, several steps were taken to increase the adaptability of the neural network. We used multiple brain regions, a spectrum of different tau-related diseases, a variety of staining conditions, and images acquired on two different slide-scanning platforms. These steps have laid the groundwork to provide a highly adaptable and robust tangle classifier for use on immunohistochemically stained sections that can be readily integrated into existing clinical neuropathology and research.
DL algorithms are based on concepts developed in the 1940s and have started being used in medical imaging only recently. Use of these algorithms are becoming practical due to the development of GPU hardware and they have been successfully applied to solve various image classification, detection, and segmentation tasks [17, 20]. Several groups are applying similar AI technologies to histopathology and have compared them to human experts. For example, in dermatology and ophthalmology, DL algorithms were able to outperform a human expert [28, 29]. The recent BreAst Cancer Histology images Grand Challenge demonstrated that AI is able to push forward the state-of-the-art accuracy (87%) [22]. Another study by Esteva et al. utilized a pre-trained GoogleNet Inception v3 CNN with ~1.28 million publicly available images of skin cancer [28]. The challenge, however, lies in the acquisition of a sufficient number of relevant ground truth expert annotations. Further, even when a body of data is annotated by domain experts, label noise from intra- and inter-observer variability calling presents a significant limiting factor in developing the algorithms, and therefore a rigorous quality control and expert consensus are needed for training sets. Thus, published studies demonstrate the promise of AI in aiding an expert in making more efficient diagnoses.
Our SegNet fully convolutional neural network has reached practically useful levels of performance but could be improved. Given that we focused on NFT, performance will be enhanced with larger and more varied annotated training data that capture a wider range of neuropathologies (e.g., amyloid plaques, Lewy bodies, cerebrovascular disease, etc.), staining parameters, and anatomical regions/sub-regions. The limitations are mainly attributed to false positives, many of which represent tau accumulation in glial cells (data not shown). We also observed better network performance in Aperio-scanned slides (AD and PART cases), possibly due to the larger amount of annotation data compared to Philips-scanned slides (CTE and PSP cases). While the network performance is more robust in nosologies that contributed more annotations to the training dataset, this can be overcome by increasing the total number of ground truth annotations and saturating the learning curve.
In future disease-specific studies, we plan to use expanded neuroanatomical sampling pertinent to targeted disease entities. For example, it may be helpful to differentiate NFT from different brain regions or different segments of one region, e.g. NFTs of hippocampus proper pyramidal neurons and of dentate gyrus granule neurons. Also, we combined all NFTs into a single category; however, the differentiation of pre-NFT, intracellular NFT, and ghost NFT may help improve the performance and provide more granular data. Finally, we focused our study on IHC stains, but abnormal tau and other pathologies are demonstrable using other methods, including silver and routine hematoxylin and eosin-stained sections. Networks built using other staining modalities will likely lead to classifiers with superior or useful complementary performance metrics.
Some additional computational issues remain to be addressed. In machine learning, computational models consist of numerous layers, which represent the multitude of the subordinates of the ground truth (i.e., the classification of interest from the training dataset with multiple levels of abstraction to finally yield a supercategory). Visual object recognition and object detection are amplified [19, 20], but in narrow binary tasks of classification or segmentation (normal versus abnormal, object versus background) classes are heterogeneous. This creates a class imbalance, a well-recognized challenge.
To our knowledge, this is one of the earliest frameworks available for building and evaluating DL algorithms using large-scale image data in neuropathology. Our study demonstrates that deep machine learning represents a feasible way to augment routine histological examination and complement the semi-quantitative and descriptively qualitative approaches commonly deployed. This will provide robust and reproducible data for clinicopathological correlations, thus boosting our knowledge and understanding of the pathogenesis of AD and other tauopathies. In conclusion, quantitative data uncovered by AI networks will not only augment the currently used qualitative and semi-quantitative approaches in the assessment of the pathognomonic features, but also will be used for correlative and association analyses with clinical, radiological, genetic, and biochemical data.
Acknowledgments
The authors would like to acknowledge NIH grants R01AG054008 (JFC), R01NS095252 (JFC), R01AG062348 (ACM/JFC), RF1AG060961 (JFC), F32AG056098 (KF), Department of Defense W81XWH-13-MRPRA-CSRA, the Tau Consortium (Rainwater Charitable Trust), and the Alzheimer’s Association (NIRG-15-363188). The first author was also supported by a Career Development Award funded by NIH-NOA 3P50AG005138 (MS). We thank Jill Gregory for the illustration. The authors also would like to thank Ping Shang, HT, Jeff Harris, HTL, and Chan Foong, MS, for technical assistance, and Javed and Shahnaz Iqbal Family Trust for the generous donation.
Footnotes
Conflict of interest The authors declare that they have no conflict of interest.
Publisher’s note: Springer Nature remains neutral with regard to jurisdictional claims in published maps and institutional affiliations.
References
- 1.Hoglinger GU, Respondek G and Kovacs GG. New classification of tauopathies. Rev Neurol (Paris) 2018. 10.1016/j.neurol.2018.07.001. [DOI] [PubMed] [Google Scholar]
- 2.Lebouvier T, Pasquier F, Buee L. Update on tauopathies. Curr Opin Neurol. 2017;30:589–98. [DOI] [PubMed] [Google Scholar]
- 3.Morris M, Maeda S, Vossel K, Mucke L. The many faces of tau. Neuron. 2011;70:410–26. [DOI] [PMC free article] [PubMed] [Google Scholar]
- 4.Höglinger GU, Melhem NM, Dickson DW, et al. Identification of common variants influencing risk of the tauopathy progressive supranuclear palsy. Nat Genet. 2011;43:699–705. [DOI] [PMC free article] [PubMed] [Google Scholar]
- 5.Bennett DA, Schneider JA, Buchman AS, Barnes LL, et al. Overview and findings from the rush memory and aging project. Curr Alzheimer Res. 2012;9:646–63. [DOI] [PMC free article] [PubMed] [Google Scholar]
- 6.Ghetti B, Oblak AL, Boeve BF, et al. Invited review: Frontotemporal dementia caused by microtubule-associated protein tau gene (MAPT) mutations: a chameleon for neuropathology and neuroimaging. Neuropathol Appl Neurobiol. 2015;41:24–46. [DOI] [PMC free article] [PubMed] [Google Scholar]
- 7.Cox PA, Davis DA, Mash DC, et al. Dietary exposure to an environmental toxin triggers neurofibrillary tangles and amyloid deposits in the brain. Proc R Soc B. 2016;283:20152397. [DOI] [PMC free article] [PubMed] [Google Scholar]
- 8.McKee AC, Cairns NJ, Dickson DW, et al. The first NINDS NIBIB consensus meeting to define neuropathological criteria for the diagnosis of chronic traumatic encephalopathy. Acta Neuropathol. 2016;131:75–86. [DOI] [PMC free article] [PubMed] [Google Scholar]
- 9.Ferrer I, Lopez-Gonzalez I, Carmona M, et al. Glial and neuronal tau pathology in tauopathies: characterization of disease-specific phenotypes and tau pathology progression. J Neuropathol Exp Neurol. 2013;73:81–97. [DOI] [PubMed] [Google Scholar]
- 10.Kahlson MA, Colodner KJ. Glial tau pathology in tauopathies: functional consequences. J Exp Neurosci. 2015;9(Suppl 2):43–50. [DOI] [PMC free article] [PubMed] [Google Scholar]
- 11.Kovacs GG. Tauopathies (Kovacs GG, Alafuzoff I, eds) Vol. 145, 355–68, Handb Clin Neurol, Elsevier, 2017. [DOI] [PubMed] [Google Scholar]
- 12.Murray ME, Kouri N, Lin W-L, et al. Clinicopathologic assessment and imaging of tauopathies in neurodegenerative dementias. Alzheimer’s Res Ther. 2014;6:1. [DOI] [PMC free article] [PubMed] [Google Scholar]
- 13.Braak H, Braak E. Neuropathological staging of Alzheimer-related changes. Acta Neuropathol. 1991;82:239–59. [DOI] [PubMed] [Google Scholar]
- 14.Jellinger KA. Different patterns of hippocampal tau pathology in Alzheimer’s disease and PART. Acta Neuropathol. 2018. 10.1007/s00401-018-1894-z. [DOI] [PubMed] [Google Scholar]
- 15.Salloway S, Sperling R. Understanding conflicting neuropathological findings in patients clinically diagnosed as having Alzheimer dementia. JAMA Neurol. 2015;72:1106–8. [DOI] [PubMed] [Google Scholar]
- 16.Al-Janabi S, Huisman A, Van Diest PJ. Digital pathology: current status and future perspectives. Histopathology. 2012;61: 1–9. [DOI] [PubMed] [Google Scholar]
- 17.Litjens G, Kooi T, Bejnordi BE. et al. A survey on deep learning in medical image analysis. Med Image Anal. 2017;42:60–88. [DOI] [PubMed] [Google Scholar]
- 18.Stead WW. Clinical implications and challenges of artificial intelligence and deep learning. JAMA. 2018;320:1107–8. [DOI] [PubMed] [Google Scholar]
- 19.Hinton G Deep learning—a technology with the potential to transform health care. JAMA. 2018;320:1101–2. [DOI] [PubMed] [Google Scholar]
- 20.LeCun Y, Bengio Y, Hinton G. Deep learning. Nature. 2015;28: 436–44. [DOI] [PubMed] [Google Scholar]
- 21.Naylor CD. On the prospects for a (deep) learning health care system. JAMA. 2018;320:1099–1100. [DOI] [PubMed] [Google Scholar]
- 22.Aresta G, Araújo T, Kwok S, et al. BACH: Grand Challenge on Breast Cancer Histology Images. arXiv Prepr. 2018;arXiv: 1808.04277. [DOI] [PubMed] [Google Scholar]
- 23.Donovan MJ, Fernandez G, Scott R, et al. Development and validation of a novel automated Gleason grade and molecular profile that define a highly predictive prostate cancer progression algorithm-based test. Prostate Cancer Prostatic Dis. 2018. 10.1038/s41391-018-0067-4 [DOI] [PubMed] [Google Scholar]
- 24.Crary JF, Trojanowski TQ, Schneider JA, et al. Primary age-related tauopathy (PART): a common pathology associated with human aging. Acta Neuropathol. 2014;128:755–66. [DOI] [PMC free article] [PubMed] [Google Scholar]
- 25.Scott R, Khan FM, Zeineh J, Donovan M, Fernandez G. Gland ring morphometry for prostate cancer prognosis in multi-spectral immunofluorescence images. In: International Conference on Medical Image Computing and Computer-Assisted Intervention 2014 LNCS 8673 Cham: Springer; 2014. p. 585–92. [DOI] [PubMed] [Google Scholar]
- 26.Badrinarayanan V, Kendall A, Cipolla R. SegNet:a deep convolutional encoder-decoder architecture for image segmentation. IEEE Trans Pattern Anal Mach Intell. 2017;39: 2481–95. [DOI] [PubMed] [Google Scholar]
- 27.Paszke A, Gross S, Chintala S, Chanan G, et al. Automatic differentiation In: PyTorch 2017. Long Beach: NIPS-W; 2017. [Google Scholar]
- 28.Esteva A, Kuprel B, Novoa RA, et al. Dermatologist-level classification of skin cancer with deep neural networks. Nature. 2017;542:115–8. [DOI] [PMC free article] [PubMed] [Google Scholar]
- 29.Gulshan V, Peng L, Coram M, et al. Development and validation of a deep learning algorithm for detection of diabetic retinopathy in retinal fundus photographs. JAMA. 2016;316: 2402–10. [DOI] [PubMed] [Google Scholar]


