

This randomized clinical trial examines the use of clinical neurophysiological metrics of excitability as pharmacodynamic biomarkers in individuals with amyotrophic lateral sclerosis.
Key Points
Question
Can ezogabine reduce cortical and spinal motor neuron excitability, which are increased in amyotrophic lateral sclerosis (ALS)?
Findings
In this randomized clinical trial of 65 participants with ALS, treatment with ezogabine reduced both cortical and spinal motor neuron excitability in a dose-dependent manner.
Meaning
This trial found that ezogabine decreased excitability in ALS; further evaluation is warranted to determine whether longer treatment can sustain the effects on excitability and slow disease progression.
Abstract
Importance
Amyotrophic lateral sclerosis (ALS) is a progressive neurodegenerative disease of the motor nervous system. Clinical studies have demonstrated cortical and spinal motor neuron hyperexcitability using transcranial magnetic stimulation and threshold tracking nerve conduction studies, respectively, although metrics of excitability have not been used as pharmacodynamic biomarkers in multi-site clinical trials.
Objective
To ascertain whether ezogabine decreases cortical and spinal motor neuron excitability in ALS.
Design, Setting, and Participants
This double-blind, placebo-controlled phase 2 randomized clinical trial sought consent from eligible participants from November 3, 2015, to November 9, 2017, and was conducted at 12 US sites within the Northeast ALS Consortium. Participants were randomized in equal numbers to a higher or lower dose of ezogabine or to an identical matched placebo, and they completed in-person visits at screening, baseline, week 6, and week 8 for clinical assessment and neurophysiological measurements.
Interventions
Participants were randomized to receive 600 mg/d or 900 mg/d of ezogabine or a matched placebo for 10 weeks.
Main Outcomes and Measures
The primary outcome was change in short-interval intracortical inhibition (SICI; SICI−1 was used in analysis to reflect stronger inhibition from an increase in amplitude) from pretreatment mean at screening and baseline to the full-dose treatment mean at weeks 6 and 8. The secondary outcomes included levels of cortical motor neuron excitability (including resting motor threshold) measured by transcranial magnetic stimulation and spinal motor neuron excitability (including strength-duration time constant) measured by threshold tracking nerve conduction studies.
Results
A total of 65 participants were randomized to placebo (23), 600 mg/d of ezogabine (23), and 900 mg/d of ezogabine (19 participants); 45 were men (69.2%) and the mean (SD) age was 58.3 (8.8) years. The SICI−1 increased by 53% (mean ratio, 1.53; 95% CI, 1.12-2.09; P = .009) in the 900-mg/d ezogabine group vs placebo group. The SICI−1 did not change in the 600-mg/d ezogabine group vs placebo group (mean ratio, 1.15; 95% CI, 0.87-1.52; P = .31). The resting motor threshold increased in the 600-mg/d ezogabine group vs placebo group (mean ratio, 4.61; 95% CI, 0.21-9.01; P = .04) but not in the 900-mg/d ezogabine group vs placebo group (mean ratio, 1.95; 95% CI, −2.64 to 6.54; P = .40). Ezogabine caused a dose-dependent decrease in excitability by several other metrics, including strength-duration time constant in the 900-mg/d ezogabine group vs placebo group (mean ratio, 0.73; 95% CI, 0.60 to 0.87; P < .001).
Conclusions and Relevance
Ezogabine decreased cortical and spinal motor neuron excitability in participants with ALS, suggesting that such neurophysiological metrics may be used as pharmacodynamic biomarkers in multisite clinical trials.
Trial Registration
ClinicalTrials.gov Identifier: NCT02450552
Introduction
Amyotrophic lateral sclerosis (ALS) is a neurodegenerative disease characterized by the loss of cortical and spinal motor neurons (MNs) that has a typical survival of 3 to 5 years after diagnosis.1 Although approximately 10% of cases are familial and result from a mutation in 1 of more than 40 ALS genes, including SOD1 (NM_000454), TARDBP (NM_007375), and FUS (NM_001170634), and hexanucleotide intronic repeat expansion in the C9orf72 (NM_001256054) gene, most ALS cases worldwide are sporadic.1 In these sporadic cases, the genetic contribution to neural degeneration remains poorly understood.
Findings from clinical research support MN-increased excitability in ALS. Studies using transcranial magnetic stimulation (TMS) have established cortical MN hyperexcitability, heralded by decreased short-interval intracortical inhibition (SICI), as an early feature of sporadic and familial ALS.2,3,4 Separately, spinal MN axonal hyperexcitability, as indicated by increased strength-duration time constant (SDTC) measured using threshold tracking nerve conduction studies (TTNCSs),5 has also been found in patients with sporadic and familial ALS.6 Greater cortical and spinal MN excitability are prognostic of disease progression.7,8 Despite these findings, the feasibility of using these neurophysiological metrics as pharmacodynamic biomarkers has not been evaluated in a multi-site clinical trial.
Given the lack of a clear genetic cause for most patients with ALS, MNs derived from induced pluripotent stem cells (iPSCs) of patients with ALS offer promising approaches for identifying key disease drivers.9 In both human stem cell–derived and primary mouse spinal MNs, KCNQ2 (NM_001382235) to KCNQ3 (NM_001204824) potassium channels (Kv7.2-Kv7.3) played central roles in controlling MN excitability,10,11 and the KCNQ channel activator and US Food and Drug Administration–approved antiepileptic medicine ezogabine (also known as retigabine) reduced neuronal excitability,10 alleviated endoplasmic reticulum stress,12 and improved in vitro survival of both SOD1 and C9orf72 ALS human MNs.10,13 Based on the strong clinical evidence supporting hyperexcitability as a prominent phenotype in both familial and sporadic ALS as well as the absence of animal models for sporadic ALS, we moved directly from iPSC modeling to a clinical trial using neurophysiological metrics of MN excitability as pharmacodynamic biomarkers. With the goal of investigating whether ezogabine decreases cortical and spinal motor neuron excitability in ALS, we conducted a 10-week, multicenter phase 2 randomized clinical trial of 2 doses of ezogabine in patients with ALS, with the primary outcome of change in cortical excitability.
Methods
In this double-blind, placebo-controlled, phase 2 randomized clinical trial, participants with ALS received 10-week treatment with 600 mg/d or 900 mg/d of ezogabine or a matched placebo at 12 US sites that are members of the Northeast Amyotrophic Lateral Sclerosis Consortium; the full trial protocol and study design are provided in Supplement 1. Briefly, inclusion criteria were based on diagnosis of sporadic or familial ALS, slow vital capacity (SVC) of 50% or greater of estimated measure, ability to take medications by mouth per the study protocol, and sufficient amplitude of neurophysiological recordings to enable analyses. The institutional review board at the local sites reviewed and approved the study protocol, written informed consent forms, and amendments at the coordination center (Massachusetts General Hospital, Boston, Massachusetts) and all clinical trial sites (University of Michigan, Ann Arbor, Michigan; Penn State Hershey Medical Center, Hershey, Pennsylvania; University of California, Irvine, Irvine California; Mayo Clinic, Jacksonville, Florida; Hospital for Special Surgery, New York, New York; Johns Hopkins University, Baltimore, Maryland; Massachusetts General Hospital, Boston, Massachusetts; Augusta University Medical Center, Augusta, Georgia; Barrow Neurological Institute, Phoenix, Arizona; Beth Israel Deaconess Medical Center, Boston, Massachusetts; Cedars Sinai Medical Center, Los Angeles, California; and Duke University Medical Center, Durham, North Carolina). We followed the Consolidated Standards of Reporting Trials (CONSORT) reporting guideline.
Between November 3, 2015, and November 9, 2017, written informed consent was obtained from 108 individuals with ALS. Forty-three participants were deemed ineligible, of whom 24 were excluded because of our inability to elicit an motor evoked potential (MEP) using allowed magnet strength (Figure 1). Recruitment ended before full enrollment because of the expiration of the investigational product. Overall, 55 participants completed the trial.
Figure 1. CONSORT Diagram.

ALS indicates amyotrophic lateral sclerosis; NCS, nerve conduction study; RMT, resting motor threshold; SICI, short-interval intracortical inhibition; and TMS, transcranial magnetic stimulation.
Randomization, Masking, and Procedures
Study participants were randomized in equal numbers to receive 600 mg/d or 900 mg/d of ezogabine or to an identical matched placebo according to a computer-generated randomization schedule, which was constructed with stratification by site and permuted blocks of 3. All participants and study staff, including the data analysis teams, were blinded to the randomization until after database lock.
Participants completed in-person visits at screening, baseline, week 6, and week 8 for clinical assessment and neurophysiological measurements. Additional telephone visits were completed at weeks 2, 10, and 14. The first 21 participants were recruited using an early version of the protocol, which included additional visits at weeks 4 and 12. These additional visits were eliminated to decrease participant time commitment for the study.
Doses using identical active and placebo pills for escalation (weeks 1-4), full-dose treatment (weeks 5-8), and weaning (weeks 9-10) followed the timetable and dosing for phase 3 clinical trials of ezogabine in epilepsy14 (eMethods in Supplement 2). Measurements for the neurophysiological outcomes were taken during the full-dose treatment (mean of week 6 and week 8 measurements).
The eMethods in Supplement 2 include information on neurophysiological training and protocols.
Outcomes
The primary outcome of the study was change in SICI, which reflects inhibitory cortical motor circuit dynamics,15 from the pretreatment mean at the screening and baseline visits to the full-dose on-treatment mean at the weeks 6 and 8 visits. Two primary treatment comparisons between placebo and each of the low-dose (600 mg/d of ezogabine) and high-dose (900 mg/d of ezogabine) groups were tested. Neurophysiological secondary outcomes included levels of cortical and spinal MN excitability. Main cortical motor outcomes were measured by TMS16 and included resting motor threshold (RMT, a key secondary outcome), the minimum stimulus necessary for eliciting an MEP; MEP amplitude was measured at increasing stimulator strengths (eg, 120%, 140%, and 150% of RMT). Main spinal MN outcomes were measured by TTNCS17,18 and included SDTC, which reflects both active and passive membrane properties that determine axonal excitability; rheobase is the current threshold for motor response. The eMethods in Supplement 2 provide further description of neurophysiological definitions and outcomes.
Additional secondary outcomes included clinical measurements of disease progression, safety, and tolerability. Safety was assessed by the number of unique treatment-emergent adverse events (AEs) and serious AEs, as classified by the Medical Dictionary for Regulatory Activities system organ class and preferred term; the proportion of participants experiencing each type of AE or serious AE; and AEs of special interest for ezogabine, such as retinal or other tissue pigmentation, urinary retention, and drug-induced liver injury. Tolerability was defined as reaching the target dose and remaining on the study drug until planned discontinuation at the week 10 visit.
Sample Size
The planned sample size of 120 participants (40 per group) was based on ensuring at least 80% power to detect a 0.25-mV/mV difference in SICI between each active treatment and placebo. Lacking preliminary data on week 8 change in SICI among participants with ALS, we calculated the sample size by assuming an SD of 0.30 mV/mV, which was based on cross-sectional data from Stefan and colleagues,19 who reported an SD of 0.36 mV/mV, and from Caramia and colleagues,20 who reported an SD of 0.26 mV/mV. We calculated power by assuming a 2-sided α = .027 for 2 comparisons to placebo, based on Dunnett correction, and by allowing up to 25% loss to follow-up.
Statistical Analysis
Primary and secondary efficacy analyses used all available data that met blinded neurophysiological data quality review for all participants in the modified intention-to-treat population, including participants who discontinued the study drug but remained in the study. Outcomes that were strictly positive and right skewed (skewness greater than 3) were reported as medians in unadjusted summaries and were log-transformed before analysis. The metrics included the following: SICI−1, intracortical facilitation, MEP (120% of RMT), MEP (140% of RMT), MEP (150% of RMT), peak compound muscle action potential (CMAP), SDTC, and rheobase. Reported intervals were interquartile ranges and 95% CIs as indicated. To add clarity in interpreting SICI results, we analyzed SICI−1 so that stronger inhibition was reflected by an increase in amplitude. By log transformation, SICI−1 differs from SICI only in sign.
Transcranial magnetic stimulation, TTNCS, and clinical outcomes were analyzed in a shared-baseline linear mixed model (1) with fixed terms for visits and the interaction between treatment and postbaseline visits and (2) with random terms for participant-specific intercepts and slopes modeled with unstructured covariance. The model accounted for the association among repeated measurements of each participant over visits. The shared-baseline assumption reflected the study design and increased statistical efficiency by adjusting for any chance difference at baseline.21 Linear contrasts were used to estimate both within-group and between-group changes. The primary estimand for comparing the change from pretreatment mean to the week 6 and week 8 visits mean between each active treatment group vs placebo group was estimated using a linear contrast of the least-square means from the interaction between treatment and postbaseline visits.
We evaluated the estimates for the primary estimand comparing each active treatment group to placebo and their standard errors as a pair of Wald tests, declaring significance for 2-tailed P < .027 by the Dunnett correction to maintain an overall type I error rate of 5%. Secondary outcomes were evaluated at 2-tailed P < .05. Analyses were performed using SAS, version 9.4 (SAS Institute), from October 1, 2018 through August 29, 2020.
Results
A total of 108 individuals with ALS consented to participate (Figure 1), of whom 65 (60.2%) were randomized to placebo (23 participants), 600 mg/d of ezogabine (23 participants), and 900 mg/d of ezogabine (19 participants) (Figure 1). Of these participants, 45 were men (69.2%) and 20 were women (30.8%) with a mean (SD) age of 58.3 (8.8) years. Baseline demographic characteristics, disease properties, and neurophysiological measurements were generally well balanced across the 3 groups (Table 1).22,23,24 The placebo group had more female participants than the 600-mg/d ezogabine and 900-mg/d ezogabine groups (10 [43.5%] vs 4 [17.4%] and 6 [31.6%]), and more participants in the 2 ezogabine groups used riluzole than in the placebo group (19 [82.6%] and 18 [94.7%] vs 16 [69.6%]) (Table 1). The placebo group had a higher baseline SVC than the other 2 groups (85.5 [20.0%] vs 77.1 [19.4%] and 73.8 [17.2%]) (Table 1). Electrophysiological measurements varied widely but did not align in a pattern to suggest increased or decreased MN excitability in any group. Eighteen participants (16.7%) had unmeasurable RMT (greater than maximum stimulator output) at baseline, and 6 (5.6%) had elevated levels that precluded further TMS testing using our paradigm (RMT greater than 83% of maximum stimulator output).
Table 1. Demographics and Baseline Properties.
| Variable | Treatment group | ||
|---|---|---|---|
| Placebo (n = 23) | 600-mg/d Ezogabine (n = 23) | 900-mg/d Ezogabine (n = 19) | |
| Female sex, No. (%) | 10 (43.5) | 4 (17.4) | 6 (31.6) |
| Age, mean (SD), y | 57.4 (8.0) | 58.8 (9.5) | 58.9 (9.1) |
| Probable or definite ALS, No. (%) | 13 (56.5) | 12 (52.2) | 13 (68.4) |
| Bulbar onset, No. (%) | 2 (8.7) | 3 (13.0) | 2 (10.5) |
| Riluzole use, No. (%) | 16 (69.6) | 19 (82.6) | 18 (94.7) |
| No family history of ALS, No. (%) | 19 (86.4) | 20 (87.0) | 17 (89.5) |
| ALSFRS-R score, mean (SD) | 38.7 (5.2) | 35.6 (6.0) | 37.5 (5.1) |
| Time since diagnosis, mean (SD), mo | 9.1 (7.0) | 9.5 (8.3) | 11.0 (10.3) |
| Progression rate, mean (SD), units/moa | 0.58 (0.44) | 0.91 (0.61) | 0.52 (0.25) |
| Upper motor neuron burden at diagnosis, mean (SD)b | 1.96 (0.77) | 2.04 (0.77) | 2.05 (0.85) |
| Upper motor neuron index, mean (SD)c | 2.78 (1.76) | 3.65 (1.85) | 3.74 (1.69) |
| SVC, % estimated, mean (SD) | 85.5 (20.0) | 77.1 (19.4) | 73.8 (17.2) |
| HHD, mean (SD), kg | 7.16 (4.72) | 6.64 (4.90) | 6.58 (4.02) |
| SICI−1, median (IQR), mV/mV | 1.33 (1.04-5.03) | 2.17 (1.32-3.17) | 1.20 (0.66-2.66) |
| RMT, mean (SD), % | 57.7 (12.6) | 54.0 (11.7) | 49.3 (13.9) |
| MEP at 120% of RMT, median (IQR), mV | 0.57 (0.42-1.26) | 0.56 (0.36-0.76) | 0.38 (0.14-0.79) |
| ICF, median (IQR), mV/mV | 1.50 (1.03-2.13) | 1.44 (0.94-2.49) | 1.68 (0.99-2.57) |
| CSP, median (IQR), ms | 87.8 (29.2-128.0) | 61.7 (39.8-122.0) | 84.6 (41.4-134.0) |
| MEP at 150% of RMT, median (IQR), mV | 1.41 (0.76-2.13) | 1.84 (1.48-3.14) | 1.27 (0.54-1.77) |
| Peak CMAP, median (IQR), mV | 3.78 (2.15-8.07) | 4.86 (4.22-7.48) | 3.67 (2.31-5.47) |
| SDTC, median (IQR), ms | 0.47 (0.44-0.53) | 0.45 (0.43-0.49) | 0.53 (0.47-0.58) |
| Rheobase, median (IQR), mA | 3.04 (2.72-3.60) | 3.85 (2.66-5.43) | 2.91 (2.43-3.84) |
| TEd at 90-100 ms, mean (SD), % | 68.3 (6.13) | 67.4 (6.22) | 69.0 (7.79) |
| TEh at 90-100 ms, mean (SD), % | −117 (21.7) | −117 (19.1) | −114 (27.8) |
| Latency, mean (SD), ms | 10.3 (1.17) | 10.3 (1.22) | 11.2 (1.72) |
| Superexcitability, mean (SD), % | −28 (7.41) | −28 (7.81) | −30 (8.76) |
| Subexcitability, mean (SD), % | 14.6 (6.07) | 13.4 (8.36) | 11.9 (2.96) |
Abbreviations: ALS, amyotrophic lateral sclerosis; ALSFRS-R, ALS Functional Rating Scale, Revised (score range: 0-48, with the highest score indicating no deficit); CMAP, compound motor action potential; CSP, cortical silent period; HHD, handheld dynamometry; ICF, intracortical facilitation; IQR, interquartile range; MEP, motor evoked potential; RMT, resting motor threshold; SDTC, strength-duration time constant; SICI, short-interval intracortical inhibition; SVC, slow vital capacity; TEd, depolarizing threshold electrotonus; TEh, hyperpolarizing threshold electrotonus.
Calculated as (48 – ALSFRS-R score)/time since disease onset.22
Calculated on a 3-point scale of bulbar, cervical, and lumbosacral evidence of upper motor neuron involvement in revised El Escorial criteria.23
Calculated on a 6-point scale of hyperactive reflexes using jaw, biceps, brachioradialis, triceps, knee, and ankle reflex rating.24
We observed a dose-dependent increase in SICI, the primary outcome quantified using SICI−1 (mean ratio, 600-mg/d exogabine group vs placebo group: 1.15 [95% CI, 0.87-1.52; P = .31]; 900-mg/d ezogabine group vs placebo group: 1.53 [95% CI, 1.12-2.09; P = .009]) (Figure 2A; Table 2). Whereas SICI−1 changed (percentage change in mean SICI−1 from pretreatment to weeks 6 and 8 visits) only minimally in the placebo (mean ratio, 0.91; 95% CI, 0.73-1.14; P = .39) and 600-mg/d ezogabine (mean ratio, 1.05; 95% CI, 0.82-1.34; P = .72) groups during the course of the trial, treatment with 900 mg/d of ezogabine increased SICI by nearly 40% (mean ratio, 1.39; 95% CI, 1.05-1.85; P = .03). The increase in SICI at 900 mg/d of ezogabine represented approximately 50% of the difference between participants with ALS and healthy control participants, based on reports in the literature19 and our own recordings of healthy control participants. Sensitivity analyses to adjust for individual baseline covariates and to evaluate the subset of participants using riluzole did not affect the primary outcome (eTable 1 in Supplement 2).
Figure 2. Effect of Ezogabine Treatment on Multiple Measurements of Upper and Lower Motor Neuron Excitability.
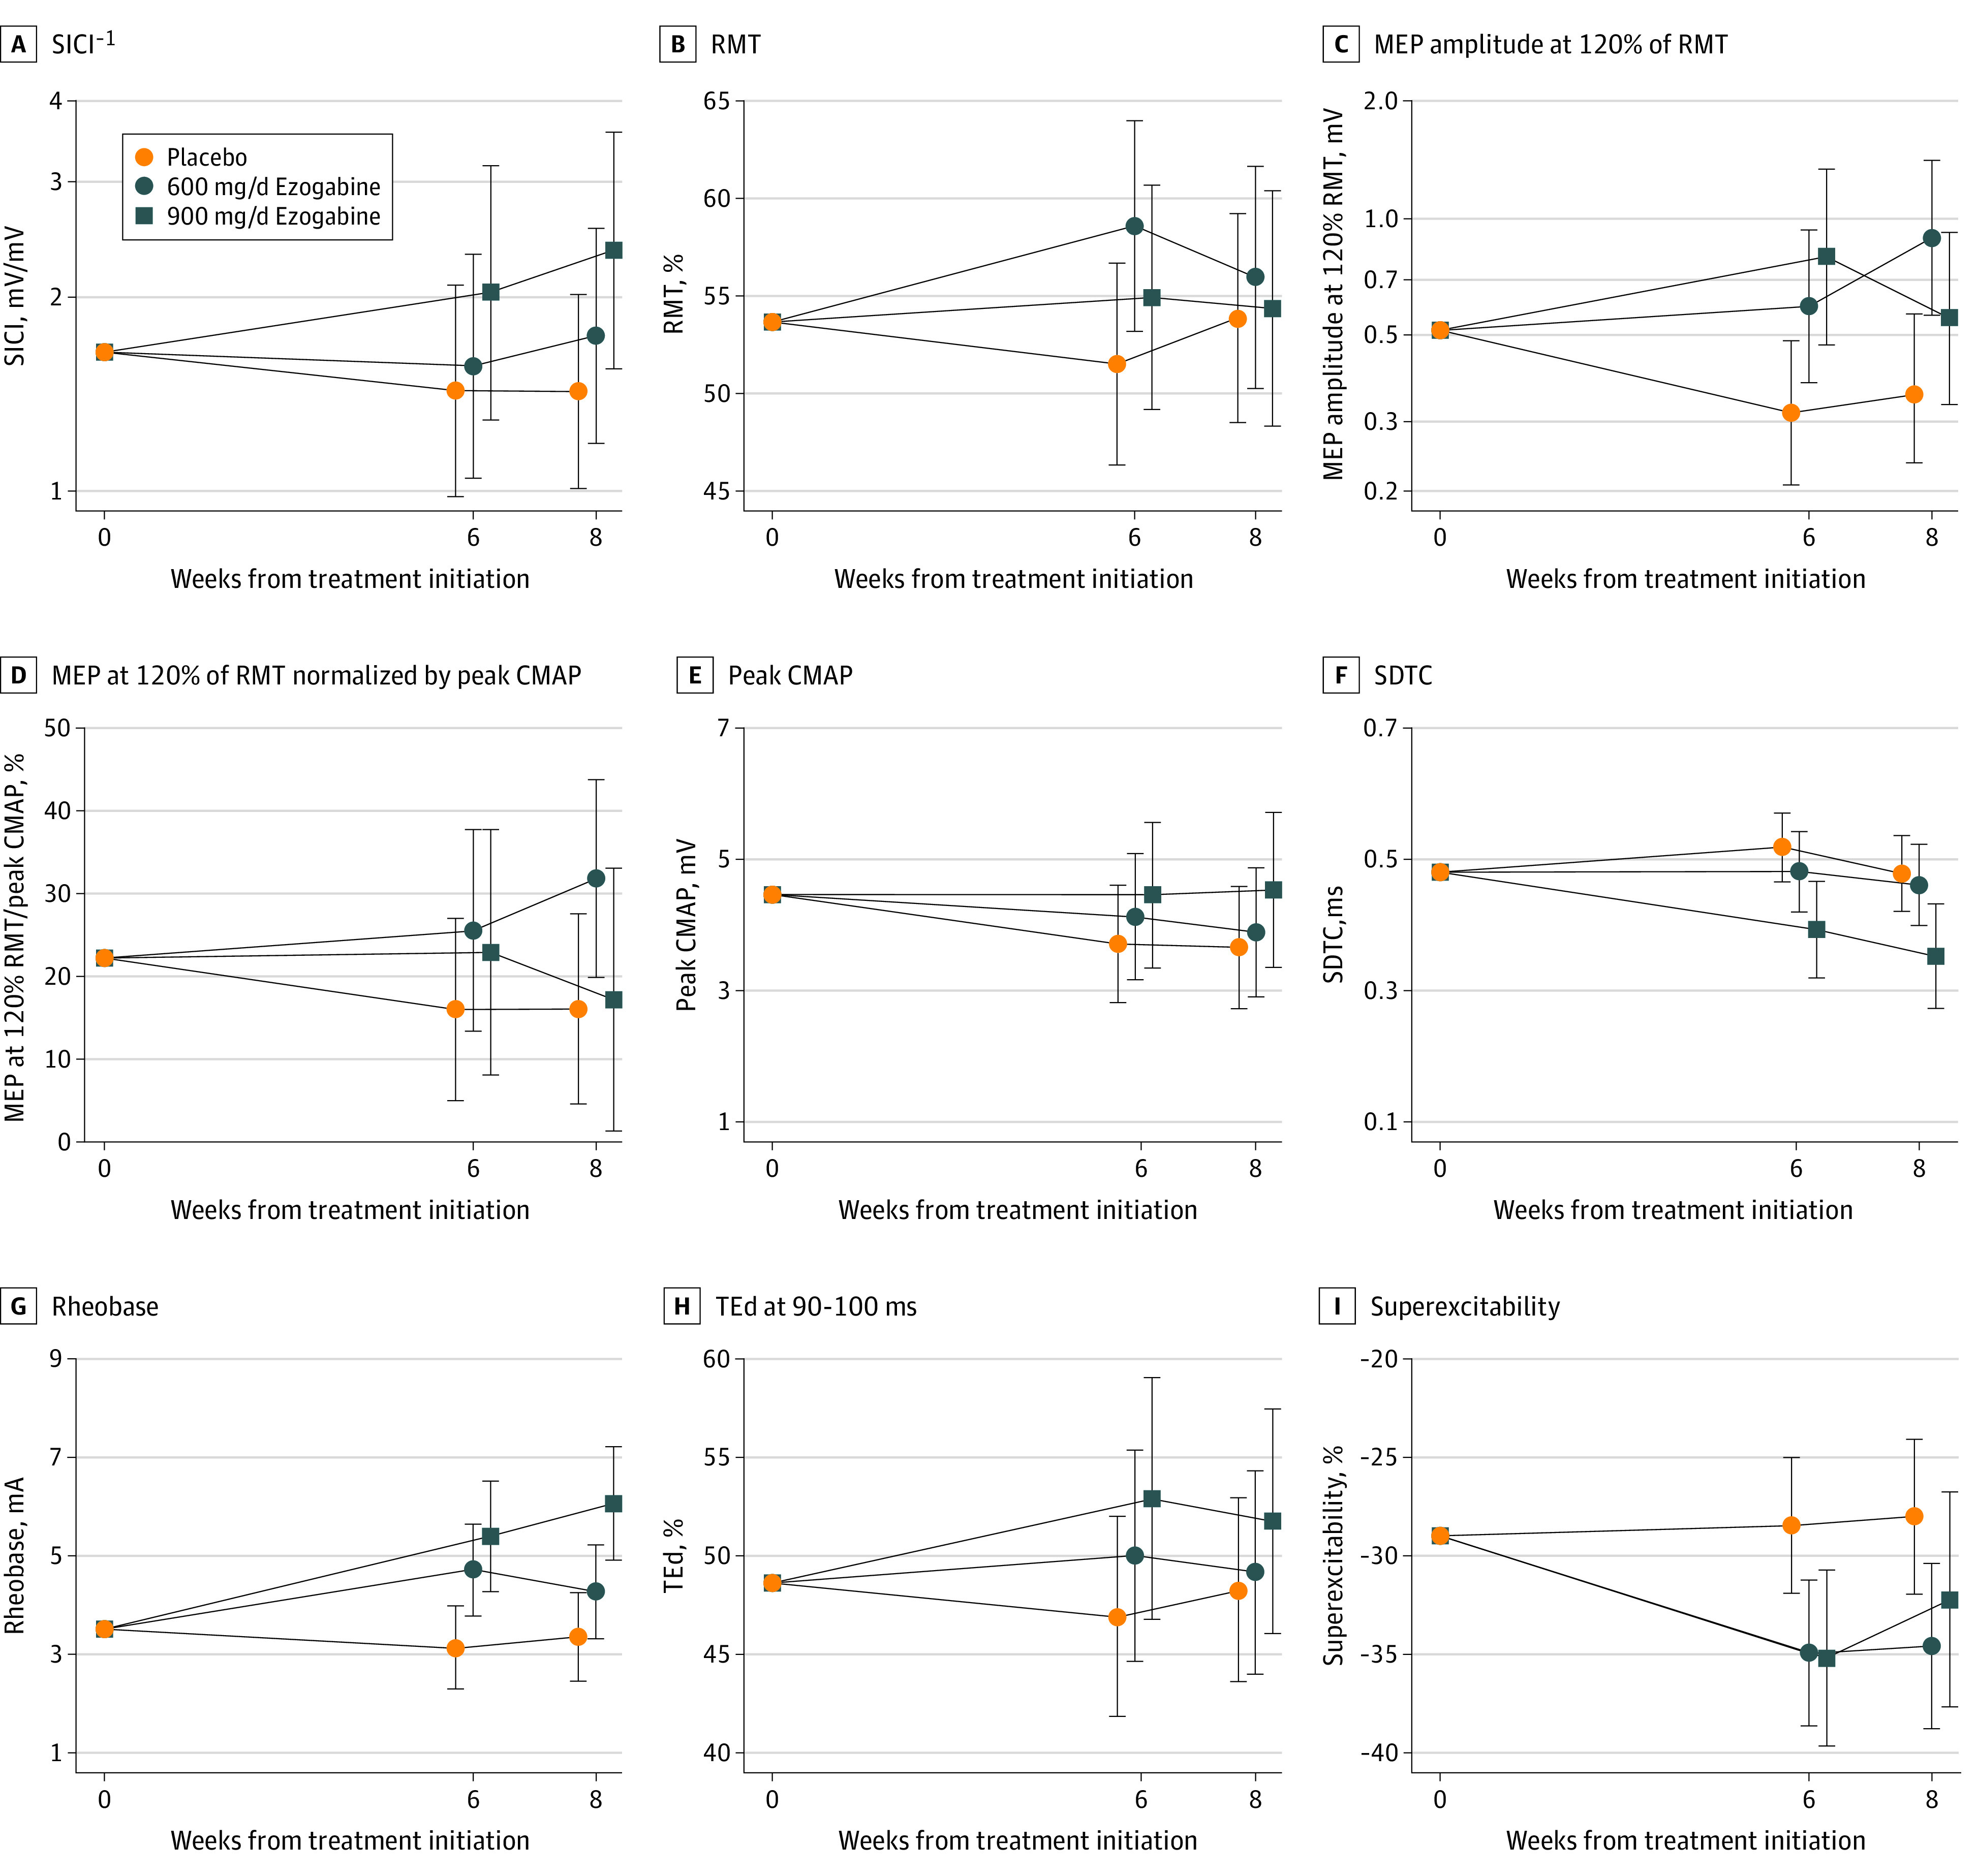
Plots show treatment- and visit-specific estimates with 95% CIs from a shared baseline, random-slopes model for short-interval intracortical inhibition (SICI) (A), resting motor threshold (RMT) (B), motor evoked potential (MEP) amplitude at 120% of RMT (C), MEP amplitude at 120% of RMT normalized by peak compound muscle action potential (CMAP) (D), peak CMAP (E), strength-duration time constant (SDTC) (F), rheobase (G), depolarizing threshold electrotonus (TEd) (H), and superexcitability (I).
Table 2. Neurophysiology and Progression Markers: Within-Group and Between-Group Comparisons.
| Parameter | Within-group comparison, mean change or ratio | Between-group comparison, mean difference or ratio | ||||||||
|---|---|---|---|---|---|---|---|---|---|---|
| Placebo | 600 mg/d Ezogabine | 900 mg/d Ezogabine | 600 mg/d Ezogabine vs placebo | 900 mg/d Ezogabine vs placebo | ||||||
| Estimated (95% CI) | P value | Estimated (95% CI) | P value | Estimated (95% CI) | P value | Estimated (95% CI) | P value | Estimated (95% CI) | P value | |
| TMS parameters | ||||||||||
| SICI−1, mV/mVa | 0.91 (0.73 to 1.14) | .39 | 1.05 (0.82 to 1.34) | .72 | 1.39 (1.05 to 1.85) | .03 | 1.15 (0.87 to 1.52) | .31 | 1.53 (1.12 to 2.09) | .009 |
| RMT (%) | −1.18 (−4.20 to 1.84) | .44 | 3.43 (0.10 to 6.76) | .04 | 0.77 (−2.80 to 4.34) | .67 | 4.61 (0.21 to 9.01) | .04 | 1.95 (−2.64 to 6.54) | .40 |
| MEP at 120% of RMT, mVa | 0.65 (0.48 to 0.87) | .005 | 1.41 (1.02 to 1.96) | .04 | 1.29 (0.89 to 1.86) | .17 | 2.18 (1.49 to 3.19) | <.001 | 1.99 (1.31 to 3.02) | .002 |
| ICF, mV/mVa | 0.92 (0.72 to 1.17) | .49 | 0.94 (0.72 to 1.23) | .66 | 0.85 (0.63 to 1.14) | .28 | 1.03 (0.73 to 1.44) | .88 | 0.93 (0.65 to 1.33) | .67 |
| CSP, msa | 1.50 (−11.66 to 14.66) | .82 | −8.22 (−22.85 to 6.41) | .27 | 9.49 (−6.51 to 25.49) | .24 | −9.722 (−28.57 to 9.12) | .31 | 7.99 (−11.95 to 27.93) | .43 |
| MEP at 120% of RMT/peak CMAP, mV/mVa | 0.87 (0.60 to 1.26) | .45 | 1.53 (1.01 to 2.30) | .04 | 1.16 (0.70 to 1.94) | .55 | 1.76 (1.05 to 2.93) | .03 | 1.34 (0.74 to 2.44) | .33 |
| MEP at 150% of RMT, mVa | 0.83 (0.60 to 1.14) | .23 | 1.22 (0.85 to 1.76) | .27 | 1.42 (0.99 to 2.03) | .06 | 1.48 (0.93 to 2.36) | .10 | 1.71 (1.08 to 2.73) | .02 |
| MEP at 150% of peak CMAP, mV/mVa | 1.00 (0.70 to 1.44) | .99 | 1.38 (0.91 to 2.10) | .12 | 1.26 (0.79 to 2.03) | .32 | 1.38 (0.85 to 2.24) | .19 | 1.26 (0.73 to 2.17) | .39 |
| TTNCS parameters | ||||||||||
| Peak CMAP, mVa | 0.78 (0.67 to 0.92) | .003 | 0.86 (0.72 to 1.03) | .09 | 0.98 (0.79 to 1.23) | .88 | 1.09 (0.86 to 1.39) | .46 | 1.25 (0.96 to 1.65) | .10 |
| SDTC, msa | 1.040 (0.93 to 1.16) | .48 | 0.97 (0.86 to 1.10) | .62 | 0.75 (0.65 to 0.88) | <.001 | 0.93 (0.79 to 1.10) | .40 | 0.73 (0.60 to 0.87) | <.001 |
| Rheobase, mAa | 0.97 (0.84 to 1.11) | .64 | 1.26 (1.08 to 1.47) | .003 | 1.64 (1.37 to 1.97) | <.001 | 1.31 (1.07 to 1.59) | .009 | 1.70 (1.36 to 2.12) | <.001 |
| TEd at 90-100 ms, % | −0.61 (−2.78 to 1.56) | .58 | 1.42 (−0.95 to 3.79) | .24 | 4.13 (1.15 to 7.12) | .007 | 2.04 (−0.97 to 5.04) | .18 | 4.75 (1.23 to 8.27) | .009 |
| TEh at 90-100 ms, % | 1.49 (−4.97 to 7.95) | .65 | −2.29 (−9.43 to 4.84) | .52 | 2.71 (−6.37 to 11.79) | .55 | −3.78 (−13.25 to 5.68) | .43 | 1.22 (−9.80 to 12.23) | .83 |
| Latency, ms | −0.01 (−0.33 to 0.32) | .97 | 0.06 (−0.30 to 0.41) | .75 | −0.55 (−0.97 to −0.13) | .01 | 0.06 (−0.38 to 0.51) | .78 | −0.55 (−1.05 to −0.05) | .03 |
| Superexcitability, % | 0.44 (−2.59 to 3.46) | .77 | −6.09 (−9.33 to −2.85) | <.001 | −5.02 (−9.20 to −0.85) | .02 | −6.52 (−10.85 to −2.19) | .004 | −5.46 (−10.53 to −0.39) | .04 |
| Subexcitability, % | 0.20 (−1.97 to 2.38) | .85 | −3.10 (−5.57 to −0.63) | .02 | 0.29 (−2.82 to 3.40) | .85 | −3.30 (−6.33 to −0.27) | .03 | 0.09 (−3.49 to 3.66) | .96 |
| Clinical metrics | ||||||||||
| ALSFRS-R score | −1.88 (−2.97 to −0.80) | <.001 | −1.65 (−2.78 to −0.51) | .005 | −1.94 (−3.16 to −0.72) | .002 | 0.24 (−1.27 to 1.75 to | .76 | −0.05 (−1.63 to 1.53) | .95 |
| SVC, % estimated | −3.53 (−6.68 to −0.39) | .03 | −5.71 (−9.10 to −2.33) | .001 | −7.87 (−11.60 to −4.14) | <.001 | −2.18 (−6.77 to 2.41) | .35 | −4.34 (−9.19 to 0.52) | .08 |
| HHD, kg | −0.84 (−1.94 to 0.27) | .14 | −1.24 (−2.41 to −0.07) | .04 | −0.43 (−1.72 to 0.86) | .51 | −0.40 (−1.99 to 1.18) | .62 | 0.40 (−1.27 to 2.08) | .64 |
Abbreviations: ALSFRS-R, Amyotrohpic Lateral Sclerosis Functional Rating Scale, Revised (score range: 0-48, with the highest score indicating no deficit); CMAP, compound muscle action potential; CSP, cortical silent period; HHD, handheld dynamometry; ICF, intracortical facilitation; MEP, motor evoked potential; RMT, resting motor threshold; SDTC, strength-duration time constant; SICI, short-interval intracortical inhibition; SVC, slow vital capacity;
TEd, depolarizing threshold electrotonus; TEh, hyperpolarizing threshold electrotonus; TMS, transcranial magnetic stimulation; TTNCS, threshold tracking nerve conduction studies.
Within-group comparisons show week 6 and week 8 on treatment vs pretreatment mean change or ratio.
Resting motor threshold increased with treatment in the 600-mg/d ezogabine group vs placebo group (mean ratio, 4.61; 95% CI, 0.21-9.01; P = .04), although the 900-mg/d ezogabine vs placebo comparison did not meet the threshold for statistical significance (mean ratio, 1.95; 95% CI, −2.64 to 6.54; P = .40) (Figure 2B; Table 2). The MEP amplitudes at moderate (120% of RMT) and stronger (140% and 150% of RMT) stimulation intensities were increased in each active drug group (mean ratio for 120% RMT, 600-mg/d ezogabine group vs placebo group: 2.18 [95% CI, 1.49-3.19; P < .001]; 900-mg/d ezogabine group vs placebo group: 1.99 [95% CI, 1.31-3.02; P = .002]) (Figure 2C; Table 2). Because lower MN function contributes to the raw MEP amplitudes, we also analyzed MEP amplitudes normalized by peak CMAP measured at the same visit (mean ratio, 600-mg/d ezogabine group vs placebo group: 1.76 [95% CI, 1.05-2.93; P = .03]; 900-mg/d ezogabine group vs placebo group: 1.34 [95% CI, 0.74-2.44; P = .33]) at 120% RMT, and the effects of treatment were largely eliminated (Figure 2D; Table 2).
Consistent with the hypothesis that the effects of ezogabine on unnormalized MEP amplitude resulted from changes in CMAP, peak CMAP declined from baseline in a dose-dependent manner by 22% in the placebo group (mean ratio, 0.78; 95% CI, 0.67-0.92; P = .003), but by 14% in the 600-mg/d ezogabine group (mean ratio, 0.86; 95% CI, 0.72-1.03; P = .09) and by only 2% in the 900-mg/d ezogabine group (mean ratio, 0.98; 95% CI, 0.79-1.23; P = .88), although the active vs placebo contrasts did not reach statistical significance (mean ratio, 600-mg/d ezogabine group vs placebo group: 1.09 [95% CI, 0.86-1.39; P = .46]; 900-mg/d ezogabine group vs placebo group: 1.25 [95% CI, 0.96-1.65; P = .10]) (Figure 2E; Table 2). The observed decrease in CMAP for the placebo group over 6 to 8 weeks was consistent with previously established yearly estimates of 84% decrement,25 whereas the extrapolated annual decrease in the 900-mg/d ezogabine group was only 12%.
Ezogabine treatment affected most measured TTNCS parameters, including SDTC and rheobase as markers of intrinsic axonal membrane excitability, threshold electrotonus, and recovery cycles. We observed a dose-dependent decrease in SDTC (mean ratio, 600-mg/d ezogabine group vs placebo group: 0.93 [95% CI, 0.79-1.10; P = .40]; 900-mg/d ezogabine group vs placebo group: 0.73 [95% CI, 0.60 to 0.87; P < .001]) (Figure 2F) and a dose-dependent increase in rheobase (mean ratio, 600-mg/d ezogabine group vs placebo group: 1.31 [95% CI, 1.07-1.59; P = .009]; 900-mg/d ezogabine group vs placebo group: 1.70 [95% CI, 1.36-2.12; P < .001]) (Figure 2G; Table 2), both consistent with a reduction in axonal excitability. The additional TTNCS parameters of depolarizing threshold electrotonus (mean difference, 600-mg/d ezogabine group vs placebo group: 2.04% [95% CI, −0.97 to 5.04; P = .18]; 900-mg/d ezogabine group vs placebo group: 4.75% [95% CI, 1.23-8.27; P = .009]), superexcitability (mean difference, 600-mg/d ezogabine group vs placebo group: −6.52% [95% CI, −10.85 to −2.19; P = .004]; 900-mg/d ezogabine group vs placebo group: −5.46% [95% CI, −10.53 to −0.39; P = .04]), and latency (mean difference, 600-mg/d ezogabine group vs placebo group: 0.06 milliseconds [95% CI, −0.38 to 0.51; P = .78]; 900-mg/d ezogabine group vs placebo group: −0.55 ms [95% CI, −1.05 to −0.05; P = .03]) were all affected with ezogabine treatment; 2 of 3 of these measures were altered in a dose-dependent manner (Figure 2H-I and Table 2).
On account of the direct connection between CMAP reduction and disease progression,25 we tested whether the treatment effect on cortical inhibition correlated with the effect on CMAP amplitude (eFigure 1 in Supplement 2). Increased SICI during treatment was correlated with a maintenance of or increase in CMAP amplitude (Spearman rank correlation = 0.34; 95% CI, 0.01-0.61; P = .04). Although 2 extreme values showed an unusually large increase in CMAP amplitude, the nonparametric Spearman correlation, based only on rank order, was robust to the effects of such outliers.
As expected, given the short 4-week full-dose treatment period, none of the typical measures of disease progression, namely, the ALS Functional Rating Scale, Revised score (mean change, 600 mg/d of ezogabine group vs placebo group: 0.24 [95% CI, −1.27 to 1.75; P = .76]; 900 mg/d of ezogabine group vs placebo group: −0.05 [95% CI, −1.63 to 1.53; P = .95]), SVC (mean change, 600 mg/d of ezogabine group vs placebo group: −2.18% [95% CI, −6.77 to 2.41; P = .35]; 900 mg/d of ezogabine group vs placebo group: −4.34% [95% CI, −9.19 to 0.52; P = .08]), and handheld dynamometry strength (mean change, 600 mg/d of ezogabine group vs placebo group: −0.40 [95% CI, −1.99 to 1.18; P = .62]; 900 mg/d of ezogabine group vs placebo group: 0.40 [95% CI, −1.27 to 2.08; P = .64]), changed in a statistically significant manner (eFigure 2 in Supplement 2; Table 2).
Drug tolerability rates were similar to the rates in studies of ezogabine for epilepsy,14 with permanent drug discontinuation of 30.4% in participants who received 600 mg/d of ezogabine (n = 7 of 23) and 26.3% in those who received 900 mg/d of ezogabine (n = 5 of 19), compared with 0% in participants who received placebo. Almost all of the permanent drug discontinuations were associated with AEs as either a primary or secondary reason for discontinuation.
Four serious AEs occurred after drug initiation. Obtundation occurred in a single participant randomized to the 900-mg/d dose and was deemed to have probable association with treatment. The other 3 serious AEs, single episodes of influenza, pneumonia, and stroke, occurred in participants who received the 600-mg/d dose and were found to have no association with treatment. No participants died during the trial.
Consistent with previous studies of ezogabine for epilepsy, treatment-emergent AEs were frequent in the current trial (Table 3 and eTable 2 in Supplement 2). The most frequent AEs included fatigue in 42.9% of participants who received active treatment (n = 18 of 42) and dizziness in 21.7% of participants who received the 600-mg/d dose (n = 5 of 23) and in 42.1% of those randomized to the 900-mg/d dose (n = 8 of 19) (eTable 2 in Supplement 2). Known anticholinergic gastrointestinal AEs were observed in a dose-dependent manner. Lower urinary tract symptoms were reported in previous ezogabine studies and were considered AEs of special concern in this trial because of possible disease-specific vulnerability or frequent use of anticholinergic medications.26 Urinary hesitation, retention, or flow decrease occurred in only 5 participants (21.7%) in the 600-mg/d ezogabine group and 1 participant (5.3%) in the 900-mg/d ezogabine group compared with 1 participant (4.3%) in the placebo group, and none required catheterization (eTable 2 in Supplement 2).
Table 3. Treatment-Emergent Serious Adverse Events and Adverse Events .
| Event | Placebo | 600 mg Ezogabine | 900 mg Ezogabine | |||
|---|---|---|---|---|---|---|
| Total reported events, No. | Participants with at least 1 adverse event, No. (%) | Total reported events, No. | Participants with at least 1 adverse event, No. (%) | Total reported events, No. | Participants with at least 1 adverse event, No. (%) | |
| Serious adverse events | ||||||
| Infections and infestations | 0 | 0 | 2 | 1 (4.3) | 0 | 0 |
| Nervous system disorders | 0 | 0 | 1 | 1 (4.3) | 1 | 1 (5.3) |
| Overall | 0 | 0 | 3 | 2 (8.7) | 1 | 1 (5.3) |
| Adverse events | ||||||
| Blood and lymphatic system disorders | 0 | 0 | 1 | 1 (4.3) | 0 | 0 |
| Cardiac disorders | 0 | 0 | 2 | 1 (4.3) | 0 | 0 |
| Ear and labyrinth disorders | 1 | 1 (4.3) | 1 | 1 (4.3) | 1 | 1 (5.3) |
| Eye disorders | 4 | 3 (13.0) | 3 | 3 (13.0) | 2 | 2 (10.5) |
| Gastrointestinal disorders | 9 | 6 (26.1) | 24 | 9 (39.1) | 12 | 10 (52.6) |
| General disorders and administration site conditions | 10 | 7 (30.4) | 20 | 13 (56.5) | 14 | 11 (57.9) |
| Immune system disorders | 0 | 0 | 1 | 1 (4.3) | 0 | 0 |
| Infections and infestations | 3 | 3 (13.0) | 6 | 3 (13.0) | 4 | 4 (21.1) |
| Injury, poisoning, and procedural complications | 11 | 5 (21.7) | 13 | 9 (39.1) | 9 | 5 (26.3) |
| Investigations | 2 | 2 (8.7) | 12 | 6 (26.1 | 5 | 3 (15.8) |
| Metabolism and nutrition disorders | 0 | 0 | 6 | 4 (17.4) | 0 | 0 |
| Musculoskeletal and connective tissue disorders | 18 | 8 (34.8) | 13 | 8 (34.8) | 9 | 6 (31.6) |
| Nervous system disorders | 18 | 11 (47.8) | 31 | 10 (43.5) | 34 | 16 (84.2) |
| Psychiatric disorders | 5 | 2 (8.7) | 5 | 3 (13.0) | 15 | 9 (47.4) |
| Renal and urinary disorders | 2 | 2 (8.7) | 13 | 8 (34.8) | 3 | 3 (15.8) |
| Respiratory, thoracic, and mediastinal disorders | 4 | 2 (8.7) | 10 | 7 (30.4) | 5 | 4 (21.1) |
| Skin and subcutaneous tissue disorders | 3 | 1 (4.3) | 9 | 6 (26.1) | 3 | 2 (10.5) |
| Surgical and medical procedures | 1 | 1 (4.3) | 0 | 0 | 0 | 0 |
| Vascular disorders | 2 | 2 (8.7) | 0 | 0 | 0 | 0 |
| Overall | 93 | 22 (95.7) | 170 | 22 (95.7) | 116 | 19 (100) |
Discussion
Treatment with ezogabine decreased both cortical and spinal MN excitability in participants with ALS. Large improvements in neurophysiological outcomes were observed in the primary and key secondary TMS parameters and the main TTNCS parameters, among others, and many changes were dose dependent. The effect of ezogabine on clinical progression and the association between these neurophysiological parameters and clinical progression are not yet known. The results of this trial suggest the potential for TMS and TTNCS metrics as pharmacodynamic biomarkers in multi-site clinical trials of drugs that target increased excitability in ALS.
The need for biomarker-driven outcomes in neurodegenerative disease trials is critical.27 We optimized TMS methods for consistency across sites28 and selected SICI, an index of cortical motor excitability, as the primary outcome measure because of the large magnitude of SICI decrease in ALS.4,19,20 The increase in SICI that we observed during a 900-mg/d dose ezogabine treatment corrected about half the heightened excitability separating participants with ALS from healthy control participants.
Because SICI has high test-retest variability, we chose RMT, the minimum stimulator output intensity for eliciting an MEP, as the key secondary outcome because of the desired strong within-participant reproducibility for a pharmacodynamics trial.29 However, measurements of RMT in ALS have yielded conflicting results: decreased,30,31,32 unchanged,33 or increased RMT34 in participants with ALS compared with control participants, which presumably reflect the complicated effects of motor cortex excitability, atrophy, and disease progression.35 In the present trial, 16.7% of participants had baseline RMT levels that were greater than the maximum stimulator output, and 5.6% of participants had high RMT levels that precluded SICI measurement. The number of participants in whom we could not record an MEP was higher than in previous publications.8 This result may simply be the expected outcome of corticospinal disease progression or the use of figure-of-8 coils, which provide more focused stimulation but compromise power compared with circular coils.
Multiple studies have also described spinal MN hyperexcitability in ALS.5,7,36 We observed changes in axonal TTNCS parameters in response to ezogabine, which were consistent with decreased axonal excitability. Increased SDTC is the measurement best associated with axonal hyperexcitability in ALS,5,7,36 and the magnitude of reduction in SDTC brought on by ezogabine treatment exceeded the difference between participants with ALS and control individuals, based on values reported in the literature5,36 and our own unpublished comparisons of patients with ALS and healthy control individuals. Increased depolarizing threshold electrotonus (90-100 milliseconds) and decreased SDTC matched the findings seen with experimentally induced MN membrane hyperpolarization.37 These results paralleled the increased rheobase and membrane hyperpolarization observed after ezogabine treatment of iPSC-derived MNs from participants with ALS measured in vitro using whole-cell patch clamp.10
The short duration of treatment (4 weeks at full dose) was not expected to affect disease progression metrics such as the ALS Functional Rating Scale, Revised score; SVC; and handheld dynamometry strength. However, we did detect a numerical dose-dependent preservation of CMAP amplitude over the trial duration. Although the effect did not meet statistical significance in the active treatment vs placebo comparisons, it merits further consideration. The observed increase in MEP amplitude and loss of this effect after normalizing for peak CMAP provide additional support for an effect on CMAP. Long-term measurement of CMAP amplitude change generally is not believed to be a valuable biomarker in ALS trials because of its variability38 and the perception that CMAP is insensitive until more than half of MNs are lost,39 although CMAP decrement precedes MN death in SOD1 mouse models.40,41 The observed correlation between an increase in SICI and maintained CMAP amplitude suggests that decreasing cortical excitability may yield a clinically relevant neuroprotective effect, a hypothesis that is consistent with studies that linked hyperexcitability to additional pathophysiological mechanisms, including oxidative stress, C9orf72-specific dipeptide repeat toxic effect, and transactivating response region (TAR) DNA-binding protein (commonly known as TDP-43) pathology.10,12,13,42,43
From an electrophysiological perspective, potassium channel activators (compared with sodium channel blockers, a major action of the ALS treatment mainstay riluzole) may be an attractive option for correcting hyperexcitability because of their function in determining resting membrane potential.44,45 Supporting the conclusions from this trial is the finding from a single-dose, same-day evaluation of ezogabine performed during trial recruitment that showed similar effects of ezogabine, but not riluzole, on axonal excitability.46 A separate investigation found only transient effects of riluzole on axonal excitability, changes that were not evident after 8 weeks of treatment.47
Limitations
Limitations of this trial reflect the low numbers of participants, inherent variability of some neurophysiological metrics, and selection of participants for feasibility of neurophysiological measurements, as suggested by the high baseline CMAP amplitudes. Unblinding was a further limitation, on account of the high frequency of adverse events, although it seems an unlikely explanation for differences in objectively measured neurophysiological outcomes. Larger trials with longer treatment durations will be necessary to ascertain whether measures of SICI and SDTC can act as surrogates for ALS progression, and whether sustained modulation of these biomarker metrics will yield disease improvement.
Conclusions
Ezogabine treatment decreased MN excitability in participants with ALS, suggesting that clinical neurophysiological metrics of cortical and spinal MN excitability may be used as pharmacodynamic biomarkers in a multi-site clinical trial format. Further studies are necessary to determine whether longer treatment can sustain the effects on excitability and slow disease progression. Findings from this trial validate the use of iPSC-based in vitro models for identifying novel disease targets and rapidly repurposing existing drugs for clinical trials.
Trial protocol
eMethods
eFigure 1. Increased Cortical Inhibition Correlates With Maintained CMAP During Treatment
eFigure 2. 10-Week Treatment Has Little Effect on Disease Progression Metrics
eTable 1. Sensitivity Analyses of Treatment Effects on SICI−1 Adjusting for Potential Confounders or Restricting to Participants on Riluzole
eTable 2. Treatment-Emergent Adverse Events by MedDRA System Organ Class and Preferred Terms
eReferences
Data sharing statement
References
- 1.Brown RH, Al-Chalabi A. Amyotrophic lateral sclerosis. N Engl J Med. 2017;377(2):162-172. doi: 10.1056/NEJMra1603471 [DOI] [PubMed] [Google Scholar]
- 2.Vucic S, Nicholson GA, Kiernan MC. Cortical hyperexcitability may precede the onset of familial amyotrophic lateral sclerosis. Brain. 2008;131(Pt 6):1540-1550. doi: 10.1093/brain/awn071 [DOI] [PubMed] [Google Scholar]
- 3.Blair IP, Williams KL, Warraich ST, et al. FUS mutations in amyotrophic lateral sclerosis: clinical, pathological, neurophysiological and genetic analysis. J Neurol Neurosurg Psychiatry. 2010;81(6):639-645. doi: 10.1136/jnnp.2009.194399 [DOI] [PubMed] [Google Scholar]
- 4.Menon P, Geevasinga N, Yiannikas C, Howells J, Kiernan MC, Vucic S. Sensitivity and specificity of threshold tracking transcranial magnetic stimulation for diagnosis of amyotrophic lateral sclerosis: a prospective study. Lancet Neurol. 2015;14(5):478-484. doi: 10.1016/S1474-4422(15)00014-9 [DOI] [PubMed] [Google Scholar]
- 5.Mogyoros I, Kiernan MC, Burke D, Bostock H. Strength-duration properties of sensory and motor axons in amyotrophic lateral sclerosis. Brain. 1998;121(Pt 5):851-859. doi: 10.1093/brain/121.5.851 [DOI] [PubMed] [Google Scholar]
- 6.Geevasinga N, Menon P, Howells J, Nicholson GA, Kiernan MC, Vucic S. Axonal ion channel dysfunction in c9orf72 familial amyotrophic lateral sclerosis. JAMA Neurol. 2015;72(1):49-57. doi: 10.1001/jamaneurol.2014.2940 [DOI] [PubMed] [Google Scholar]
- 7.Kanai K, Shibuya K, Sato Y, et al. Motor axonal excitability properties are strong predictors for survival in amyotrophic lateral sclerosis. J Neurol Neurosurg Psychiatry. 2012;83(7):734-738. doi: 10.1136/jnnp-2011-301782 [DOI] [PubMed] [Google Scholar]
- 8.Shibuya K, Park SB, Geevasinga N, et al. Motor cortical function determines prognosis in sporadic ALS. Neurology. 2016;87(5):513-520. doi: 10.1212/WNL.0000000000002912 [DOI] [PubMed] [Google Scholar]
- 9.Sances S, Bruijn LI, Chandran S, et al. Modeling ALS with motor neurons derived from human induced pluripotent stem cells. Nat Neurosci. 2016;19(4):542-553. doi: 10.1038/nn.4273 [DOI] [PMC free article] [PubMed] [Google Scholar]
- 10.Wainger BJ, Kiskinis E, Mellin C, et al. Intrinsic membrane hyperexcitability of amyotrophic lateral sclerosis patient-derived motor neurons. Cell Rep. 2014;7(1):1-11. doi: 10.1016/j.celrep.2014.03.019 [DOI] [PMC free article] [PubMed] [Google Scholar]
- 11.Moakley D, Koh J, Pereira JD, et al. Pharmacological profiling of purified human stem cell-derived and primary mouse motor neurons. Sci Rep. 2019;9(1):10835. doi: 10.1038/s41598-019-47203-7 [DOI] [PMC free article] [PubMed] [Google Scholar]
- 12.Kiskinis E, Sandoe J, Williams LA, et al. Pathways disrupted in human ALS motor neurons identified through genetic correction of mutant SOD1. Cell Stem Cell. 2014;14(6):781-795. doi: 10.1016/j.stem.2014.03.004 [DOI] [PMC free article] [PubMed] [Google Scholar]
- 13.Shi Y, Lin S, Staats KA, et al. Haploinsufficiency leads to neurodegeneration in C9ORF72 ALS/FTD human induced motor neurons. Nat Med. 2018;24(3):313-325. doi: 10.1038/nm.4490 [DOI] [PMC free article] [PubMed] [Google Scholar]
- 14.Brodie MJ, Lerche H, Gil-Nagel A, et al. ; RESTORE 2 Study Group . Efficacy and safety of adjunctive ezogabine (retigabine) in refractory partial epilepsy. Neurology. 2010;75(20):1817-1824. doi: 10.1212/WNL.0b013e3181fd6170 [DOI] [PubMed] [Google Scholar]
- 15.Di Lazzaro V, Rothwell J, Capogna M. Noninvasive stimulation of the human brain: activation of multiple cortical circuits. Neuroscientist. 2018;24(3):246-260. doi: 10.1177/1073858417717660 [DOI] [PubMed] [Google Scholar]
- 16.Kobayashi M, Pascual-Leone A. Transcranial magnetic stimulation in neurology. Lancet Neurol. 2003;2(3):145-156. doi: 10.1016/S1474-4422(03)00321-1 [DOI] [PubMed] [Google Scholar]
- 17.Kiernan MC, Burke D, Andersen KV, Bostock H. Multiple measures of axonal excitability: a new approach in clinical testing. Muscle Nerve. 2000;23(3):399-409. doi: 10.1002/(SICI)1097-4598(200003)23:3<399::AID-MUS12>3.0.CO;2-G [DOI] [PubMed] [Google Scholar]
- 18.Kiernan MC, Bostock H, Park SB, et al. Measurement of axonal excitability: consensus guidelines. Clin Neurophysiol. 2020;131(1):308-323. doi: 10.1016/j.clinph.2019.07.023 [DOI] [PubMed] [Google Scholar]
- 19.Stefan K, Kunesch E, Benecke R, Classen J. Effects of riluzole on cortical excitability in patients with amyotrophic lateral sclerosis. Ann Neurol. 2001;49(4):536-539. doi: 10.1002/ana.107 [DOI] [PubMed] [Google Scholar]
- 20.Caramia MD, Palmieri MG, Desiato MT, et al. Pharmacologic reversal of cortical hyperexcitability in patients with ALS. Neurology. 2000;54(1):58-64. doi: 10.1212/WNL.54.1.58 [DOI] [PubMed] [Google Scholar]
- 21.Liang K-Y;, Zeger SL Longitudinal data analysis of continuous and discrete responses for pre-post designs. Sankhyā: Indian J Stat Ser B (1960-2002). 2000;62(1):134-148. [Google Scholar]
- 22.Kimura F, Fujimura C, Ishida S, et al. Progression rate of ALSFRS-R at time of diagnosis predicts survival time in ALS. Neurology. 2006;66(2):265-267. doi: 10.1212/01.wnl.0000194316.91908.8a [DOI] [PubMed] [Google Scholar]
- 23.Ludolph A, Drory V, Hardiman O, et al. ; WFN Research Group On ALS/MND . A revision of the El Escorial criteria—2015. Amyotroph Lateral Scler Frontotemporal Degener. 2015;16(5-6):291-292. doi: 10.3109/21678421.2015.1049183 [DOI] [PubMed] [Google Scholar]
- 24.Turner MR, Cagnin A, Turkheimer FE, et al. Evidence of widespread cerebral microglial activation in amyotrophic lateral sclerosis: an [11C](R)-PK11195 positron emission tomography study. Neurobiol Dis. 2004;15(3):601-609. doi: 10.1016/j.nbd.2003.12.012 [DOI] [PubMed] [Google Scholar]
- 25.Shefner JM, Watson ML, Simionescu L, et al. Multipoint incremental motor unit number estimation as an outcome measure in ALS. Neurology. 2011;77(3):235-241. doi: 10.1212/WNL.0b013e318225aabf [DOI] [PMC free article] [PubMed] [Google Scholar]
- 26.Ciliberto MA, Weisenberg JL, Wong M. Clinical utility, safety, and tolerability of ezogabine (retigabine) in the treatment of epilepsy. Drug Healthc Patient Saf. 2012;4:81-86. [DOI] [PMC free article] [PubMed] [Google Scholar]
- 27.Gladman M, Cudkowicz M, Zinman L. Enhancing clinical trials in neurodegenerative disorders: lessons from amyotrophic lateral sclerosis. Curr Opin Neurol. 2012;25(6):735-742. doi: 10.1097/WCO.0b013e32835a309d [DOI] [PubMed] [Google Scholar]
- 28.Davila-Pérez P, Jannati A, Fried PJ, Cudeiro Mazaira J, Pascual-Leone A. The effects of waveform and current direction on the efficacy and test-retest reliability of transcranial magnetic stimulation. Neuroscience. 2018;393:97-109. doi: 10.1016/j.neuroscience.2018.09.044 [DOI] [PMC free article] [PubMed] [Google Scholar]
- 29.Hermsen AM, Haag A, Duddek C, et al. Test-retest reliability of single and paired pulse transcranial magnetic stimulation parameters in healthy subjects. J Neurol Sci. 2016;362:209-216. doi: 10.1016/j.jns.2016.01.039 [DOI] [PubMed] [Google Scholar]
- 30.Schanz O, Bageac D, Braun L, Traynor BJ, Lehky TJ, Floeter MK. Cortical hyperexcitability in patients with C9ORF72 mutations: relationship to phenotype. Muscle Nerve. 2016;54(2):264-269. doi: 10.1002/mus.25047 [DOI] [PMC free article] [PubMed] [Google Scholar]
- 31.Williams KL, Fifita JA, Vucic S, et al. Pathophysiological insights into ALS with C9ORF72 expansions. J Neurol Neurosurg Psychiatry. 2013;84(8):931-935. doi: 10.1136/jnnp-2012-304529 [DOI] [PubMed] [Google Scholar]
- 32.Menon P, Kiernan MC, Vucic S. Cortical hyperexcitability precedes lower motor neuron dysfunction in ALS. Clin Neurophysiol. 2015;126(4):803-809. doi: 10.1016/j.clinph.2014.04.023 [DOI] [PubMed] [Google Scholar]
- 33.Zanette G, Tamburin S, Manganotti P, Refatti N, Forgione A, Rizzuto N. Changes in motor cortex inhibition over time in patients with amyotrophic lateral sclerosis. J Neurol. 2002;249(12):1723-1728. doi: 10.1007/s00415-002-0926-7 [DOI] [PubMed] [Google Scholar]
- 34.Chervyakov AV, Bakulin IS, Savitskaya NG, et al. Navigated transcranial magnetic stimulation in amyotrophic lateral sclerosis. Muscle Nerve. 2015;51(1):125-131. doi: 10.1002/mus.24345 [DOI] [PubMed] [Google Scholar]
- 35.Mills KR, Nithi KA. Corticomotor threshold to magnetic stimulation: normal values and repeatability. Muscle Nerve. 1997;20(5):570-576. doi: 10.1002/(SICI)1097-4598(199705)20:5<570::AID-MUS5>3.0.CO;2-6 [DOI] [PubMed] [Google Scholar]
- 36.Vucic S, Kiernan MC. Axonal excitability properties in amyotrophic lateral sclerosis. Clin Neurophysiol. 2006;117(7):1458-1466. doi: 10.1016/j.clinph.2006.04.016 [DOI] [PubMed] [Google Scholar]
- 37.Kiernan MC, Bostock H. Effects of membrane polarization and ischaemia on the excitability properties of human motor axons. Brain. 2000;123(Pt 12):2542-2551. doi: 10.1093/brain/123.12.2542 [DOI] [PubMed] [Google Scholar]
- 38.Rutkove SB Clinical measures of disease progression in amyotrophic lateral sclerosis. Neurotherapeutics. 2015;12(2):384-393. doi: 10.1007/s13311-014-0331-9 [DOI] [PMC free article] [PubMed] [Google Scholar]
- 39.Bromberg MB, Brownell AA. Motor unit number estimation in the assessment of performance and function in motor neuron disease. Phys Med Rehabil Clin N Am. 2008;19(3):509-532, ix. doi: 10.1016/j.pmr.2008.02.006 [DOI] [PubMed] [Google Scholar]
- 40.McCampbell A, Cole T, Wegener AJ, et al. Antisense oligonucleotides extend survival and reverse decrement in muscle response in ALS models. J Clin Invest. 2018;128(8):3558-3567. doi: 10.1172/JCI99081 [DOI] [PMC free article] [PubMed] [Google Scholar]
- 41.Kanning KC, Kaplan A, Henderson CE. Motor neuron diversity in development and disease. Annu Rev Neurosci. 2010;33(1):409-440. doi: 10.1146/annurev.neuro.051508.135722 [DOI] [PubMed] [Google Scholar]
- 42.Westergard T, McAvoy K, Russell K, et al. Repeat-associated non-AUG translation in C9orf72-ALS/FTD is driven by neuronal excitation and stress. EMBO Mol Med. 2019;11(2):e9423. doi: 10.15252/emmm.201809423 [DOI] [PMC free article] [PubMed] [Google Scholar]
- 43.Weskamp K, Tank EM, Miguez R, et al. Shortened TDP43 isoforms upregulated by neuronal hyperactivity drive TDP43 pathology in ALS. J Clin Invest. 2020;130(3):1139-1155. doi: 10.1172/JCI130988 [DOI] [PMC free article] [PubMed] [Google Scholar]
- 44.Urbani A, Belluzzi O. Riluzole inhibits the persistent sodium current in mammalian CNS neurons. Eur J Neurosci. 2000;12(10):3567-3574. doi: 10.1046/j.1460-9568.2000.00242.x [DOI] [PubMed] [Google Scholar]
- 45.Bean BP The action potential in mammalian central neurons. Nat Rev Neurosci. 2007;8(6):451-465. doi: 10.1038/nrn2148 [DOI] [PubMed] [Google Scholar]
- 46.Kovalchuk MO, Heuberger JAAC, Sleutjes BTHM, et al. Acute effects of riluzole and retigabine on axonal excitability in patients with amyotrophic lateral sclerosis: a randomized, double-blind, placebo-controlled, crossover trial. Clin Pharmacol Ther. 2018;104(6):1136-1145. doi: 10.1002/cpt.1096 [DOI] [PubMed] [Google Scholar]
- 47.Geevasinga N, Menon P, Ng K, et al. Riluzole exerts transient modulating effects on cortical and axonal hyperexcitability in ALS. Amyotroph Lateral Scler Frontotemporal Degener. 2016;17(7-8):580-588. doi: 10.1080/21678421.2016.1188961 [DOI] [PubMed] [Google Scholar]
Associated Data
This section collects any data citations, data availability statements, or supplementary materials included in this article.
Supplementary Materials
Trial protocol
eMethods
eFigure 1. Increased Cortical Inhibition Correlates With Maintained CMAP During Treatment
eFigure 2. 10-Week Treatment Has Little Effect on Disease Progression Metrics
eTable 1. Sensitivity Analyses of Treatment Effects on SICI−1 Adjusting for Potential Confounders or Restricting to Participants on Riluzole
eTable 2. Treatment-Emergent Adverse Events by MedDRA System Organ Class and Preferred Terms
eReferences
Data sharing statement