

Abstract

The absolute configuration and conformations of (−)-tert-butylphenylphosphinoamidate were determined using three different chiroptical spectroscopic methods, namely vibrational circular dichroism (VCD), electronic circular dichroism (ECD), and optical rotatory dispersion (ORD). In each of the spectroscopic methods used, experimental data for the (−)-enantiomer of tert-butylphenylphosphinoamidate were measured in the solution phase. Using the concentration-dependent experimental infrared spectra, the existence of dimers in the solution was investigated, and the monomer–dimer equilibrium constant was determined. Concomitant quantum mechanical predictions of the VCD, ECD, and ORD for monomeric tert-butylphenylphosphinoamidate were carried out using density functional theory (DFT) calculations using the B3LYP functional and the 6-31G(d), 6-311G(2d,2p) and aug-cc-pVDZ basis sets. Similar predictions for dimeric tert-butylphenylphosphinoamidate were also obtained using the B3LYP/6-31G(d) method. A comparison of theoretically predicted data with the corresponding experimental data led to the elucidation of the absolute configuration as (−)-(R)-tert-butylphenylphosphinoamidate with one predominant conformation in the solution. This conclusion was independently supported by X-ray analysis of the complex with (+)-R-2,2′-dihydroxy-1,1′-binaphthol ((+)-R- BINOL).
Introduction
Over the past decade, a diverse assortment of chiral phosphorus reagents has been identified,1−5 which subsequently resulted in substantial progress in application of these reagents in a variety of stoichiometric and catalytic versions of asymmetric and stereoselective synthesis. Within the rich family of phosphorus compounds, phosphonic amides or phosphinamides were identified as particularly useful reagents.6−9 A series of phosphinamides was reported,3a,3b which act as novel catalysts for the asymmetric reductions of ketones by borane. These studies indicated that phosphinamides act as Lewis bases that activate borane and effectively accelerate the reduction through the donation of electron density. Li and co-workers reported4a,4b a similar class of phosphinamides, derived from l-amino acids, which facilitate the synthesis of chiral secondary alcohols in excellent chemical yields and a moderate to high enantiomeric excess. Further, Sorensen et al. recently reported10 the design and synthesis of novel cyclic phosphinamide derivatives, which act as potent matrix metalloproteinase inhibitors and thus could be considered as possible drug candidates for the treatment of diseases such as multiple sclerosis, osteoarthritis, and psoriasis as well as tumor growth and metastasis. Chan et al.11 suggested the use of phosphinic amides to modulate the activity of the endothelin family of peptides, which is responsible for causing vasoconstriction. This modulation potentially allows the treatment of endothelin-mediated disorders. Lin et al. described12 the synthesis of bis(aziridinyl)phosphinic amide derivatives of thymidine and suggested their potential application as anticancer agents. The recognition of phosphinamides as compounds of importance, both as synthetic auxiliaries and bioactive reagents, has attracted attention to the synthesis and characterization of these compounds.
From the literature cited in the previous paragraph, it is evident that chiral phosphinamides have demonstrated a potential for versatile applications as synthetic reagents as well as compounds of interest for biologically relevant use. The effectiveness and application of any chiral compound can be, to a significant extent, determined by its absolute configuration and stable conformation. In this manuscript, we report the determination of the absolute configuration and conformations of (−)-tert-butylphenylphosphinoamidate 1 (Figure 1) by three different chiroptical spectroscopic methods, namely vibrational circular dichroism (VCD), electronic circular dichroism (ECD), and optical rotatory dispersion (ORD). This determination was independently supported by X-ray analysis of its complex with a dextrorotatory enantiomer of BINOL. The monomer–dimer equilibrium of 1 in the solution state was also investigated, and the equilibrium constant was determined. The tautomers and conformers of 1 were also investigated, and the predominant tautomer and its conformation were determined.
Figure 1.

Chemical structures of tert-butylphenylphosphinoamidate 1.
Results and Discussion
Monomer–Dimer Equilibrium in Solution
To determine the absolute configuration of a chiral molecule, it is first necessary to establish its predominant conformations. In addition, for molecules that have a propensity for dimer formation, the monomer–dimer equilibrium needs to be investigated. For 1, intermolecular hydrogen bonding can occur through its oxygen atom and the hydrogen atoms of the primary amine group.
For the equilibrium between the monomer, A, and the dimer, A2, the following relations apply:13
| 1 |
| 2 |
| 3 |
where Cm and Cd represent the equilibrium concentrations of monomer and dimer, respectively; Co represents the concentration of the sample; and K stands for the monomer–dimer equilibrium constant. Using eqs 1–3, the integrated absorbance of the ith band of the monomer, Am,i = Cml∫εm,i(v) dv, becomes
| 4 |
where εm,i = ∫εm,i(v) dv represents the integrated molar absorptivity of the ith band of the monomer, l is the path length used, and Pm is the fractional population of the monomer given as
| 5 |
Nonlinear least-squares fitting of the integrated absorbance of individual bands of monomer, Am,i, with Co provides the equilibrium constant K and hence the fractional population of the monomer at a given concentration Co. The dimer population is then obtained as 1 – Pm.
The vibrational absorption (VA) spectra were measured (Figure 2) at five different concentrations in the 0.84–0.05 M range. In Figure 2, the band at 1570 cm–1 (labeled as VII) can be associated with the presence of the dimer, as the intensity of this band evolves when the concentration increases. The well-resolved bands I–V can be associated with the monomer. The concentration-dependent integrated area of each of these five bands was determined by fitting the individual bands to Lorentzian band profiles with the PeakFit14 program. The integrated band areas were used with eqs 4 and 5 for nonlinear least-squares fitting using KaleidaGraph.15 The average K value obtained from these five monomer bands (bands I–V) is 0.44 (±0.11). The uncertainties resulting from the spectral fitting process used in the PeakFit program can be avoided by considering the area of a larger region that contains only the monomer bands. By summing eq 4 over the monomer bands, one obtains
| 6 |
where the summation i runs over the monomer bands. The area in the 1518–1348 cm–1 range was used for nonlinear least-squares fitting using eq 6 (see Figure 3). The K value determined in this manner is 0.34 (±0.05). At the concentration used for the VCD studies (0.17 M), this K value corresponds to 90% monomer and 10% dimer populations. At the lower concentrations used for ECD (0.027 M) and ORD studies, the dimer population (∼2%) is negligible.
Figure 2.

Concentration-dependent (0.84–0.05 M) VA spectra of 1.
Figure 3.

Nonlinear least-squares fitting of the total area underneath bands I–V as a function of the concentration using eq 6.
Conformations of the Monomer
Monomer conformations of 1 were explored by considering three rotatable bonds (labeled as A, B, and C in Figure 1). The atom numbers for defining the dihedral angles associated with these rotatable bonds are included in Figure 1. Bond A corresponds to the dihedral angle D(4,3,12,13) and is associated with the phenyl group. A potential energy scan was performed by varying D(4,3,12,13) in 30° increments. Bond B corresponds to the dihedral angle D(18,17,12,13) and is associated with the tert-butyl group. Since the tert-butyl group has three equivalent methyl groups, a single 60° rotation was sufficient for exploring the conformational mobility around bond B. Bond C is associated with the primary amine group and dihedral angle D(15,14,12,13). This dihedral angle was incrementally varied five times, 60° at a time. The geometry optimization was carried out using a B3LYP functional with the 6-31G(d) basis set and resulted in two distinct conformations, which are given in Figure 4.
Figure 4.

Structures of the two stable monomer conformations of 1. Conformation 1 is significantly more stable than conformation 2.
The electronic energy difference between the two optimized conformers is approximately 3 kcal mol–1, with conformation 1 being significantly more stable than conformation 2. The minimum energy conformation obtained with the 6-31G(d) basis set was also optimized using the 6-311G(2d,2p) and aug-cc-pVDZ basis sets. A comparison of the converged values for the three relevant dihedral angles and electronic energies is displayed in Table 1.
Table 1. B3LYP-Optimized Dihedral Angles and Electronic Energies for (S)-1a.
| converged dihedral anglesa (°) |
|||||
|---|---|---|---|---|---|
| basis set | D(4, 3, 12, 13) | D(18, 17, 12, 13) | D(15,14,12, 13) | electronic energies (hartrees) | |
| 6-31G(d) | conformation 1 | –19.5 | –63.1 | –64.3 | –862.0747606 |
| conformation 2 | 158.3 | –175.3 | –34.8 | –862.0700732 | |
| 6-311G(2d,2p) | conformation 1 | –19.4 | –61 | –64.5 | –862.2817658 |
| aug-cc-pVDZ | conformation 1 | –19 | –62.5 | –64 | –862.1527717 |
The equilibrium between two tautomeric structures, 1a and 1b, (Figure 5) was also investigated as was done for phosphine oxide,1a phosphinothioic acid,1b and phosphites.16 In addition to the possible conformations of tautomer 1a discussed earlier, the conformations of 1b were investigated by varying the dihedral angles associated with the phenyl and tert-butyl groups. Tautomer 1b also exhibits two minimum energy conformations, one of which is considerably more stable than the other. The comparison of electronic energies obtained for the minimum energy conformers of 1a and 1b indicates that 1a is significantly more stable than 1b.
Figure 5.

Equilibrium between the two possible tautomers of 1. The electronic energy of the most stable conformation of 1b (−862.0384 hartree) is ∼20 kcal mol–1 higher than that of 1a (−862.0747606 hartree).
The lowest energy conformation of tautomer 1a with the (S)-configuration was used for calculating VA, VCD, ECD, and ORD using the B3LYP functional with the 6-31G(d), 6-311G(2d,2p), and aug-cc-pVDZ basis sets. From the calculated vibrational frequencies, the conformation considered was found to represent the minima on the potential energy surface as there are no imaginary frequencies. To obtain the theoretical data for (R)-1a, the magnitudes of the calculated VCD, ECD and ORD values for (S)-1a were multiplied by −1.
Conformations of the Dimer
Conformations of the dimer can be investigated either by assembling dimeric structures or through molecular dynamics simulations, as recently was done for pantolactone by Ghidinelli et al.17 Owing to the minor contributions from the dimer in the present case, we opted to use the former approach.
Dimer conformations of 1a were explored by considering all possible orientations of the two monomer units between which intermolecular hydrogen bonding can occur. As displayed in Figure 6, the amine hydrogen spatially closer to the phenyl ring was designated as “ph”, and the amine hydrogen spatially closer to the tert-butyl group was designated as “t-b”.
Figure 6.

Theoretical structures of the three stable dimer conformations (A, B, and C) of 1. The populations of the conformers in panels A, B, and C are 21%, 26%, and 53%, respectively.
The two monomeric units were oriented in three different ways toward each other to produce three different dimer forms. The B3LYP/6-31G(d) energies of the optimized geometries of these three forms indicated that the populations of dimers given in panels A, B, and C of Figure 6 are 21%, 26%, and 53%, respectively. These values were used to obtain the population-weighted VA and VCD spectra of the dimer. The predicted dimer spectra were overlaid with the monomer spectra at the B3LYP/6-31G(d) level for a comparison with the experimental spectrum in Figures 7 and 8.
Figure 7.

Comparison of the experimental VA spectrum with the predicted VA spectra of 1. Spectra are shifted upward for clarity. At the 6-31G(d) level, the following two traces are overlaid: a thin line corresponding to the monomer spectrum (90%) and a thick dashed red line corresponding to the dimer spectrum (10%).
Figure 8.

Comparison of the experimental VCD spectrum of (−)-1 with the predicted VCD spectra of (R)-1. Spectra are shifted upward for clarity. At the 6-31G(d) level, the following two traces are overlaid: a thin line corresponding to the monomer spectrum (90%) and a thick dashed red line corresponding to the dimer spectrum (10%).
Comparison of the Experimental and Predicted Spectra
The comparison between the experimental and predicted VA spectra is shown in Figure 7, while the comparison of the VCD spectra is shown in Figure 8. The theoretical VCD spectra displayed in Figure 8 correspond to (R)-1a, while the experimental spectrum is given for the (−)-1 enantiomer. In both Figures 7 and 8, the theoretical spectrum at the B3LYP/6-31G(d) level is given as overlaid monomer (90%) and dimer (10%) traces. As can be seen from Figure 7, the experimental VA band with the largest intensity at 1171 cm–1 corresponds to theoretical bands at 1166, 1176, and 1159 cm–1 in the 6-31G(d), 6-311G(2d,2p), aug-cc-pVDZ predicted spectra, respectively. In the frequency region below the highest intensity band, three VA bands are correlated between the theoretical and experimental spectra. The experimental band at 1117 cm–1 corresponds to the predicted modes at 1087, 1093, and 1116 cm–1 obtained with the 6-31G(d), 6-311G(2d,2p), and aug-cc-pVDZ basis sets, respectively. The experimental band at 1072 cm–1 corresponds to the predicted modes at 1065, 1063, and 1093 cm–1 obtained with the 6-31G(d), 6-311G(2d,2p), and aug-cc-pVDZ, basis sets, respectively. Finally, the experimental band at 1014 cm–1 corresponds to theoretical bands at 1011, 1010, and 1035 cm–1 obtained with the 6-31G(d), 6-311G(2d,2p), and aug-cc-pVDZ basis sets, respectively. In the frequency region between ∼1200 and 1700 cm–1, seven bands exhibit correspondence between the experimental and theoretical spectra. Specifically, the experimental bands at 1217, 1365, 1396, 1439, 1463, 1477, and 1556 cm–1 (with a shoulder at 1603 cm–1) correspond to 6-31G(d) predicted bands at 1205, 1371, 1400, 1426, 1474, 1492, 1580 cm–1; the 6-311G(2d,2p) predicted bands at 1204, 1362, 1390, 1428, 1464, 1483, and 1557 cm–1; and the aug-cc-pVDZ predicted bands at 1222, 1388, 1418, 1454, 1488, 1506, and 1586 cm–1, respectively. Figure 7 indicates a fairly good reproduction of the relative intensities of the correlated bands, especially in the ∼1200–1000 cm–1 region. Even though positions of the predicted and corresponding experimental vibrational bands differ quantitatively, an overall satisfactory one-to-one qualitative agreement reinforces the conclusion that the theoretically considered monomer conformation is the predominant solution conformation. Three notable VCD signals can be correlated between the experimental and monomer-predicted spectra. The positive experimental band at 1018 cm–1 corresponds to the positive bands at 1014, 1013, and 1038 cm–1 predicted with the 6-31G(d), 6-311G(2d,2p), and aug-cc-pVDZ basis sets, respectively. Another positive experimental band at 1153 cm–1 appears to correspond to the positive bands at 1166, 1176, and 1159 cm–1 predicted with the 6-31G(d), 6-311G(2d,2p), and aug-cc-pVDZ basis sets, respectively. A pair of closely spaced bisignate bands at (+)1198/(−)1217 cm–1 in the experimental spectrum corresponds to those at (+)1191/(−)1205 and at (+)1184/(−)1205 cm–1 in the 6-31G(d) and 6-311G(2d,2p) predicted spectra, respectively. The aug-cc-pVDZ basis set also shows this pair but with a smaller intensity, with the negative component at 1233 cm–1.
The missing correlations between the experimental and predicted monomer VCD bands are found in the dimer VCD spectrum. Specifically, a pair of closely spaced bisignate bands at (−)1114/(+)1118 cm–1 in the experimental spectrum corresponds to those at (−)1122/(+)1130 cm–1 in the B3LYP/6-31G(d) predicted spectrum of the dimer. Also, the negative experimental band at 1173 cm–1 is correlated to the B3LYP/6-31G(d) predicted negative band for the dimer at 1177 cm–1. It should be noted that the noise associated with the experimental VCD band at 1173 cm–1 makes the intensity associated with this band less certain. The phosphorus–oxygen bond stretching and amine group bending modes are the predominant sources for these bands. Overall, the mixture of monomer and dimer theoretical spectra gives a satisfactory correlation with all of the major experimental VCD bands, which leads to the conclusions that both monomer and dimer species are present at the concentration used and the absolute configuration of 1 is either (−)-(R) or (+)-(S). The ECD spectra calculated for (R)-1a with the 6-31G(d), 6-311G(2d,2p), and aug-cc-pVDZ basis sets are compared to the experimental ECD spectrum of (−)-1 in Figure 9.
Figure 9.

Predicted ECD spectrum for (R)-1 and experimental ECD spectra of (−)-1. The y-axis units are in liters per mol centimeter.
The experimental ECD spectrum exhibits a pronounced broad positive feature that changes to a negative feature near the cutoff wavelength of ∼200 nm. The positive broad experimental ECD feature is reproduced in all three predicted spectra, although at a longer wavelength than that seen in the experimental spectrum; the negative experimental ECD feature at ∼200 cm–1 is also reproduced in all three predicted ECD spectra, as can be seen in Figure 9. The correlation of the dominating positive ECD feature at a longer wavelength changing to a negative ECD feature at a shorter wavelength confirms the (−)-(R)-1 assignment derived from VCD data.
The ECD spectra measured for (−)-1 in the CHCl3 solvent shows three weak positive bands with distinct maxima at 270, 264, and 257 nm, while the calculation with the aug-cc-pVDZ basis set indicates the longest wavelength transitions at 247 and 240 nm (Figure S1). It is well-known18,19a that the bands characteristic of the vibrational fine structure are associated with the π → π* electronic transition of phenyl chromophore, which is forbidden18,19a,20,21 but appears due to vibronic borrowing.19a,22b Such bands cannot be seen in the predicted spectra unless vibrational coupling is included in the theoretical predictions of the ECD. In this context, latest developments in vibronic calculations, and interpretations, can be consulted.23
The comparison of the experimental and predicted specific rotations is another approach for assessing the absolute configuration. While such comparisons at a single wavelength can lead to misleading conclusions, the comparison of wavelength-dependent specific rotations, and the shape of the ORD, provides a more reliable approach.24,25 An independent verification of the configurational assignment of 1 can be obtained from the ORD data (Figure 10).
Figure 10.

Comparison of the ORD predicted for (R)-1 with experimental data of (−)-1. The specific rotations are in units of degree cubic centimeters per gram decimeters.
There is a satisfactory agreement of the overall trends between the experimental data for (−)-1 and the predicted data for (R)-1 via the 6-31G(d) and 6-311G(2d,2p) basis sets. The agreement in signs of the specific rotation supports the absolute configuration assigned for 1 from VCD and ECD data. Unlike the 6-31G(d) and 6-311G(2d,2p) basis set results where absolute magnitudes of the calculated specific rotations increase with the decreasing wavelength, the aug-cc-pVDZ basis set results show a change in its sign from negative to positive as the wavelength decreases, which can result from two or more ECD bands of opposite signs at wavelengths below 200 nm.26 Then, some short wavelength transitions below 200 nm may have incorrect signs or relative ECD magnitudes predicted at the aug-cc-pVDZ level.
As mentioned previously, conformer 2 is ∼3 kcal mol–1 higher in energy than conformer 1 and therefore will not contribute to the predicted spectra. Nevertheless, we performed VCD calculations for conformer 2 as well using the 6-31G(d) and aug-cc-pVDZ basis sets. VCD bands of conformer 2 have the same signs as those seen for conformer 1 except for weak bands in the 1400–1600 cm–1 region (Figures S2 and S3) where there are no corresponding bands in the experimental spectrum. In the case of ECD and ORD, however, conformer 2 yields opposite signs (Figure S4) to those of conformer 1.
Crystal and Molecular Structures of the Complex of Enantiopure Laevorotatory tert-Butylphenylphosphinoamidate 1 and (+)-R-2,2′-Dihydroxy-1,1′-binaphthol
In view of the requirements to be met as far as the correctness of the configuration assignments done by experimental and theoretical spectroscopic techniques is concerned, we decided to solve the problem using an independent method that is unquestionable, i.e., X-ray analysis of the complex of enantiopure laevorotatory tert-butylphenylphosphinoamidate 1 and (+)-R-2,2′-dihydroxy-1,1′-binaphthol [(+)-(R)-BINOL].
The complex, with a 1:1 stoichiometry, formed when equimolar amounts of racemic 1 and (+)-(R) -BINOL were dissolved in ether, and the solution was kept for ca. 24 h. The crystalline complex, [α]589 = −23.7 (c = 1.16, CH2 Cl2)], precipitated and was filtered off. It turned out that a single diastereoisomeric complex was isolated, as evidenced by the 1H NMR (one doublet for the t-Bu-P protons) and 31P NMR (singlet) spectra. The X-ray crystal structure determination, which was carried out on a single crystal of this diasteroisomeric complex by anomalous dispersion, unequivocally revealed that the asymmetric unit of the complex contains a single tert-butylphenylphosphinoamidate and one (+)-R-2,2′-dihydroxy-1,1′-binaphthol (Figure 11). The absolute configuration at the stereogenic phosphorus atom is R, as confirmed by the value x = −0.02(5) of the Flack parameter (Table 2).
Figure 11.

The asymmetric unit of the complex, which is composed from single moieties of tert-butylphenylphosphinoamide and (+)-R-2,2′-dihydroxy-1,1′-binaphthol. The ellipsoids of the thermal vibrations are drawn with 50% probability.
Table 2. Crystal Data and Experimental Information for the tert-Butylphenylphosphinoamidate 1 and (+)-R-2,2′-Dihydroxy-1,1′-bi-naphthol Complex.
| crystal data | |
|---|---|
| C20H14O2, C10H16NOP | Z = 2 |
| Mr = 483.52 | Dx = 1.253 Mg m–3 |
| Monoclinic, P21 | Mo Kα radiation |
| a = 12.085 (2) Å | cell parameters from 13111 reflections |
| b = 7.2789 (15) Å | θ = 1.7–27.8° |
| c = 14.672 (3) Å | μ = 0.14 mm–1 |
| β = 96.83 (3)° | T = 296 (2) K |
| V = 1281.5 (4) Å3 | plate, colorless |
| data collection | |
|---|---|
| KUMA KM4CCD diffractometer | 4652 reflections with I > 2σ(I) |
| ω scans | Rint = 0.011 |
| absorption correction: none | θmax = 26.0° |
| Tmin = 0.947, Tmax = 0.973 | h = −14 → 14 |
| 16269 measured reflections | k = −8 → 8 |
| 4913 independent reflections | l = −18 → 18 |
| refinement | |
|---|---|
| refinement on F2 | calculated weights w = 1/[σ2(Fo2) + (0.0438P)2 + 0.0736P] where P = (Fo2 + 2Fc2)/3 |
| R[F2 > 2σ(F2)] = 0.024 | (Δ/σ)max < 0.0001 |
| wR(F2) = 0.067 | Δρmax = 0.18 e Å–1 |
| S = 1.05 | Δρmin = −0.15 e Å–1 |
| 4913 reflections | extinction correction: SHELXL44 |
| 384 parameters | extinction coefficient: 0.0183 (18) |
| mixture of independent and constrained H atom refinement | Flack parameter x = −0.02(5)45 |
| computer programs |
|---|
| data collection: CrysAlis CCD (Oxford Diffraction, 2007)46 |
| cell refinement: CrysAlis RED (Oxford Diffraction, 2007)47 |
| data reduction: CrysAlis RED (Oxford Diffraction, 2007)47 |
| program used to solve the structure: SHELXS-97 (Sheldrick, 1997)44 |
| program used to refine the structure: SHELXL-97 (Sheldrick, 1997)44 |
| molecular graphics: ORTEP-348 and Platon (Spek, 2003)49 |
| software used to prepare the material for publication: Platon (Spek, 2003)49 |
The optically active (−)-1, [α]589 = −11.23 (c = 0.82, CHCl3), was liberated from this complex by column chromatography on silica gel using methanol as the eluent. This means that the laevorotatory enantiomer of tert-butylphenylphosphinoamidate 1 has the R absolute configuration at the stereogenic phosphorus atom. The packing of the molecules in the monoclinic (Z = 2) unit cell is shown in Figure 12.
Figure 12.
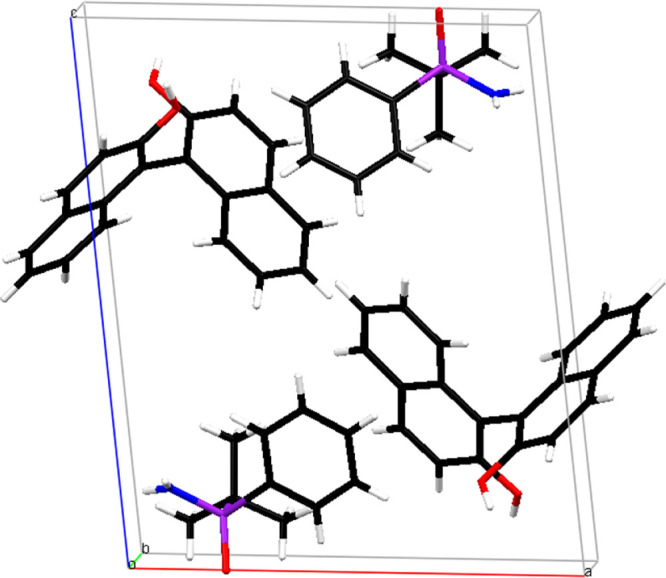
Molecular packing of the complex in the unit cell.
The methyl carbon atoms C2, C3, and C4 of the tert-butyl group adopt the following conformations in respect to the oxygen O1 atom: -ap (φ = −175.83(11)°), +sc (φ = 63.92(12)°), and −sc (φ = −54.52(13)°), respectively. In respect to the nitrogen N1 atom, these groups have the following positions: +sc (φ = 57.13(14)°), −sc (φ = −63.11(13)°), and +ap (φ = 178.44(11)°), respectively. The conformations of the phenyl carbon C11 in respect to the methyl carbons C2, C3, and C4 are −sc (φ = −54.44(14)°), −ap (φ = −174.69(11)°), and +sc (φ = 66.87(12)°), respectively.
The Newman projection of the substituents of the phosphorus P1 and carbon C1 atoms along the P1–C1 bond shows a slightly deformed alternate conformation (Figure 13). The environment of the chiral phosphorus P1 atom shows a distorted tetrahedral geometry, and the largest deviations from the ideal value (of 109.5°) are observed at the following angles: N1–P1–C11, 104.74(7)°; N1–P1–C1, 105.62(8); and O1–P1–N1, 116.21(7)°. These deformations are due to the presence of: (1) a system of intramolecular hydrogen contacts in which the N1 and O1 atoms are acceptors and (2) repulsive forces of the nonbonded electron pairs of these atoms. The tert-butyl substituent shows almost no distortion of its geometry toward the position of the methyl substituents with the tetrahedral sp3 hybridization of carbon C1. The values of the valence angles oscillate between 107.92(11)° and 110.43(12)°.
Figure 13.

Newman projection along the C1(front)–P1(back) bond, showing the conformation of the substituents of both C1 and P1 atoms in the tert-butylphenylphosphino amide moiety.
In the (+)-R-2,2′-dihydroxy-1,1′-binaphthol moiety, the dihedral angle between the naphthalene rings is 78.45(4)°. Both hydroxyl substituents are located equatorially to the respective rings. The angles between the O2–C21 and O3–C31 bonds and least-squares ring planes C21–C22–C23–C28–C29–C30 and C31–C32–C33–C38–C39–C40 are 2.47° and 0.60°, respectively. The length of the P1=O1 bond is 1.499(1) Å, which is longer than the typical P=O value of 1.489 Å found in similar compounds,27 1.488 Å found in aminophosphoric acids,28 and 1.487 Å found in triphenyl phosphinoxide (C6H5)3P=O.29 Such an elongation of the P=O bond could speak for the polarization effect of the double P=O bond whose length becomes intermediate between the double P=O and single P+–O– bonds. However, the lengths observed for the single endocyclic P–O bonds in dioxaphosphorinane rings of bis(5,5-dimethyl-2-thioxo-dioxaphosphorinan-2-y1) disulfide and diselenide are significantly longer. Their average length is 1.579 Å.30
The length of the P1–N1 bond is 1.6302(14) Å, which is shorter than the value of 1.77 Å31 typical for the single bond but longer than the typical value (1.6 Å) in cyclicphosphazens.32 This suggests the multiple character of this type of bond, which is inconsistent with the amino character of the nitrogen atom. The valence angles of the N1 atom indicate a planar position of this nitrogen atom and have values of P1–N1–H1A, 115.5(14)°; P1–N1–H1B, 118.3(16)°; and H1A–N1-H1B, 123(2)° with a sum value of 356.8°. However, as suggested by Balakrishna,33 the planar environment of the substituents of the nitrogen atom indicates that the central phosphorus P1 atom absorbed the major part of the electron density of the free electron pair at the N atom. An extra indication of that phenomenon could be the presence of the electronegative oxygen atom as a substituent of the phosphorus atom.34
The molecular structure of both tert-butylphenylphosphinoamidate and (+)-R-2,2′-dihydroxy-1,1′-binaphthol moieties in the molecule of the complex is stabilized by the presence of short contacts C–H···O and C–H···N (Figure S5). These contacts could be considered weak hydrogen bonds.35 For details, see Table S5.
Based on the theoretical aspects of the geometry of molecular contacts, the C–H···π-type contacts directed toward the center of the C–C bond in the naphthyl ring and the phenyl group were identified.36 The geometries of these contacts, directed toward the center of the aromatic ring (Cg) that serves as a bond acceptor, are provided in detail in Table S6. The stability of the molecular packing in the crystal lattice was also supported by the presence of the strong hydrogen bonds O–H···O and N–H···O and by numerous intermolecular weak hydrogen C–H···O bonds. The system of the intermolecular contacts is depicted in Figure S6 and Table S5.
The crystal lattice is formed by the chains created by both the O2–H2···O1 and O3–H3···O1 bonds of the alternately located moieties of tert-butylphenylphosphinoamidate and (+)-R-2,2′-dihydroxy-1,1′-binaphthol. These chains extend through the entire crystal lattice along the b-axis (Figure S7). This motif could be described by the symbol C21(9) with the ab bond sequence.37 These chains are additionally stabilized by the C4–H4B···O3 and C40–H40···O2 contacts shown in Figure S8. Except for the above, the weak contact C40–H40···O2 also creates the chain motif, which extends along b-axis connecting the 2,2′-dihydroxy-1,1′-binaphthol moieties and is described by the C(7) symbol.37
The above-mentioned chains (Figure S8), which all extend along the b-axis, are additionally connected along the a-axis by a system of the following four contacts with different strengths: hydrogen bonds C15–H15···O3 and N1–H1A···O2 and aromatic hydrogen bonds N1–H1B···Cg4 and C12–H12···Cg5 (Figure S9). Both hydrogen bonds C–H···O and N–H···O create the chain of positionally alternating molecules of the tert-butylphenylphosphinoamidate and (+)-R-2,2′-dihydroxy-1,1′-binaphthol. This chain could be described by the symbol C22(13) with the system ab of the bonds.37
The molecules of tert-butylphenylphosphinoamidate and (+)-R-2,2′-dihydroxy-1,1′-binaphthol also interact by the formation of an additional chain motif, which extends along the c-axis. This chain is formed by the contacts N1–H1A···O2, N1–H1B···Cg4, C12–H12···Cg5, O3–H3···O1, C35–H35···Cg4, and C35–H35···Cg5 (Figure S10). In the crystal lattice, numerous contacts between aromatic rings are also found.36 The geometry of these contacts is described in detail in Tables S5 and S6.
The above-mentioned chain motifs make the discussed complex (constituting an obvious analogue of BINOL) an interesting chiral auxiliary, which should be especially useful in asymmetric synthesis based on mechanochemical procedures that are still in their infancy.
Conclusions
The comparison between experimental and predicted data associated with VCD, ECD, and ORD have indicated that only one tautomeric structure and one conformation is predominant for tert-butylphenylphosphinoamidate. At the concentration used for the VCD measurements, both monomer and dimer forms are present in the solution. All three chiroptical methods suggest the assignment of the (R)-configuration to (−)-tert-butylphenylphosphinoamidate, and this assignment is supported by X-ray diffraction of the complex of enantiopure laevorotatory tert-butylphenylphosphinoamidate 1 and (+)-R-2,2′-dihydroxy-1,1′-binaphthol [(+)-(R)-BINOL]. Finally, X-ray analysis of this complex indicates the presence of chain motifs brought in by the interaction with nearby molecules and solid-state confinement, which should make the discussed complex (an obvious analogue of BINOL) an interesting chiral auxiliary.
Experimental Section
Synthesis
Optically active phosphinamide 1 (of uncertain enantiomeric excess) was obtained by the debenzylation of optically active N-benzyl tert-butylphenylphosphinoamidate, tert-BuPhP(O)NHCH2Ph, via hydrogenolysis over 10% Pd/C in an ethanol/acetic acid mixture.38 More recently, a similar removal of the benzyl group of N-benzyl tert-butylphenylphosphinoamidate, tert-BuPhP(O)NHCH2Ph, was achieved by hydrogenolysis under pressure (20 bar with 10% Pd/C) in ethanol.8 In the current work, however, we used an independent and patented procedure for the isolation of enantiomeric tert-butylphenylphosphinoamidate 1,39 which will be reported elsewhere.
General
NMR spectra were recorded at 200 MHz. Polarimetric measurements were done on a PerkinElmer 241 M photopolarimeter. The levorotatory enantiomer used in the present studies had [α]D = −12.0 (c = 2.06, CHCl3), mp 50–52 °C. The spectral data (1H and 31P NMR) were identical with those recorded for the racemic amide 1.
Measurements
For concentration-dependent VA spectra (Figure 2), five concentrations between 0.84–0.05 M in CHCl3 were used as well as a demountable cell with a 100 μm path length spacer. For VCD measurements, the VA and VCD spectra of (−)-1 and (±)-1 were obtained with 3 h of data collection at a 4 cm–1 resolution using a commercial Fourier transform VCD spectrometer, ChiralIR. These spectra were measured in CDCl3 at a concentration of ∼0.17 M with path lengths of 320 and 220 μm for both samples. The lower path length was used for optimizing the absorbance and VCD signals in the region between ∼1132 and 1248 cm–1. Measurable VCD bands are seen only in the region below ∼1250 cm–1. The samples were held in a variable path length cell with BaF2 windows. In the presented VA spectrum (Figure 7), the solvent VA was subtracted. In the presented VCD spectrum (Figure 8), the VCD spectrum of (±)-1 was subtracted from that of (−)-1 to establish the zero baseline. The noise level in the measured VCD spectrum was obtained as the difference between two halves of the data collected. For ECD spectra, one ECD spectrum was recorded for (−)-1 at ∼0.284 M in CHCl3 in the 240 to 490 nm region using a 0.01 cm path-length cell. Another ECD spectrum of (−)-1 was obtained at ∼0.027 M in hexane in the 200 to 280 nm region, again using a 0.01 cm path-length cell. Both ECD spectra were measured on a Jasco J720 spectrometer. For intrinsic rotations, solutions of (−)-1 in CHCl3 were prepared by successive dilutions from the parent stock solution. These concentration-dependent studies resulted in five data points, ranging in concentrations from 0.013 to 0.002 g mL–1. The intrinsic rotation, which represents the specific rotation at an infinite dilution, was extracted from the optical rotations at different concentrations as described before.40 These measurements were made at six wavelengths (633, 589, 546, 436, 405, and 365 nm, Figure 10) using an Autopol IV polarimeter to obtain the optical rotatory dispersion (ORD) curve.
Calculations
Geometry optimizations as well as the calculation of vibrational frequencies and VA and VCD intensities were undertaken with either the Gaussian 9841 or Gaussian 0342 program. The calculations used density functional theory (DFT) with the B3LYP hybrid functional and 6-31G(d), 6-311G(2d,2p), and aug-cc-pVDZ basis sets. The theoretical VA and VCD spectra were simulated with Lorentzian band shapes and a 5 cm–1 half width at half peak height. Since the predicted band positions are normally higher than the experimental band positions, the calculated monomer frequencies were scaled by a factor of 0.9613 for the 6-31G(d) basis set and 0.9678 for the 6-311G(2d,2p) basis set. This scaling was not used for the monomer frequencies predicted with the aug-cc-pVDZ basis set or the dimer frequencies. Mechanical anharmonicity can be one of the reasons for needing to use frequency scale factors, and anharmonic vibrational spectral calculations are now becoming widely practiced.43 However, since aug-cc-pVDZ predicted the monomer vibrational frequencies and 6-31G(d) predicted the dimer vibrational frequencies did not find a need for the frequency scale factor we did not pursue anharmonic vibrational spectral calculations. The specific rotation and ECD calculations for the isolated molecule were performed using Gaussian 03. The theoretical ECD spectra were simulated from the first 50 singlet → singlet electronic transitions using Gaussian band shapes and a 20 nm half width at 1/e of the peak height. The predicted ORD curves were generated from specific rotations calculated at six different wavelengths.
Crystallographic Data for the Complex of Enantiopure Laevorotatory tert-Butylphenylphosphinoamidate 1 and (+)-R-2,2′-Dihydroxy-1,1′-binaphthol
The complex of enantiopure laevorotatory tert-butylphenylphosphinoamidate 1 and (+)-R-2,2′-dihydroxy-1,1′-binaphthol (BINOL) (with a 1:1 stoichiometry) crystallizes in the monoclinic system in space group P21 (Table 2).
Crystal data: a = 12.085(2) Å, b = 7.2789(15) Å, c = 14.672(3) Å, β = 96.83(3)°, V = 1281.5(4) Å3, Mr = 483.52, Z = 2, dcalc = 1.253 g cm–3, μ = 0.14 mm–1, T = 296(2) K, F(000) = 512. Data collection: plate, colorless, Kuma KM4-CCD diffractometer, Mo Kα radiation, CrysAlis CCD,46 and CrysAlis RED.47 Measured reflections: 16269 (θmax = 27.8°), 4913 independent (Rint = 0.011). Structure solution: direct methods, anisotropic refinement on F2 (SHELXL-97)44 for all non-H atoms, hydrogen atoms attached to C atoms were refined using a riding model. The structure was refined using 4913 I > 2σ(I) reflections and 384 parameters. The absolute structure was determined by the Flack method with parameter x = −0.02(5).45 For all data, the final wR2 was 0.067, R1 = 0.024, S = 1.050, max Δρ = 0.180 eÅ–3, and the extinction coefficient was 0.018(2).44 The structure is deposited in the Cambridge Crystallographic Data Centre, CCDC 264651.
Acknowledgments
Financial support from National Science Foundation (no. CHE1464874 for P.L.P.) is gratefully acknowledged. This work was conducted in part using the resources of the Advanced Computing Center for Research and Education (ACCRE) at Vanderbilt University. Part of studies devoted to the use of different chiroptical spectroscopic methods described in this manuscript was taken from the Ph.D. thesis of Ana G. Petrović.50
Supporting Information Available
The Supporting Information is available free of charge at https://pubs.acs.org/doi/10.1021/acs.joc.0c00756.
The authors declare no competing financial interest.
Supplementary Material
References
- a Wang F.; Polavarapu P. L.; Drabowicz J.; Mikołajczyk M. Absolute configurations, predominant conformations and tautomeric structures of enantiomeric tert-butylphenylphosphine oxides. J. Org. Chem. 2000, 65, 7561–7565. 10.1021/jo000923c. [DOI] [PubMed] [Google Scholar]; b Wang F.; Polavarapu P. L.; Drabowicz J.; Mikołajczyk M.; Łyżwa P. Absolute configurations, predominant conformations, and tautomeric structures of enantiomeric tert-butylphenylphosphinothioic acid. J. Org. Chem. 2001, 66, 9015–9019. 10.1021/jo0107406. [DOI] [PubMed] [Google Scholar]; c Wang F.; Wang Y.; Polavarapu P. L.; Li T.; Drabowicz J.; Pietrusiewicz M. K.; Zygo K. Absolute configuration of tert -butyl-1-(2-methylnaphthyl)phosphine oxide. J. Org. Chem. 2002, 67, 6539–6541. 10.1021/jo025908h. [DOI] [PubMed] [Google Scholar]
- Nudelman A.; Cram D. J. The stereochemical course of ester-amide interchange leading to optically active phosphinic and sulfinic amides. J. Am. Chem. Soc. 1968, 90, 3869–3870. 10.1021/ja01016a053. [DOI] [Google Scholar]
- a Gamble M. P.; Studley J. R.; Wills M. New chiral phosphinamide catalysts for highly enantioselective reduction of ketones. Tetrahedron Lett. 1996, 37, 2853–2856. 10.1016/0040-4039(96)00404-2. [DOI] [Google Scholar]; b Burns B.; Gamble M. P.; Simm A. R. C.; Studley J. R.; Alcock N. W.; Wills M. Phosphinamides catalysts containing a stereogenic phosphorus atom for the asymmetric reduction of ketones by borane. Tetrahedron: Asymmetry 1997, 8, 73–78. 10.1016/S0957-4166(96)00482-X. [DOI] [Google Scholar]
- a Li K.; Zhou Z.; Wang L.; Zhou O.; Tang C. Synthesis of several chiral phosphinamides and their application in the asymmetric borane reduction of prochiral ketones. Main Group Met. Chem. 2002, 25, 663–667. 10.1515/MGMC.2002.25.11.663. [DOI] [Google Scholar]; b Li K.; Zhou Z.; Wang L.; Chen O.; Zhao G.; Zhou Q.; Tang C. Asymmetric carbonyl reduction with borane catalyzed by chiral phosphinamides derived from l-amino acid. Tetrahedron: Asymmetry 2003, 14, 95–100. 10.1016/S0957-4166(02)00789-9. [DOI] [Google Scholar]
- Harger M. J. P. Nuclear magnetic resonance non-equivalence of the enantiomers in optically active samples of phosphinic amides. J. Chem. Soc., Chem. Commun. 1976, 555–556. 10.1039/c39760000555. [DOI] [Google Scholar]
- Jankins T. C.; Qin Z.-Y.; Engle K. M. A practical method for N-alkylation of phosphinic (thio)amides with alcohols via transfer hydrogenation. Tetrahedron 2019, 75, 3272–3281. 10.1016/j.tet.2019.04.029. [DOI] [PMC free article] [PubMed] [Google Scholar]; and references cited herein
- Yuan M.; Mbaezue I. I.; Zhou Z.; Topic F.; Tsantrizos Y. P-Chiral, N-phosphoryl sulfonamide Brønsted acids with an intramolecular hydrogen bond interaction that modulates organocatalysis. Org. Biomol. Chem. 2019, 17, 8690–8694. and references cited herein. 10.1039/C9OB01774G. [DOI] [PubMed] [Google Scholar]
- a Notar Francesco I.; Egloff C.; Wagner A.; Colobert F. Stereoselective addition of Grignard reagents to new P-chirogenic N-phosphinoylbenzaldimines: effect of the phosphorus substituents on the stereoselectivity. Eur. J. Org. Chem. 2011, 2011, 4037–4045. 10.1002/ejoc.201100380. [DOI] [Google Scholar]; b Francesco I. N.; Wagner A.; Colobert F. Stereoselective addition of Grignard reagents to new P-chirogenic N-phosphinoylimines. Chem. Commun. 2010, 46, 2139–2141. and references cited herein. 10.1039/b915781f. [DOI] [PubMed] [Google Scholar]
- Han Z. S.; Zhang L.; Xu Y.; Sieber J. D.; Marsini M. A.; Li Z.; Reeves J. T.; Fandrick K. R.; Patel N. D.; Desrosiers J.-N.; Qu B.; Chen A.; Rudzinski D. M.; Samankumara L. P.; Ma S.; Grinberg N.; Roschangar F.; Yee N. K.; Wang G.; Song J. J.; Senanayake C. H. Efficient asymmetric synthesis of structurally diverse P-stereogenic phosphinamides for catalyst design. Angew. Chem., Int. Ed. 2015, 54, 5474–5477. and references cited herein. 10.1002/anie.201500350. [DOI] [PubMed] [Google Scholar]
- Sørensen M. D.; Blæhr L. K.A.; Christensen M. K.; Høyer T.; Latini S.; Hjarnaa P.-J. V.; Bjorkling F. Cyclic phosphinamides and phosphonamides, novel series of potent matrix metalloproteinase inhibitors with antitumour activity. Bioorg. Med. Chem. 2003, 11, 5461–5484. 10.1016/j.bmc.2003.09.015. [DOI] [PubMed] [Google Scholar]
- Chan M. F.; Verner E. J.. Phosphoramidates, phosphinic amides and related compounds and the use thereof to modulate the activity of endothelin. US 5958905, 1999.
- Lin T.; Cai G.; Sartorelli A. C. Synthesis of bis(aziridinyl) phosphinic amide derivatives of thymidine as potential anticancer agents. Nucleosides Nucleotides 1988, 7, 403–408. 10.1080/07328318808068720. [DOI] [Google Scholar]
- a Chen J.; Wu C.; Kao D. New approach to IR study of monomer-dimer self-association: 2,2-dimethyl-3-ethyl-3-pentanol in tetrachloroethylene as an example. Spectrochim. Acta, Part A 2004, 60, 2287–2293. 10.1016/j.saa.2003.12.002. [DOI] [PubMed] [Google Scholar]; b Chen J.; Shirts R. B. Iterative determination of the NMR monomer shift and dimerization constant in a self-associating system. J. Phys. Chem. 1985, 89, 1643–1646. 10.1021/j100255a018. [DOI] [Google Scholar]; c Polavarapu P. L.; Covington C. L. Wavelength resolved specific optical rotations and homochiral equilibria. Phys. Chem. Chem. Phys. 2015, 17, 21630–21633. 10.1039/C5CP01834J. [DOI] [PubMed] [Google Scholar]; d Polavarapu P. L.Chrioptical Spectroscopy: Fundamentals and Applications; CRC Press, 2017; pp 198–201. [Google Scholar]
- PeakFit, ver. 4.11; Aspire Software International: Ashburn, VA.
- KaleidaGraph, ver. 3.09; Synergy Software: Reading, PA.
- Stawinski J.Handbook of Organophosphorus Chemistry; Engel R., Ed.; Marcel Dekker: New York, NY, 1992; p 377. [Google Scholar]
- Ghidinelli S.; Abbate S.; Koshoubu J.; Araki Y.; Wada T.; Longhi G. Solvent effects and aggregation phenomena studied by vibrational optical activity and molecular dynamics: the case of pantolactone. J. Phys. Chem. B 2020, 124, 4512–4526. 10.1021/acs.jpcb.0c01483. [DOI] [PMC free article] [PubMed] [Google Scholar]
- Smith H. E.Circular Dichroism of the Benzene Chromophore. In Circular Dichroism: Principles and Applications; Nakanishi K., Berova N., Woody R. W., Eds; VCH Publisher, Inc: New York, NY, 1994; pp 413–442. [Google Scholar]
- a Platt J. R. Classification of spectra of cata-condensed hydrocarbons. J. Chem. Phys. 1949, 17, 484–495. 10.1063/1.1747293. [DOI] [Google Scholar]; b Klevens H. B.; Platt J. R. Spectral resemblances of cata-condensed hydrocarbons. J. Chem. Phys. 1949, 17, 470–481. 10.1063/1.1747291. [DOI] [Google Scholar]
- Hamman S.; Michals D. R.; Pickard S. T.; Smith H. E. Effect of fluorine on the circular dichroism of the benzene chromophore [1]. J. Fluorine Chem. 1993, 62, 131–137. 10.1016/S0022-1139(00)80087-1. [DOI] [Google Scholar]
- Rang K.; Liao F.; Sandstrom J.; Wang S. Diastereomers of 3-(S)-(1-phenylethyl)-5-methyl- and −5-phenylrhodanine: Crystal structures, conformations, and circular dichroism spectra. Chirality 1997, 9, 568–577. 10.1002/(SICI)1520-636X(1997)9:5/6<568::AID-CHIR26>3.0.CO;2-L. [DOI] [Google Scholar]
- a Smith H. E.; Willis T. C. Optically active amines. XI. Optical rotatory dispersion and circular dichroism observations on alpha- and beta-phenylalkylamine hydrochlorides. J. Am. Chem. Soc. 1971, 93, 2282–2290. 10.1021/ja00738a030. [DOI] [Google Scholar]; b Smith H. E.; Fontana L. P. Optically active amines. 35. A sector rule for the circular dichroism of the benzene chromophore. J. Org. Chem. 1991, 56, 432–435. 10.1021/jo00001a081. [DOI] [Google Scholar]
- Barone V. The virtual multifrequency spectrometer: a new paradigm for spectroscopy. WIREs Comput. Mol. Sci. 2016, 6, 86–110. 10.1002/wcms.1238. [DOI] [PMC free article] [PubMed] [Google Scholar]
- Giorgio E.; Viglione R. G.; Zanasi R.; Rosini C. Ab initio calculation of optical rotatory dispersion (ORD) curves: a simple and reliable approach to the assignment of the molecular absolute configuration. J. Am. Chem. Soc. 2004, 126, 12968–12976. 10.1021/ja046875l. [DOI] [PubMed] [Google Scholar]
- Polavarapu P. L. Protocols for the analysis of theoretical optical rotations. Chirality 2006, 18, 348–356. 10.1002/chir.20265. [DOI] [PubMed] [Google Scholar]
- a Polavarapu P. L. Kramers-Kronig transformation for optical rotatory dispersion studies. J. Phys. Chem. A 2005, 109, 7013–7023. 10.1021/jp0524328. [DOI] [PubMed] [Google Scholar]; b Polavarapu P. L.; Petrovic A. G.; Zhang P. Kramers-Kronig transformation of experimental electronic circular dichroism: Application to the analysis of optical rotatory dispersion in dimethyl-L-tartrate. Chirality 2006, 18, 723–732. 10.1002/chir.20310. [DOI] [PubMed] [Google Scholar]
- Allen F. H.; Kennard O.; Watson D. G.; Brammer L.; Orpen A. G.; Taylor R. Tables of bond lengths determined by X-ray and neutron diffraction. Part 1. Bond Lengths in Organic Compounds. J. Chem. Soc., Perkin Trans. 2 1987, S1–S19. 10.1039/p298700000s1. [DOI] [Google Scholar]
- Saint-Clair J.-F.; Siméon F.; Villemin D.; Averbuch-Pouchot M.-T. 2-Hydroxy-5-methyl-2-oxo-6-phenyl-4-phosphonomethyl-1,4,2-oxazoniaphosphorinane. Acta Crystallogr., Sect. C: Cryst. Struct. Commun. 1999, C55, 588–590. 10.1107/S0108270198016643. [DOI] [Google Scholar]
- Thomas J. A.; Hamor T. A. Structure of orthorhombic triphenylphosphine oxide: a redetermination at room temperature. Acta Crystallogr., Sect. C: Cryst. Struct. Commun. 1993, C49, 355–357. 10.1107/S0108270192006176. [DOI] [Google Scholar]
- Potrzebowski M. J.; Grossmann G.; Błaszczyk J.; Wieczorek M. W.; Sieler J.; Knopik P.; Komber H. X-ray and solid state NMR studies of bis(5,5-dimethyl-2-thioxo-1,3,2-dioxaphosphorinan-2-yl) disulfide and diselenide. Inorg. Chem. 1994, 33, 4688–4695. 10.1021/ic00099a019. [DOI] [Google Scholar]
- Corbridge D. E. C.Phosphorus: An Outline of its Chemistry, Biochemistry and Uses; Elsevier: Amsterdam, The Netherlands, 1995. [Google Scholar]
- Corbridge D. E. C.Topics in Phosphorus Chemistry, Vol. 3; Wiley-Interscience: New York, NY, 1966; p 323. [Google Scholar]
- Balakrishna M. S.; Klein R.; Uhlenbrock S.; Pinkerton A. A.; Cavell R. G. Heterodifunctional ligands derived from monooxidized bis(phosphino)amines. Synthesis and transition metal (molybdenum(0), tungsten(0), rhodium(I), palladium(II), and platinum(II)) complexes of (diphenylphosphino) (diphenylphosphinothioy1)- and (diphenylphosphino)(diphenylphosphinoselenoyl)phenylamine, Ph2PN(Ph)P(E)Ph2 (E = S,Se). Crystal and molecular structure of the Pt(II) complex [C12PtPPh2N(Ph)P(S)Ph2]·H2O. Inorg. Chem. 1993, 32, 5676–5681. 10.1021/ic00077a005. [DOI] [Google Scholar]
- Irisli S.; Sen A. N,N′-Bis(ethyldiphenylphosphino)ethylenediamine P,P′-dioxide. Acta Crystallogr., Sect. E: Struct. Rep. Online 2005, 61, o1939–o1941. 10.1107/S160053680501665X. [DOI] [Google Scholar]
- a Desiraju G. R.; Steiner T.. The Weak Hydrogen Bond in Structural Chemistry and Biology; Oxford University Press: Oxford, U.K., 1999. 10.1021/ja0047368;. [DOI] [Google Scholar]; b Bagheri S.; Masoodi H. R. The influence of CH···π interaction on coupling constants across N···H–F hydrogen bond in a substituted T-shaped configuration: a theoretical study. Mol. Phys. 2020, 118, e1580393. 10.1080/00268976.2019.1580393. [DOI] [Google Scholar]; c Li P.; Parker T. M.; Hwang J.; Deng F.; Smith M. D.; Pellechia P. J.; Sherrill C. D.; Shimizu K. D. The CH−π interactions of methyl ethers as a model for carbohydrate-N-heteroarene interactions. Org. Lett. 2014, 16, 5064–5067. 10.1021/ol502418k. [DOI] [PubMed] [Google Scholar]; d Nishio M.; Umezawa Y.; Fantini J.; Weiss M. S.; Chakrabarti P. CH−π hydrogen bonds in biological macromolecules. Phys. Chem. Chem. Phys. 2014, 16, 12648–12683. 10.1039/C4CP00099D. [DOI] [PubMed] [Google Scholar]; e Nishio M. The CH/π hydrogen bond in chemistry. Conformation, supramolecules, optical resolution and interactions involving carbohydrates. Phys. Chem. Chem. Phys. 2011, 13, 13873–13900. 10.1039/c1cp20404a. [DOI] [PubMed] [Google Scholar]; f Barwell N. P.; Davis A. P. Substituent effects in synthetic lectins - exploring the role of CH-π interactions in carbohydrate recognition. J. Org. Chem. 2011, 76, 6548–6557. 10.1021/jo200755z. [DOI] [PubMed] [Google Scholar]
- a Burley S. K.; Petsko G. A. Weakly polar interactions in proteins. Adv. Protein Chem. 1988, 39, 125–189. 10.1016/S0065-3233(08)60376-9. [DOI] [PubMed] [Google Scholar]; b Bhattacharyya R.; Samanta U.; Chakrabarti P. Aromatic-aromatic interactions in and around alpha-helices. Protein Eng., Des. Sel. 2002, 15, 91–100. 10.1093/protein/15.2.91. [DOI] [PubMed] [Google Scholar]
- a Bernstein J.; Davis R. E.; Shimoni L.; Chang N.-L. Patterns in hydrogen bonding: functionality and graph set analysis in crystals. Angew. Chem., Int. Ed. Engl. 1995, 34, 1555–1573. 10.1002/anie.199515551. [DOI] [Google Scholar]; b Etter M. C. Encoding and decoding hydrogen-bond patterns of organic compounds. Acc. Chem. Res. 1990, 23, 120–126. 10.1021/ar00172a005. [DOI] [Google Scholar]
- Lam W.-L.; Haynes R. K.; Yeung L.-L.; Chan W.-K. Preparation of bi- and tridentate doubly P-chiral diphosphine dioxide ligands for asymmetric catalysis. Tetrahedron Lett. 1996, 37, 4733–4736. 10.1016/0040-4039(96)00953-7. [DOI] [Google Scholar]
- a Drabowicz J.; Łopusiński A.; Krasowska D.; Polavarapu P. L. Manuscript in preparation.; b Drabowicz J.; Łopusiński A.; Krasowska D.. A process for the manufacture of optically active phosphinamide. EP 2639237 B1, 2016.
- Polavarapu P. L.; Petrovic A. G.; Wang F. Intrinsic rotation and molecular structure. Chirality 2003, 15, s143–s149. 10.1002/chir.10255. [DOI] [PubMed] [Google Scholar]
- Frisch M. J.; Trucks G. W.; Schlegel H. B.; Scuseria G. E.; Robb M. A.; Cheeseman J. R.; Zakrzewski V. G.; Montgomery J. A. Jr.; Stratmann R.; Burant J. C.; Dapprich S.; Millam J. M.; Daniels A. D.; Kudin K. N.; Strain M. C.; Farkas O.; Tomasi J.; Barone V.; Cossi M.; Cammi R.; Mennucci B.; Pomelli C.; Adamo C.; Clifford S.; Ochterski J.; Petersson G. A.; Ayala P. Y.; Cui Q.; Morokuma K.; Malick D. K.; Rabuck A. D.; Raghavachari K.; Foresman J. B.; Cioslowski J.; Ortiz J. V.; Stefanov B. B.; Liu G.; Liashenko A.; Piskorz P.; Komaromi I.; Gomperts R.; Martin R. L.; Fox D. J.; Keith T.; Al-Laham M. A.; Peng C. Y.; Nanayakkara A.; Gonzalez C.; Challacombe M.; Gill P. M. W.; Johnson B.; Chen W.; Wong M. W.; Andres J. L.; Gonzalez C.; Head-Gordon M.; Replogle E. S.; Pople J. A.. Gaussian 98; Gaussian, Inc.: Pittsburgh, PA, 1998. [Google Scholar]
- Frisch M. J.; Trucks G. W.; Schlegel H. B.; Scuseria G. E.; Robb M. A.; Cheeseman J. R.; Montgomery J. A. Jr.; Vreven T.; Kudin K. N.; Burant J. C.; Millam J. M.; Iyengar S. S.; Tomasi J.; Barone V.; Mennucci B.; Cossi M.; Scalmani G.; Rega G.; Petersson G. A.; Nakatsuji H.; Hada M.; Ehara M.; Toyota K.; Fukuda R.; Hasegawa J.; Ishida M.; Nakajima T.; Honda Y.; Kitao O.; Nakai H.; Klene M.; Li X.; Knox J. E.; Hratchian H. P.; Cross J. B.; Adamo C.; Jaramillo J.; Gomperts R.; Stratmann R. E.; Yazyev O.; Austin A. J.; Cammi R.; Pomelli C.; Ochterski J. W.; Ayala P. Y.; Morokuma K.; Voth G. A.; Salvador P.; Dannenberg J. J.; Zakrzewski V. G.; Dapprich S.; Daniels A. D.; Strain M. C.; Farkas O.; Malick D. K.; Rabuck A. D.; Raghavachari K.; Foresman J. B.; Ortiz J. V.; Cui Q.; Baboul A. G.; Clifford S.; Cioslowski J.; Stefanov B. B.; Liu G.; Liashenko A.; Piskorz P.; Komaromi I.; Martin R. L.; Fox D. J.; Keith T.; Al-Laham M. A.; Peng C. Y.; Nanayakkara A.; Challacombe M.; Gill P. M. W.; Johnson B.; Chen W.; Wong M. W.; Gonzalez C.; Pople J. A.. Gaussian 03; Gaussian, Inc: Wallingford, CT, 2004.
- Bloino J.; Biczysko M.; Barone V. Anharmonic effects on vibrational spectra intensities: infrared, Raman, Vibrational Circular Dichroism, and Raman optical activity. J. Phys. Chem. A 2015, 119, 11862–11874. 10.1021/acs.jpca.5b10067. [DOI] [PMC free article] [PubMed] [Google Scholar]
- a Sheldrick G. M. A short history of SHELX. Acta Crystallogr., Sect. A: Found. Crystallogr. 2008, A64, 112–122. 10.1107/S0108767307043930. [DOI] [PubMed] [Google Scholar]; b Sheldrick G. M. Crystal structure refinement with SHELXL. Acta Crystallogr., Sect. C: Struct. Chem. 2015, C71, 3–8. 10.1107/S2053229614024218. [DOI] [PMC free article] [PubMed] [Google Scholar]
- a Flack H. D. On enantiomorph-polarity estimation. Acta Crystallogr., Sect. A: Found. Crystallogr. 1983, A39, 876–881. 10.1107/S0108767383001762. [DOI] [Google Scholar]; b Flack H. D.; Bernardinelli G. Absolute structure and absolute configuration. Acta Crystallogr., Sect. A: Found. Crystallogr. 1999, A55, 908–915. 10.1107/S0108767399004262. [DOI] [PubMed] [Google Scholar]
- KM4CCD CrysAlis CCD, Data Collection Program, ver. 1.163; Unilic & Kuma Diffraction Instruments, 2000.
- KM4CCD CrysAlis RED, Data Reduction Program, ver. 1.163; Unilic & Kuma Diffraction Instruments, 2000.
- Farrugia L. J. WinGX and ORTEP for Windows: an update. J. Appl. Crystallogr. 2012, 45, 849–854. 10.1107/S0021889812029111. [DOI] [Google Scholar]
- Spek A. L. CheckCIF validation ALERTS: what they mean and how to respond. Acta Crystallogr. 2020, 76, 1–11. 10.1107/S2056989019016244. [DOI] [PMC free article] [PubMed] [Google Scholar]
- Petrović A. G.Chiroptical Spectroscopic Structural Determination of Organic, Inorganic and Biomolecules. Ph.D. Dissertation, Vanderbilt University, Nashville, TN, 2007. [Google Scholar]
Associated Data
This section collects any data citations, data availability statements, or supplementary materials included in this article.