

Abstract
Improved methods are needed to assess the structure and activity of lesions on root surfaces in order to improve clinical decision making. Conventional visual and tactile methods for assessing lesion activity are not reliable, and the clinician is often unable to evaluate if the lesion is progressing or has remineralized. An important marker of an arrested lesion is a highly mineralized surface zone that forms when mineral is deposited in the outer layer of the lesion. In vitro studies have shown that a mineralized surface zone influences the kinetics of water evaporation and the surface temperature while drying. Temperature changes can be monitored by measuring the thermal emission with thermal imaging. Studies have also shown that the depth and severity of demineralization and the thickness of the highly mineralized transparent surface zone on arrested lesions can be measured nondestructively with optical coherence tomography (OCT). Thermal imaging at 8-µm to 13-µm wavelengths was completed on 30 test subjects with a suspected active root caries lesion by monitoring thermal emission from the tooth surfaces during 30 s of air drying. Lesions were also evaluated using cross-polarization OCT (CP-OCT) during lesion dehydration to identify transparent surface zones indicative of arrested lesions and determine if shrinkage occurred during drying. The overall thermal emission recorded during drying was significantly different (P < 0.001) when comparing sound tooth surfaces, lesion areas identified as arrested, and lesion areas identified as active, demonstrating that thermal imaging is a promising approach for the clinical assessment of lesion activity on root surfaces. Ten of the lesions in this study had distinct areas with transparent surface zones that were visible in CP-OCT images. Shrinkage was detected with CP-OCT during drying for 12 lesions. This study confirms that these novel approaches for assessing lesion activity on root surfaces can be implemented in vivo.
Keywords: caries diagnosis, optical coherence tomography, lesion activity, lesion shrinkage, active lesions, arrested lesions
Introduction
Root caries remains a clinical concern in the elderly, partially due to improved tooth retention (Dye et al. 2007, 2015). Clinical diagnosis of root caries is highly subjective and is based on visual and tactile parameters. In contrast to coronal caries, root caries lacks a valid diagnostic standard, such as radiography (Banting 2001). Investigators have not developed a reliable relationship between root caries appearance and activity (Hellyer et al. 1990; Schaeken et al. 1991; Banting 1993). Most experts agree that active root lesions are soft, yet tactile hardness assessments remain subjective and lack reliability (Banting 1993). Multifactorial root caries scoring systems have been developed with mixed success (Fejerskov et al. 1991; Ekstrand et al. 2008). The International Caries Detection and Assessment System (ICDAS) coordinating committee proposed a system for assessing lesion activity (Ismail et al. 2005; Ekstrand et al. 2008). Criteria include color, texture (smooth, rough), appearance (shiny, dull), tactile (soft, leathery, hard), loss of anatomical contour, and proximity to the gingival margin (Lynch and Beighton 1994; Topping and Pitts 2009). Histological analyses for lesion assessment such as microradiography and polarized light microscopy require destruction of the tooth and are not suitable for use in vivo. Studies have demonstrated that cross-polarization optical coherence tomography (CP-OCT) can be used to quantify the loss of cementum and the severity of demineralization on root surfaces (Lee et al. 2009; Manesh et al. 2009a, 2009b). OCT can be used to discriminate between noncarious cervical lesions and root caries in vivo (Wada et al. 2015). Importantly, CP-OCT has been used to monitor the formation of a highly mineralized surface layer on demineralized dentin after exposure to a remineralization solution and measure the transparent surface zone thickness on arrested lesions (Manesh et al. 2009a, 2009b; Lee et al. 2016). The transparent surface zone also reduces the shrinkage that occurs during drying in active root lesions due to the collapse of the unsupported collagen matrix of the demineralized cementum and dentin with loss of water (Lee et al. 2009; Yang and Fried 2019b).
Thermal emission from tooth surfaces can be monitored with a thermal camera. Since the heat of vaporization of water is large, the evaporation of water from pores near a lesion surface induces a large drop in the lesion surface temperature, reducing the thermal emission from those surfaces. Water retention in dentin increases with demineralization (Ozok et al. 2002). Arrested lesions have mineral filling the pores at the lesion surface due to remineralization that inhibits water diffusion and permeability, resulting in less temperature change during drying. The optical changes associated with lesion dehydration have been investigated in vitro via thermal, fluorescence, and near-infrared (IR) imaging for lesions on enamel surfaces (Kaneko et al. 2000; Ando et al. 2012; Usenik et al. 2014). Only 1 in vivo study has been published, and it involved fluorescence loss measurements during dehydration (Ando et al. 2017). Kaneko et al. (2000) and Zakian et al. (2010) carried out thermal imaging studies to detect lesions on extracted teeth using a thermal camera. Lee, Staninec, et al. (2014) and Lee et al. (2015, 2016) demonstrated that thermal and near-IR imaging were highly effective in vitro for assessing the activity of lesions on enamel and root surfaces. Compact and inexpensive thermal cameras are now available for intraoral imaging.
In this study, teeth with suspected active root caries lesions were imaged with CP-OCT and thermal imaging to test the hypothesis that these technologies for assessing the activity of lesions can be implemented in vivo.
Materials and Methods
Participant Recruitment and Procedures
Thirty test subjects at the University of California, San Francisco (UCSF) comprehensive clinics were recruited for this study (UCSF-IRB 18-24558). The test subjects ranged in age from 18 to 90 y, and each had 1 root caries lesion that was diagnosed as active based on visual and tactile assessment by an experienced clinician using the ICDAS II root caries lesion activity criteria (Ismail et al. 2005). Clinical evaluation included probing with a dental explorer and color imaging with a cross-polarized USB camera (model AM7013MZT; AnMO Electronics Corp) equipped with a dental mirror.
CP-OCT
The CP-OCT system used for this study was the model IVS-3000-CP purchased from Santec. This system acquires only the cross-polarization image (CP-OCT), not simultaneous cross- and copolarization images (PS-OCT). This is a 3-dimensional (3D) system with a right-angle dental handpiece capable of acquiring complete tomographic images of a volume of 6 × 6 × 7 mm in approximately 3 s. This system has been used for multiple in vivo caries imaging studies (Nee et al. 2014; Chan et al. 2016; Simon et al. 2017). This system operates at a wavelength of 1,321 nm with a bandwidth of 111 nm with a measured resolution in air of 11.4 µm.
An appliance made of Dental-LT resin printed using a Formlabs 3D printer was attached to the OCT scanning handpiece (Yang and Fried 2019a). Air at 10 psi was connected to the probe to prevent fogging of the mirror and to facilitate dehydration of the lesion. Images were captured before and after drying and imported into MATLAB (MathWorks) for analysis. Entire (3D) CP-OCT cross-polarization images of each lesion were acquired before and after drying with air. In addition, continuous CP-OCT 2-dimensional (2D) images were recorded for 30 s during drying to assess shrinkage. In order to match the surface position and transparent surface zone thickness, image processing was applied to the images as described previously for in vitro studies (Lee, Kang, et al. 2014; Yang and Fried 2019b). For each, a 3D Gaussian filter was applied (sigma = 4), followed by 3D Canny edge detection at a low threshold to resolve the surface of the tooth with minimal surface breaks.
Thermal Imaging
Thermal images were captured using a FLIR Boson 640 thermal camera that employs an uncooled vanadium oxide microbolometer with a 12-µm pixel pitch, a 640 × 512 array, a thermal sensitivity of 50 mK, and a bit depth of 14 bits (Fig. 1). The spectral range is 7.5 to 13.5 µm. The size of the camera itself is only 21 × 11 × 11 mm. The camera was equipped with an integrated 24-mm focal length lens. An additional 100-mm focal length was attached to a handpiece that was 3D printed using autoclavable Dental-SG resin (Fig. 1). A 12.5-mm polished aluminum plane surface was attached at the distal end so the handpiece could be held in contact with the tooth surface at a right angle to minimize motion during dehydration. Thermal emission from the tooth surface at a distance of 8 cm from the second lens was focused onto the camera array. An air nozzle was attached to the handpiece to provide focused air to dry the lesion area at 5 to 10 psi. Raw images of the intensity were recorded at 4 Hz for 30 s using a program custom written with Labview from National Instruments and imported into MATLAB for further analysis. Lesions were wetted with a cotton swab before each measurement. Intensity profiles versus time were extracted from the mean intensity of a 5 × 5-pixel region of interest (ROI) manually selected and designated as sound, active, or arrested based on the presence of demineralization in the corresponding CP-OCT images with (arrested) or without (active) a transparent surface zone. Integration of the thermal profiles from 0 to 30 s yielded the change in heat or overall thermal emission, ΔQ (Yang et al. 2020). Note that in this study, a larger ΔQ represents a greater loss of heat during drying or less thermal emission. Statistical comparisons between ΔQ for sound and suspected active and arrested lesion areas were performed in GraphPad Prism (GraphPad Software).
Figure 1.
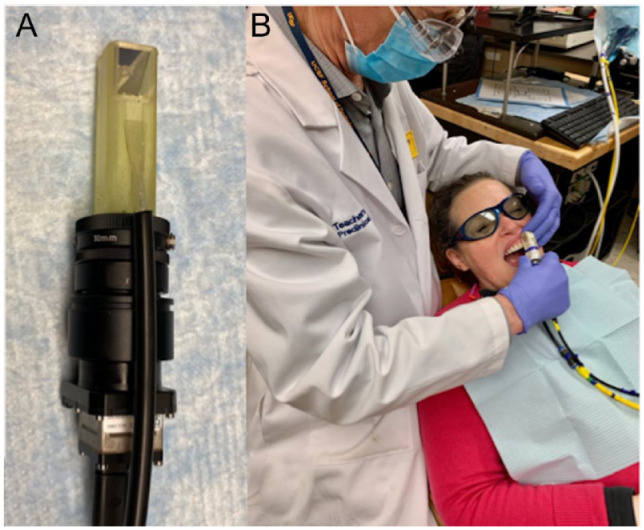
The thermal imaging handpiece (A) consists of a 3-dimensional printed autoclavable attachment with an air channel to focus air across the tooth surface and a right-angle aluminum mirror. This is attached to an additional lens and a small thermal camera. (B) A photo of the handpiece being used clinically.
Results
In this study, 30 root caries lesions were imaged. Data for 5 of the test subjects were discarded due to the inability to acquire suitable thermal images for analysis that included fogging of the sensor windows, equipment malfunction, or insufficient air pressure during the first 4 test subjects. After the first 4 test subjects, we determined that an air pressure of 5 psi was insufficient and that variations in humidity during breathing interfered with the measurements. Subsequently, we increased the air pressure to 10 psi, and the fluctuations due to breathing no longer interfered with the thermal images.
Color, thermal, and OCT images of a test subject lesion are shown in Figure 2. This is a shallow lesion that is brown, rough, and soft that is located just at the cementum-enamel junction (CEJ). This active lesion is of particular interest as one of the only samples that has a large area of sound-exposed root surface located below the lesion for comparison. Thermal images at different time intervals are shown in Figure 2B. After 1 s of drying, the area of exposed dentin and the lesion appear much darker than the enamel above the lesion. After 5 s, the cooler/darker area is localized to the lesion, and after 15 s, the temperature over most of the tooth surface has equilibrated. A plot of the thermal emission intensity from areas of sound enamel (E), active lesion (L), and sound dentin (D) after 30 s of drying is shown in Figure 2D. In areas of the lesion, the temperature drop is of a much greater magnitude and is of a longer duration than other areas of the tooth. A CP-OCT b-scan taken along the path of the black arrow with the position of the 3 colored markers indicated is shown in Figure 2C. The lesion appears as the brighter area (red circle) just below the position of the CEJ due to the higher reflectivity of the demineralized dentin. The position of the CEJ can be visualized by following the intersection of the tooth surface and the dentinal-enamel junction (DEJ), which is visible below the tooth surface. The OCT scan also shows that the cementum has been lost from the root surface and that a small section of enamel has broken off near the CEJ. No transparent surface zone indicative of an arrested lesion is visible on this lesion in the CP-OCT scan.
Figure 2.
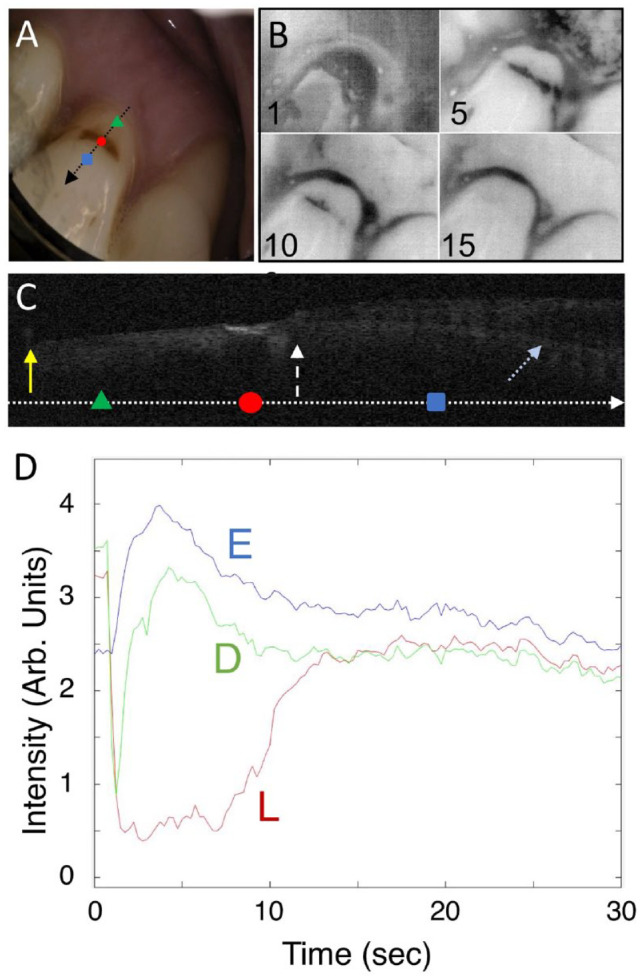
Visible, thermal, and cross-polarization optical coherence tomography (CP-OCT) images of a shallow active root lesion and a large area of exposed sound dentin. (A) Color image of the tooth; the black arrow shows the path of the CP-OCT image (C), and the colored markers show the respective positions of the thermal emission profiles (D), where the green triangle is in the area of sound-exposed dentin (D), the red circle is in the active lesion area (L), and the blue square is in sound enamel (E). Four thermal images extracted at 1-, 5-, 10-, and 15-s time intervals during drying are shown (B). Intensity increases from black to white in the grayscale false color images for both the CP-OCT and thermal images. A CP-OCT scan (C) was taken at the position of the arrow (A) with the position of the 3 markers on the arrow. The white dashed arrow points to the position of the cementum-enamel junction (CEJ), the yellow solid arrow the gingiva, and the light blue dotted arrow the dentinal-enamel junction (DEJ). The DEJ can be seen clearly in the image as the lower line beneath the surface on the right side of the image. Some of the enamel has broken off near the CEJ, and the cementum layer has been worn away. The lesion is visible as a bright region at the position of the red circle. The dimensions of the CP-OCT image are 2 mm depth (y-axis) and 6-mm lateral position (x-axis). The thermal emission from the tooth surface during drying is shown (D) for the 3 positions indicated (A).
Another lesion that has 2 distinct zones is shown in Figure 3. The upper zone closer to the enamel appears darker and rougher than the lower zone in the color image. The lower zone (R) appears to have a distinct surface zone in the CP-OCT image and appears less active in the thermal images. Extracted thermal images are shown in Figure 3B. The lower “remineralized” (R) zone shows intermediate behavior between the sound and more “active” (A) lesion area, and we suspect that this area is arrested. After 30 s of air drying, the most severe/active area of the lesion appears as a dark band centered on the upper zone of the root caries lesion. Thermal profiles shown in Figure 3D were taken at the 3 positions identified as sound (S), upper lesion (A), and lower lesion (R). Thermal emission is lower (darker) from the upper lesion area than from the lower lesion area, suggesting that it is more active. The cooler area (A) has not recovered after 30 s, indicating that more drying time would be needed to completely dehydrate this highly porous lesion area. The CP-OCT b-scan image shown in Figure 3C shows that there is no surface zone visible in the upper lesion area while the lower lesion area shows a distinct surface layer (orange dotted arrow) that is more than 100 µm thick. It appears that a large section of the overlying enamel has broken off and exposed the more active upper lesion area.
Figure 3.
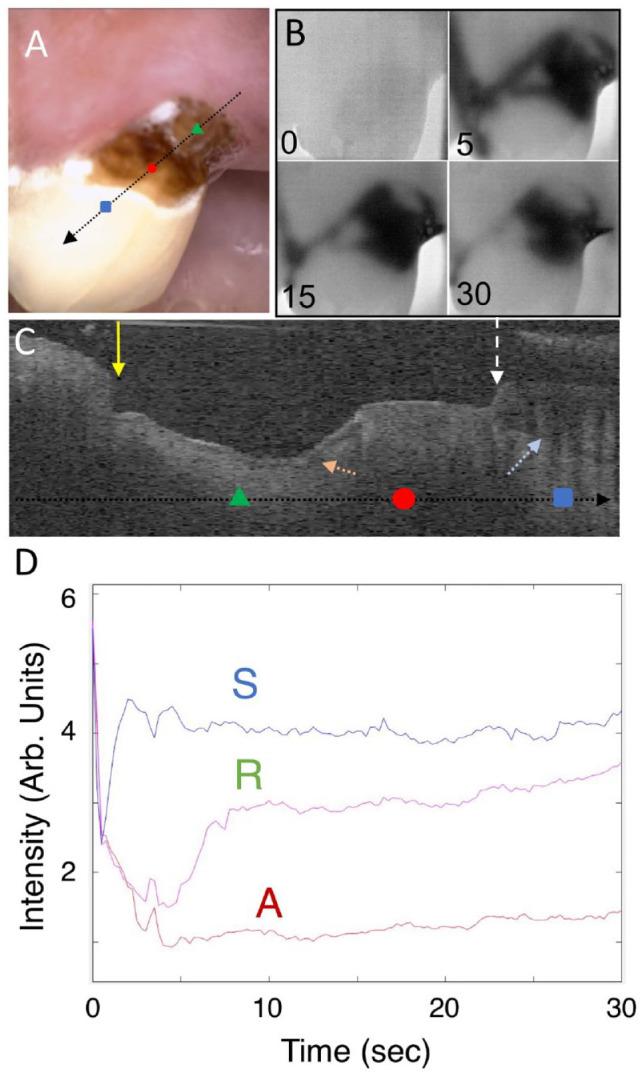
Visible, thermal, and cross-polarization optical coherence tomography (CP-OCT) images of a large root lesion with both active and arrested areas. The lower half of the lesion appears distinctly lighter and glossy in the visible image, and the CP-OCT image shows that a transparent surface zone is present on that part of the lesion, suggesting that it is arrested. (A) Color image of the tooth; the arrow shows the path of the CP-OCT image (C), and the colored markers show the respective positions of the thermal emission profiles (D), where the green triangle is in the arrested lesion area (R), the red circle is in the active lesion area (A), and the blue square is in a sound area (S). Four thermal images extracted at 0-, 5-, 15-, and 30-s time intervals during drying are shown (B). A CP-OCT scan is shown (C), taken at the position of the arrow (A), with the position of the 3 dots marked on the arrow. The white dashed arrow points to the position of the cementum-enamel junction (CEJ), the yellow solid arrow the gingiva, and the light blue dotted arrow the dentinal-enamel junction (DEJ). A large part of the enamel has broken off near the CEJ, and there is significant loss of cementum and dentin. A distinct surface zone is visible (orange dotted arrow) on the lower portion of the lesion. The dimensions of the CP-OCT image are 2 mm (axial depth in air) and 6 mm lateral position. The thermal emission from the tooth surface during drying is shown (D) for the 3 positions indicated (A).
Figure 4 shows an active lesion that has resulted in the collapse of the enamel near the CEJ and exposed a large area of the underlying dentin. There are 2 thermal images shown in Figure 4B; the image after 30 s of air drying shows a localized dark area over the right portion of the lesion where the dentin is exposed. The lesion penetrates well under the enamel above and to the left of the exposed dentin. This can be seen in the CP-OCT images of Figure 4C taken at the 2 positions indicated by the arrows in Figure 4A. In the first image, the lesion has penetrated through the intact enamel near the gingiva and is also visible under the sound enamel (red arrow) along the DEJ shown by the blue arrow. The deeper part of the lesion, where the enamel has collapsed, exposing the underlying dentin, appears active in the thermal image, and there is no surface zone visible in the OCT scan. However, in a different area of the lesion indicated by the orange arrow, there is a surface zone visible where the lesion has penetrated completely through the intact enamel. The areas of the lesion in the enamel with an intact surface zone and the areas of the lesion under the enamel are not as active in the thermal images since fluids are inhibited from diffusing to the surface.
Figure 4.
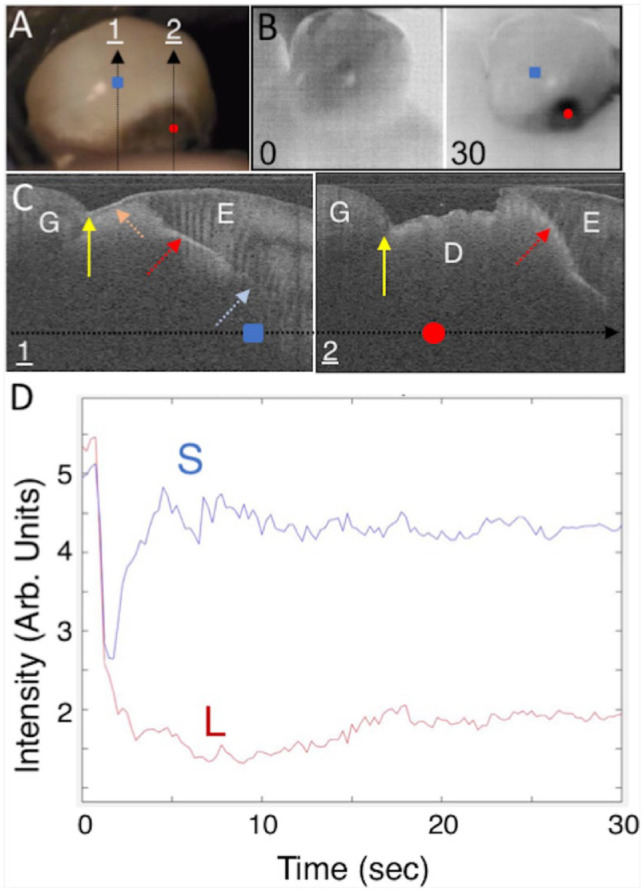
Visible, thermal, and cross-polarization optical coherence tomography (CP-OCT) images of a root lesion that has spread extensively under the adjoining enamel. (A) Color image of the tooth; the 2 arrows show the path of the CP-OCT images (C), and the colored markers show the respective positions of the thermal emission profiles (D), where the red circle is in the lesion area (L) and the blue square is in sound enamel (E). Two thermal images extracted at 0- and 30-s time intervals during drying are shown (B). Two CP-OCT scans labeled 1 and 2 are shown (C), taken at the position of the arrows (A) with the position of the 2 markers on the arrow. The white dashed arrow points to the position of the cementum-enamel junction (CEJ), the yellow solid arrow the gingiva (G), and the light blue arrow the dentinal-enamel junction (DEJ). In the first CP-OCT image, the enamel (E) is intact and none of the root surface is exposed, and the large and deep lesion extends under the enamel (red dotted arrow). A surface zone is present on the exposed lesion surface (orange dotted arrow). The second CP-OCT scan shows that the enamel has broken off and there is a large area of exposed demineralized dentin (D) and that the lesion has spread well into and under the adjacent enamel. The dimensions of the CP-OCT images are 3 mm depth (y-axis) and 6 mm lateral position (x-axis). The thermal emission from the tooth surface during drying is shown (D) for the 3 positions indicated (A).
Useful thermal images were acquired for 25 of the 30 lesions, and ΔQ was calculated for the most demineralized part of the lesion and an adjacent sound area. A comparison of ΔQ between sound tooth structure and active lesion areas using a paired t test for the 25 lesions showed a statistically significant difference, with a mean ± SD in relative intensity units of 4.8 ± 4.6 and 18.1 ± 5.7 (P < 0.0001). Ten of the lesions had areas with measurable surface zones in the CP-OCT images similar to the lesion shown in Figure 3, suggesting that those areas were arrested. Transparent surface zone thicknesses ranged from 62 to 140 µm, with a mean ± SD thickness of 98 ± 26 µm. ΔQ was calculated for the thermal profiles in those suspected arrested areas and compared with the sound and suspected active areas on those teeth. Repeated-measures analysis of variance indicated that the 3 groups were significantly different, with a mean ± SD of 5.9 ± 5.6, 13.0 ± 6.4, and 21.4 ± 5.9 for sound, arrested, and active lesion areas, respectively (P < 0.0001). The comparisons are shown graphically in Figure 5.
Figure 5.
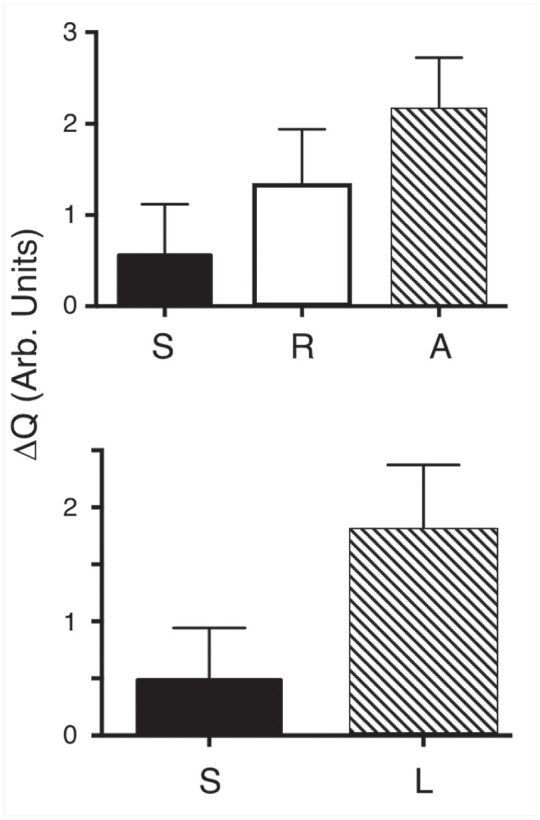
(Top) The mean ± SD of ΔQ for the n = 10 samples for regions that had sound (S), active (A), and arrested (R) lesion zones. All groups are significantly different, P < 0.001. (Bottom) The mean ± SD of ΔQ for lesion (L) and sound (S) areas for all 25 of the teeth that yielded acceptable thermal images. All groups are significantly different, P < 0.0001.
The exact surface positions of the CP-OCT scans could be coregistered before and after drying for only 12 of the lesions. The mean shrinkage was 61 ± 54 µm for those 12 samples. Surface zones were visible for 3 of those 12 lesions, suggesting they were arrested. The mean shrinkage for those lesions with surface zones (n = 3) was significantly less than the lesions without surface zones (n = 9), 7.7 ± 6.7 µm versus 78 ± 51 µm (P < 0.003).
All the lesions were classified as active lesions based on clinical assessment and the multiple ICDAS II lesion activity criteria. Thirteen of the lesions were colored brown, 16 black, and 1 gray; 28 were rough and 2 smooth; and 27 were scored soft and 3 leathery. Ten lesions in the study appeared to have both active and arrested areas (see Fig. 3) based on the CP-OCT and thermal data. The clinical assessment was for the lesion as a whole, and therefore it is not appropriate to compare the clinical assessments with the thermal and CP-OCT shrinkage data that are for specific areas of a lesion. Only 5 of the lesions had a clinical description that would indicate the possibility of an arrested lesion. None of the lesions were clinically designated as shiny or hard, and only 3 were designated as leathery and 2 as smooth. Out of the 10 lesions that had areas with surface zones, 1 appeared smooth and another was leathery.
Discussion
In this study, we used the presence of the highly mineralized transparent surface zone as our “benchmark” for an arrested lesion surface with the caveat that this is not a gold standard. Although the validity of this approach is supported by good agreement of histopathology and CP-OCT images for in vitro studies, transparent surface zones are not yet a gold standard to identify an arrested surface. Before the introduction of optical coherence tomography, a tooth had to be extracted, sectioned, and imaged with transverse microradiography to detect a transparent surface zone. Even though the presence of a highly mineralized outer layer at the surface of the lesion appears to be the best indicator that a lesion is arrested, it is unclear how thick or how highly mineralized that layer has to be for it to be clinically inactive.
Thermal imaging was less time-consuming to implement in vivo than anticipated, and the images could be directly viewed and interpreted in real time. The mean ΔQ values for demineralized root surfaces were 4 times higher than for sound surfaces, and the mean ΔQ values for arrested lesion areas were significantly lower than for active lesion areas (P < 0.0001). The thermal emission profiles from the lesion areas were distinctly different from the sound regions of the tooth, and it is likely that analysis of the shape of the thermal profiles may provide an additional means of discriminating between sound, arrested, and active lesion areas (Lee et al. 2016). Respiration initially confounded thermal measurement, but this interference was addressed by increasing the air pressure from 5 to 10-psi. The more severe active lesions were not completely dehydrated after 30 s, and further work is needed to optimize dehydration. In addition, water trapped in subgingival locations cools the gingival margin (see Fig. 2B), and that cooling can potentially interfere with thermal measurements of tooth structure near the gingival margin. It is likely that plaque and calculus could potentially interfere with thermal measurements since such areas would likely retain more water. However, such interference was not observed in this study, and no additional steps were taken to clean the teeth before imaging.
One can argue that changes in the spectral emissivity during drying can explain the changes in the thermal emission observed in this study since water has a higher emissivity than mineralized tissues. However, the emissivity of sound enamel and dentin is quite high and is estimated to be ~0.91 to 0.92, which is only slightly lower than that of water at ~0.96 (Panas et al. 2003; Lin et al. 2010). The decrease in thermal emission due to changes in the emissivity from the loss of surface water is therefore expected to be much lower than the changes in thermal emission due to evaporative cooling. The emissivity of the gingiva is similar to water. The observation that active lesion areas appear cooler than exposed areas of the gingiva upon drying provides further evidence that the dominant mechanism of reduced thermal emission is evaporative cooling rather than differences in the local emissivity upon loss of surface water.
CP-OCT can be used to detect the transparent surface zone that is indicative of arrested lesions in vivo. The use of CP-OCT to measure lesion shrinkage during drying was only partially successful since we were only able to coregister CP-OCT images for 12 of the lesions before and after drying due to movement during imaging. In future studies, a method will need to be developed to prevent movement during drying. However, the mean shrinkage for those 12 samples in which the surface position could be matched before and after drying was more than 60 µm, which can be easily measured with OCT.
In summary, we have demonstrated that thermal and CP-OCT imaging have great potential for the in vivo assessment of the activity of root caries lesions in a single appointment. Future efforts will be to evaluate if these imaging methods can be used to monitor remineralization efforts over time.
Author Contributions
V. Yang, contributed to design, data acquisition, and analysis, drafted and critically revised the manuscript; Y. Zhu, contributed to design and data acquisition, critically revised the manuscript; D. Curtis, contributed to conception, data acquisition, and interpretation, drafted and critically revised the manuscript; O. Le, contributed to conception and data acquisition, critically revised the manuscript; N.Y.N. Chang, contributed to design and data interpretation, critically revised the manuscript; W.A. Fried, contributed to data acquisition and analysis, critically revised the manuscript; J.C. Simon, P. Banan, contributed to data acquisition, critically revised the manuscript; C.L. Darling, contributed to design, drafted and critically revised the manuscript; D. Fried, contributed to conception, design, data acquisition, analysis, and interpretation, drafted and critically revised the manuscript. All authors gave final approval and agree to be accountable for all aspects of the work.
Footnotes
This study was supported by TRDRP grant 27IP-0015 and National Institute of Dental and Craniofacial Research (NIDCR)/National Institutes of Health (NIH) grants R01-DE027335, F30-DE027264, and F30-DE026052.
The authors declare no potential conflicts of interest with respect to the authorship and/or publication of this article.
References
- Ando M, Ferreira-Zandona AG, Eckert GJ, Zero DT, Stookey GK. 2017. Pilot clinical study to assess caries lesion activity using quantitative light-induced fluorescence during dehydration. J Biomed Opt. 22(3):35005. [DOI] [PubMed] [Google Scholar]
- Ando M, Sharp N, Adams D. 2012. Pulse thermography for quantitative nondestructive evaluation of sound, de-mineralized and re-mineralized enamel. In: Proceedings of SPIE Volume 8348, Health Monitoring of Structural and Biological Systems; San Diego (CA): SPIE Smart Structures and Materials + Nondestructive Evaluation and Health Monitoring. p. 83480S. [Google Scholar]
- Banting DW. 1993. Diagnosis and prediction of root caries. Adv Dent Res. 7(2):80–86. [DOI] [PubMed] [Google Scholar]
- Banting DW. 2001. Diagnosis of root caries. J Dent Educ. 65(10):991–996. [PubMed] [Google Scholar]
- Chan KH, Tom H, Lee RC, Kang H, Simon JC, Staninec M, Darling CL, Pelzner RB, Fried D. 2016. Clinical monitoring of smooth surface enamel lesions using CP-OCT during nonsurgical intervention. Lasers Surg Med. 48(10):915–923. [DOI] [PMC free article] [PubMed] [Google Scholar]
- Dye BA, Tan S, Lewis BG, Barker LK, Thornton-Evans TG, Eke PI, Beltrán-Aguilar ED, Horowitz AM, Li CH. 2007. Trends in oral health status, United States, 1988–1994 and 1999–2004. Vital Health Stat. 11(248):1–92. [PubMed] [Google Scholar]
- Dye BA, Thornton-Evans T, Li X, Iafolla TJ. 2015. Dental caries and tooth loss in adults in the United States, 2011–2012. NCHS Data Brief. 197:197. [PubMed] [Google Scholar]
- Ekstrand K, Martignon S, Holm-Pedersen P. 2008. Development and evaluation of two root caries controlling programmes for home-based frail people older than 75 years. Gerodontology. 25(2):67–75. [DOI] [PubMed] [Google Scholar]
- Fejerskov O, Luan WM, Nyvad B, Budtz-Jorgensen E, Holm-Pedersen P. 1991. Active and inactive root surface caries lesions in a selected group of 60- to 80-year-old Danes. Caries Res. 25(5):385–391. [DOI] [PubMed] [Google Scholar]
- Hellyer P, Beighton D, Heath M, Lynch E. 1990. Root caries in older people attending a general practice in East Sussex. Br Dent J. 169(7):201–206. [DOI] [PubMed] [Google Scholar]
- Ismail A, Banting D, Eggertsson H, Ekstrand K, Ferreira-Zandona A, Longbottom C, Pitts N, Reich E, Ricketts D, Selwitz R, et al. 2005. Rationale and evidence for the International Caries Detection and Assessment System (ICDAS II). In: Proceedings of the 7th Annual Indiana Conference on Clinical Models Workshop: Remin-Demin, Precavitation, Caries; Indianapolis (IN): Indiana University School of Dentistry; p. 161–221. [Google Scholar]
- Kaneko K, Matsuyama K, Nakashima S. 2000. Quantification of early carious enamel lesions by using an infrared camera. In: Proceedings of the 4th Annual Indiana Conference on Early Detection of Dental Caries II Indianapolis (IN): Indiana University School of Dentistry p. 83–99. [Google Scholar]
- Lee C, Darling C, Fried D. 2009. Polarization sensitive optical coherence tomographic imaging of artificial demineralization on exposed surfaces of tooth roots. Dent Mater. 25(6):721–728. [DOI] [PMC free article] [PubMed] [Google Scholar]
- Lee RC, Darling CL, Fried D. 2015. Assessment of remineralization via measurement of dehydration rates with thermal and near-IR reflectance imaging. J Dent. 43(8):1032–1042. [DOI] [PMC free article] [PubMed] [Google Scholar]
- Lee RC, Darling CL, Fried D. 2016. Activity assessment of root caries lesions with thermal and near-IR imaging methods. J Biophotonics. 10(3):433–445. [DOI] [PMC free article] [PubMed] [Google Scholar]
- Lee RC, Kang H, Darling CL, Fried D. 2014. Automated assessment of the remineralization of artificial enamel lesions with polarization-sensitive optical coherence tomography. Biomed Opt Express. 5(9):2950–2962. [DOI] [PMC free article] [PubMed] [Google Scholar]
- Lee RC, Staninec M, Le O, Fried D. 2014. Infrared methods for assessment of the activity of natural enamel caries lesions. IEEE J Sel Top Quantum Electron. 22(3):6803609. [DOI] [PMC free article] [PubMed] [Google Scholar]
- Lin M, Xu F, Lu TJ, Bai BF. 2010. A review of heat transfer in human tooth—experimental characterization and mathematical modeling. Dent Mater. 26(6):501–513. [DOI] [PubMed] [Google Scholar]
- Lynch E, Beighton D. 1994. A comparison of primary root caries lesions classified according to colour. Caries Res. 28(4):233–239. [DOI] [PubMed] [Google Scholar]
- Manesh SK, Darling CL, Fried D. 2009. a. Nondestructive assessment of dentin demineralization using polarization-sensitive optical coherence tomography after exposure to fluoride and laser irradiation. J Biomed Mater Res B Appl Biomater. 90(2):802–812. [DOI] [PMC free article] [PubMed] [Google Scholar]
- Manesh SK, Darling CL, Fried D. 2009. b. Polarization-sensitive optical coherence tomography for the nondestructive assessment of the remineralization of dentin. J Biomed Opt. 14(4):044002. [DOI] [PubMed] [Google Scholar]
- Nee A, Chan K, Kang H, Staninec M, Darling CL, Fried D. 2014. Longitudinal monitoring of demineralization peripheral to orthodontic brackets using cross polarization optical coherence tomography. J Dent. 42(5):547–555. [DOI] [PMC free article] [PubMed] [Google Scholar]
- Ozok AR, Wu MK, Ten Cate JM, Wesselink PR. 2002. Effect of perfusion with water on demineralization of human dentin in vitro. J Dent Res. 81(11):733–737. [DOI] [PubMed] [Google Scholar]
- Panas AJ, Żmuda S, Terpiłowski J, Preiskorn M. 2003. Investigation of the thermal diffusivity of human tooth hard tissue. Int J Thermophys. 24(3):837–848. [Google Scholar]
- Schaeken M, Keltjens H, Van der Hoeven J. 1991. Effects of fluoride and chlorhexidine on the microflora of dental root surfaces and progression of root-surface caries. J Dent Res. 70(2):150–153. [DOI] [PubMed] [Google Scholar]
- Simon JC, Kang H, Staninec M, Jang AT, Chan KH, Darling CL, Lee RC, Fried D. 2017. Near-IR and CP-OCT imaging of suspected occlusal caries lesions. Lasers Surg Med. 49(3):215–224. [DOI] [PMC free article] [PubMed] [Google Scholar]
- Topping GVA, Pitts NB. 2009. Clinical visual caries detection. In: Pitts NB, editor. Monographs in oral science. Vol. 21: Detection, assessment, diagnosis and monitoring of caries. Basel (Switzerland): Karger; p. 15–41. [DOI] [PubMed] [Google Scholar]
- Usenik P, Burmen M, Fidler A, Pernus F, Likar B. 2014. Near-infrared hyperspectral imaging of water evaporation dynamics for early detection of incipient caries. J Dent. 42(10):1242–1247. [DOI] [PubMed] [Google Scholar]
- Wada I, Shimada Y, Ikeda M, Sadr A, Nakashima S, Tagami J, Sumi Y. 2015. Clinical assessment of non carious cervical lesion using swept-source optical coherence tomography. J Biophotonics. 8(10):846–854. [DOI] [PubMed] [Google Scholar]
- Yang VB, Chang NY, Fried D. 2020. A thermal imaging handpiece for the clinical assessment of lesion activity on root surfaces via dehydration. Proc SPIE Int Soc Opt Eng. 11217:112170H. [DOI] [PMC free article] [PubMed] [Google Scholar]
- Yang VB, Fried D. 2019. a. An appliance for monitoring the shrinkage of root caries with OCT. Proc SPIE Int Soc Opt Eng.10857:108570L. [DOI] [PMC free article] [PubMed] [Google Scholar]
- Yang VB, Fried D. 2019. b. Measurement of the shrinkage of natural and simulated lesions on root surfaces with CP-OCT. J Dent. 90:103213. [DOI] [PMC free article] [PubMed] [Google Scholar]
- Zakian CM, Taylor AM, Ellwood RP, Pretty IA. 2010. Occlusal caries detection by using thermal imaging. J Dent. 38(10):788–795. [DOI] [PubMed] [Google Scholar]