

Abstract
Five gallbladder cancer (GBC) cell lines were examined for morphological changes in collagen gel culture. GBh3 and HUCCT‐1 cells formed tubules in response to treatment with epithelial growth factor (EGF) and hepatocyte growth factor (HGF), and showed high levels of expression of E‐cadherin (ECD), and low levels of SNAIL, vimentin, transforming growth factor (TGF)‐β, and nucleostemin (NS). In contrast, the GBd15 and FU‐GBC‐1 cell lines treated with EGF and HGF showed a scattering phenotype, and expressed low levels of ECD and high levels of SNAIL, vimentin, TGF‐β, and NS. All cell lines expressed the EGF receptor, c‐Met, EGF, and TGF‐α, but not HGF. Transforming growth factor‐β was upregulated by EGF. Knockdown of the EGF receptor abrogated both tubule formation and scattering, whereas KD of TGF‐β abrogated only scattering. Knockdown of EGF induced nuclear translocation of β‐catenin and Wnt‐related NS induction in the scattering cell lines, but not in the tubule‐forming cell lines, whereas KD of glycogen synthase kinase‐3β in the tubule‐forming cell lines resulted in the nuclear translocation of β‐catenin and Wnt‐related NS induction in response to EGF treatment. These results suggest that EGF enhances epithelial–mesenchymal transformation and acquisition of stemness in GBC cells with a scattering phenotype through the activity of β‐catenin. Repression of ECD in scattering GBC cells induced the release of β‐catenin from the cell adhesion complexes along the plasma membrane and its translocation to the nucleus to activate Wnt signaling, which upregulated NS. (Cancer Sci 2012; 103: 1165–1171)
Biliary tract cancer is the sixth leading cause (5.1%) of cancer death in Japan, with 17 000 BTC patients dying in 2009.1 Biliary tract cancer shows poor prognosis in spite of aggressive treatment, and the 5‐year survival is only 18%.1 Nodal metastasis is the most significant prognostic factor for GBC.2, 3, 4
Epithelial growth factor receptor is a key factor in epithelial malignancies, and its activity enhances tumor growth, invasion, and metastasis.5 Biliary tract cancers express EGFR in 60.7% of cases.6 The EGFR‐overexpressing GBC cases show poorly differentiated histology and decreased survival of 1.5 years in median survival.7 Amplification and point mutations of the EGFR gene have been reported to be 1% and 15–26.5%, respectively, in GBC.8, 9, 10 The HGF receptor c‐Met is involved in the early carcinogenesis of BTC.11 c‐Met is expressed in 74% of invasive GBC and is associated with invasive depth.12 Because HGF is secreted from fibroblasts, c‐Met activation depends on the cancer–host interaction.13 Transforming growth factor‐β is widely expressed in advanced GBC and is associated with angiogenesis and tumor‐associated macrophage infiltration as well as with stromal fibrosis.14, 15
Epidermal growth factor receptor, c‐Met, and TGF‐β have recently been implicated in the process of EMT.16, 17, 18, 19 Epithelial–mesenchymal transition comprises a switch in cell differentiation from polarized epithelial cells to contractile and motile mesenchymal cells.20 In EMT‐type cells, the reduction of the epithelial marker ECD occurs in parallel with the induction of the mesenchymal marker VIM.21 Epithelial–mesenchymal transition occurs during cancer progression and enhances invasion and metastasis.20
The present study aimed to clarify the relationship between morphogenesis, EMT, and growth factors in GBC cells.
Materials and Methods
Cell culture and reagents
Human GBC cell lines GBh3, HUCCT‐1, FU‐GBC‐1, FU‐GBC‐2, and GBd15 were maintained in DMEM (Sigma, St. Louis, MO, USA) containing 10% FBS (Sigma) under the conditions of 5% CO2 in air at 37°C. Human recombinant EGF (Peprotec EC, Rocky Hill, NJ, USA), human recombinant HGF (R&D Systems, Minneapolis, MN, USA), and Wnt inhibitor (IWP3; Miltenyi Biotec, Bergisch Gladbach, Germany) were purchased. The effect of various concentrations of EGF (1, 5, 10, 25, 50, 100 ng/mL) and HGF (1, 10, 30, 60, 120 ng/mL) on morphology was examined in GBC cells. At 10 ng/mL and higher concentrations of EGF, and at 30 ng/mL and higher concentrations of HGF, there were clear effects on cell morphology (see Fig. 1).
Figure 1.
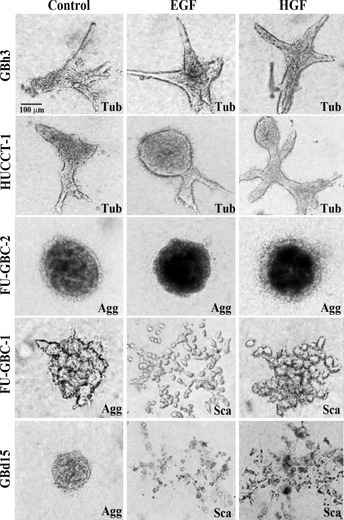
Effect of epidermal growth factor (EGF) and hepatocyte growth factor (HGF) on the morphogenesis of gallbladder cancer cells grown on collagen gels. Five gallbladder cell lines were treated with EGF (10 ng/mL) or HGF (30 ng/mL) in collagen gel for 48 h. The cells showed tubule formation (Tub), cell aggregation (Agg), or scattering (Sca). Bar, 100 μm.
Collagen gel assay
Before preparing the gels, 1 mL of 0.1% BSA (Sigma) solution was added into each well of a 48‐well plate and incubated at 37°C for 1 h. A collagen solution mixture was prepared by quickly mixing eight volumes of collagen type I solution (Nitta Gelatin, Tokyo, Japan) with one volume of 10‐fold concentrated DMEM and one volume of sodium bicarbonate (22 mg/mL). Cells (1 × 10⁶) were added to 300 μL collagen solution mixture, and gently mixed. Collagen solution was poured into a 48‐well plate after BSA solution was removed, and allowed to gel for 30 min in a 5% CO2 atmosphere at 37°C. After 30 min, culture media was poured into each well, and the collagen gels were detached from the surface of the well by rimming the gels with a sterile needle and gently swirling the plate.
Short interfering RNA
FlexiTube siRNAs for EGFR, c‐Met, TGF‐β, and GSK‐3β were purchased from Qiagen Genomics (Bothell, WA, USA). AllStars Negative Control siRNA was used for control (Qiagen Genomics). Cells were transfected with 50 nM siRNA for each gene using Lipofectamine 2000 (Invitrogen, Carlsbad, CA, USA) according to the manufacturer's instructions.
Quantitative RT‐PCR
Total RNA (1 μg) was synthesized with the ReverTra Ace qPCR RT Kit (Toyobo, Osaka, Japan). Quantitative RT‐PCR was carried out on StepOne Real‐Time PCR Systems (Applied Biosystems, Foster City, CA, USA) using Fast SYBR Green Master Mix (Applied Biosystems) and analyzed using the relative standard curve quantification method. The PCR conditions were according to the provider's instructions and the actin β mRNA level was amplified for internal control. Each amplification was evaluated by melting curve analysis and PCR products were electrophoresed on 2% agarose gel. All PCRs were carried out in triplicate at least. Primer sets were purchased from Santa Cruz Biotechnology (Santa Cruz, CA, USA). The reaction conditions were according to the provider's instructions.
Immunoblot analysis
Each fraction was extracted as described previously.22 Twenty‐five microgram lysates were subjected to immunoblot analysis in 12.5% SDS‐polyacrylamide gels followed by electrotransfer to nitrocellulose filters. The filters were incubated with primary antibodies, then with peroxidase‐conjugated IgG antibody (Medical and Biological Laboratories, Nagoya, Japan). Antibodies to β‐catenin (LifeSpan Biosciences, Seattle, WA, USA), ECD (Transduction Laboratories, Lexington, KY, USA), Twist (Abnova, Taipei City, Taiwan), ZEB‐1 (Bioss, Woburn, MA, USA), and Slug (Abgent, San Diego, CA, USA) were used as primary antibodies. The immune complex was visualized with the Enhanced Chemiluminescence Western blot detection system (Amersham Biosciences, Aylesbury, UK).
Cell growth and apoptosis
Cells were seeded at a density of 10 000 cells per well in 12‐well tissue culture plates. Then MTT (Sigma) was added to the culture medium at a concentration of 25 μg/mL at 1 h before harvest. The harvested cell pellets were lysed with 1 mL DMSO, and 200 μL of the lysate was examined at 620 nm. Cells were seeded at a density of 20 000 cells per wells in 96‐well tissue culture plates. After cells were exposed to MTT for 1 h before the harvest, chromogenic granules from the cells were dissolved in DMSO and subjected to examination at 540 nm. The experiments were carried out three times. Apoptosis was assessed by staining with Hoechst33258 fluorescent dye (Wako Pure Chemical Industries, Osaka, Japan). The number of apoptotic cells was counted by observation of 1000 cells.
Enzyme‐linked immunosorbant assay
The conditioned medium filtered through a 0.2 μm filter (Becton‐Dickinson Labware, Bedford, MA, USA) was used for ELISA. Concentrations of EGF, TGF‐α, and HGF were detected by their specific ELISA kits; human EGF ELISA kit and human HGF ELISA kit (Boster Biological Technology, Wuhan, China) and TGF‐α DuoSet ELISA (R&D Systems) were used according to the provider's instructions.
Statistical analysis
Statistical analyses of experimental data were done by the Mann–Whitney U‐test and anova. Statistical significance was defined as a two‐sided P‐value of <0.05.
Results
Effect of EGF and HGF on morphogenesis of GBC cells
The effect of EGF and HGF on the morphogenesis of human GBC cells was first examined. The five GBC cell lines analyzed were cultured in collagen gel and treated with EGF or HGF (Fig. 1). Treatment with EGF and HGF caused tubule formation in GBh3 and HUCCT‐1 cells, whereas FU‐GBC‐2 cells did not form tubules, but rather formed cell aggregates in response to treatment. Cell scattering was observed in GBd15 and FU‐GBC‐1 cells treated with EGF and HGF. Scattered cells lost polygonal epithelioid features but developed spindle fibroblastic features.
Expression of growth factors and receptors in GBC cells
The expression of growth factor receptors and production of their ligands were examined in five GBC cell lines (Fig. 2). Both EGFR and c‐Met were expressed in all five cell lines at levels that were not clearly associated with morphogenetic changes. The five GBC cell lines secreted TGF‐α and EGF, but not HGF, into the culture medium. The levels of EGF or TGF‐α were not associated with the morphogenetic changes observed. Epidermal growth factor receptor and the ligands analyzed are considered to form an autocrine loop in the five GBC cell lines, whereas c‐Met does not possess autocrine activation. Autocrine activation of EGFR is considered the cause of partial scattering of GBd15 cells.
Figure 2.
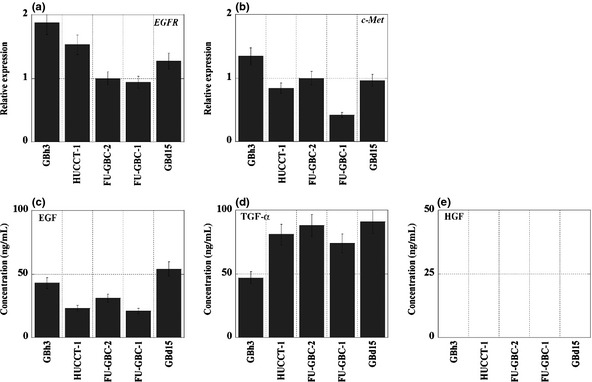
Expression of growth factor receptors and ligands in gallbladder cancer cells. (a,b) The mRNA expression of epidermal growth factor receptor (EGFR) and c‐Met was examined by quantitative RT‐PCR. β‐Actin expression was used as a standard. (c–e) Protein concentrations of epidermal growth factor (EGF), transforming growth factor (TGF)‐α, and hepatocyte growth factor (HGF) were measured by ELISA. Bar, SD from three independent examinations.
Expression of cell adhesion‐related molecules in GBC cells
Cell‐to‐cell adhesion molecules play a pivotal role in the morphogenesis of cancer cells.23 The expression of ECD and β‐catenin was, therefore, examined in the five GBC cell lines (Fig. 3a,b). β‐Catenin expression was constitutively positive in GBC cells, whereas ECD expression levels varied in the different cell lines. Tubule‐forming GBh3 and HUCCT‐1 cells expressed high levels of ECD and low levels of VIM (Fig. 3c). In contrast, scattering GBd15 and FU‐GBC‐1 cells showed markedly reduced ECD and upregulated VIM. Aggregate‐forming FU‐GBC‐2 cells showed intermediate levels of ECD and VIM expression. These results suggest that the levels of ECD and VIM are closely associated with the morphogenesis of GBC cells.
Figure 3.
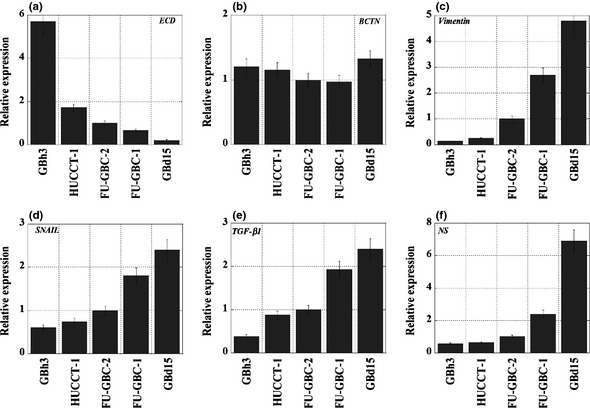
Expression of epithelial–mesenchymal transition‐associated genes in gallbladder cancer cells. The mRNA expressions of E‐cadherin (ECD) (a), β‐catenin (BCTN) (b), vimentin (c), SNAIL (d), transforming growth factor (TGF)‐β1 (e), and nucleostemin (NS) (f) are shown. Expression values were normalized by β‐actin expression. Bar, SD from three independent examinations.
Expression of EMT‐associated molecules in GBC cells
Because the scattering phenotype of GBC cells resembles that of cancer cells undergoing EMT, the expression of EMT‐associated molecules in the five GBC cell lines was examined (Fig. 3d–f). Scattering GBd15 and FU‐GBC‐1 cells showed increased expression of SNAIL, TGF‐β, and NS. In contrast, tubule‐forming GBh3 and HUCCT‐1 cells showed low levels of SNAIL, TGF‐β, and NS expression. The scattering phenotype is, therefore, thought to be linked to EMT.
Effect of KD of EGFR or TGF‐β on morphogenesis of GBC cells
Because the phenotype of the five GBC cell lines involved an active EGFR autocrine loop, we examined the effect of EGFR KD on morphogenesis in the GBC cells cotreated with EGF and HGF (Fig. 4). The EGFR KD caused cell aggregation, but not tubule formation or scattering in all cell lines, suggesting that EGFR is responsible for both tubule formation and scattering.
Figure 4.
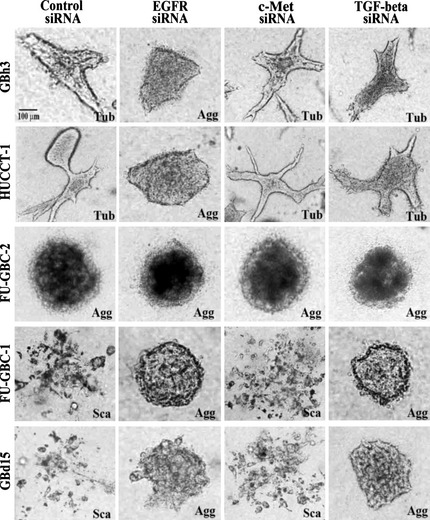
Effect of knockdown of epidermal growth factor receptor (EGFR), c‐Met, and transforming growth factor (TGF)‐β on morphogenesis in GBC cells grown in collagen gels. Five gallbladder cell lines were transfected with siRNAs for EGFR, c‐Met, and TGF‐β, treated with epidermal growth factor (EGF; 10 ng/mL) and hepatocyte growth factor (HGF; 30 ng/mL) and grown in collagen gel for 48 h. The cells showed tubule formation (Tub), cell aggregation (Agg), or scattering (Sca). Bar, 100 μm.
In contrast, c‐Met KD did not alter the effect of co‐treatment with EGF and HGF on morphogenesis. The TGF‐β KD resulted in cell aggregation in GBd15 and FU‐GBC‐1 cells with abrogation of scattering. However, GBh3, HUCCT‐1, and FU‐GBC‐2 cells did not show altered morphogenesis in response to TGF‐β KD. Thus, EGFR might be needed for both tubule formation and scattering, whereas c‐Met might play a comparatively minor role. The activity of TGF‐β might be coordinated with that of EGFR in producing the scattering phenotype.
Effect of EGF on expression of EMT‐associated genes
The effect of the EGF/EGFR system on the expression of EMT‐associated genes was examined in the GBh3 and GBd15 cells (Fig. 5a–d). In tubule‐forming GBh3 cells, KD of EGFR and EGF treatment did not significantly alter the expression of EMT‐associated genes including SNAIL, Twist, ZEB‐1, and Slug. In scattering GBd15 cells, EGF treatment downregulated ECD. In contrast, EGF treatment upregulated SNAIL, Twist, ZEB‐1, Slug, TGF‐β, and NS expression. Inversely, EGFR KD increased ECD and decreased SNAIL, Twist, ZEB‐1, Slug, TGF‐β, and NS expression.
Figure 5.
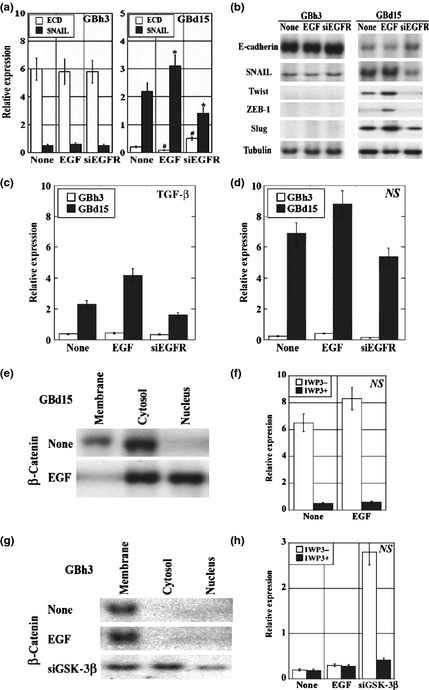
Effect of epidermal growth factor (EGF) treatment and epidermal growth factor receptor (EGFR) knockdown on the expression of epithelial–mesenchymal transition‐associated genes in gallbladder cancer cells. (a–d) Tubule‐forming GBh3 cells and scattering GBd15 cells with or without EGFR knockdown were treated with EGF. (a) The mRNA expressions of E‐cadherin (ECD) and SNAIL were examined, standardized by β‐actin expression. *P < 0.01, #P < 0.001. (b) The protein levels of ECD and SNAIL were examined by immunoblotting. The protein levels of Twist, ZEB‐1, and Slug were also examined. Tubulin was examined as a loading control. (c,d) The mRNA expressions of transforming growth factor (TGF)‐β and nucleostemin (NS) were examined. The expression was standardized by β‐actin. (e,g) β‐Catenin intracellular localization was examined in cells after EGF or glycogen synthase kinase (GSK)‐3β knockdown. (f,h) Effect of the Wnt inhibitor IWP3 on NS mRNA expression in cells after EGF or GSK‐3β knockdown. Bar, SD from three independent examinations.
As shown in Figure 5(e,f), β‐catenin localized to the cytoplasmic membrane and cytoplasm in untreated GBd15 cells, whereas in the EGF‐treated cells, β‐catenin was detected in the cytoplasm and nuclei. Because nuclear translocation of β‐catenin reflects the activation of Wnt signaling, GBd15 cells were cotreated with EGF and a Wnt inhibitor. Although the Wnt inhibitor did not affect TGF‐β expression, it downregulated NS expression. These results indicate that EGF signaling increases NS expression through β‐catenin‐induced Wnt activation.
Finally, the role of β‐catenin in the EGF pathway was examined in tubule‐forming GBh3 cells (Fig. 5g,h). β‐Catenin localized to the cytoplasmic membrane in untreated and EGF‐treated GBh3 cells. The GSK‐3β KD in GBh3 cells caused the dissociation of β‐catenin from the membrane‐bound cell adhesion complex, which resulted in loss of tubule formation and gain of scattering. The GSK‐3β KD in GBh3 cells also caused the translocation of β‐catenin to the cytoplasm and nuclei. These data suggest that the location of β‐catenin might determine the differential responses to EGF and the morphology of GBC cells.
Discussion
In the present study, we examined the effect of growth factors on morphogenesis and scattering of GBC cells. The scattering phenotype of GBd15 and FU‐GBC‐1 cells was enhanced by treatment with EGF and HGF. Scattering cancer cells show spindle fibroblastic shape and poor cell‐to‐cell attachment. In the present study, these cell lines showed decreased ECD and SNAIL expression, which is a key phenotype of EMT. They also expressed TGF‐β at high levels; TGF‐β is closely associated with EMT induction.19 Moreover, the scattering cell lines expressed NS at high levels. Nucleostemin is one of the stemness markers, and high NS expression is considered to be related to the acquisition of the stem cell phenotype. This pattern of expression is compatible with EMT of cancer cells.
β‐Catenin is an ECD‐bound cytoplasmic molecule with a link to the cytoskeleton. The dissociation of β‐catenin from ECD results in its translocation into the nucleus to act as a transcription factor in Wnt activation. Mutations in the APC gene cause inactivation of the ECD complex and nuclear translocation of β‐catenin, which is important for carcinogenesis. Thus, alterations in the ECD and β‐catenin complex affect multiple pathways to enhance the malignant activity of cancer cells.
The present data showed that the EGF‐induced β‐catenin translocation into the nucleus occurs in the GBC cells with a scattering phenotype, and is associated with Wnt‐related increase in NS. In contrast, in GBC cells with a tubule‐forming phenotype, nuclear localization of β‐catenin was not detected in the presence or absence of EGF. However, KD of GSK‐3β resulted in nuclear translocation of β‐catenin and Wnt‐related NS induction. Downregulation of ECD, therefore, induces nuclear translocation of β‐catenin, which subsequently increases stemness by Wnt activation. β‐Catenin, therefore, plays an important role in the acquisition of stemness in the scattering GBC cells, in which ECD is repressed, inducing the release of β‐catenin from the cell adhesion complex on the cytoplasmic membrane. The free β‐catenin translocates to the nucleus to activate Wnt signaling, which upregulates NS. In tubule‐forming GBC cells, the forced release of β‐catenin from the cell adhesion complex by GSK KD caused a scattering phenotype and NS upregulation. In clinical studies, nuclear and/or cytoplasmic translocation of β‐catenin was found in half of the GBC cases and was associated with poorly differentiated histology.24
Activation of Wnt signaling by β‐catenin nuclear translocation affects the behavior of mesenchymal stem cells and also mediates EMT.25 Moreover, EMT is linked to the acquisition of the stem cell phenotype of cancer cells.26 Our current data is compatible with this mechanism. Gallbladder cancer cells with a scattering phenotype are thought to possess an EMT phenotype with high cancer stem cell competence, which is related to more aggressive progression and metastasis of the disease. Moreover, EMT‐type cells with stemness are responsible for drug resistance.27, 28
In our study, the EMT phenotype was closely associated with ECD expression. Gallbladder cancer cells with low ECD expression showed a scattering phenotype in response to EGFR activation, whereas GBC cells with high ECD expression showed a tubule‐forming phenotype. Reduced ECD expression is found in more than 60% of GBC cases.29, 30 Downregulation of ECD is more pronounced in advanced GBC cases than in early cases, and is associated with poorer prognosis.29 Repression of ECD is caused by promoter DNA methylation, gene mutation, and transcriptional regulation. Gene silencing of ECD by methylation of the promoter is detected in 41% of BTC cases.31 High frequency of loss of heterozygosity of ECD is found in GBC.30 In the negative regulation of ECD, certain transcription factors have been identified as playing a role, including ZEB‐1, ZEB‐2, Twist, Slug, and SNAIL.18 These factors are observed during the EMT of cancer cells. In the present study, SNAIL expression was inversely correlated with ECD expression. Expressions of Twist, ZEB‐1, and Slug were also increased by EGF treatment in association with ECD repression in GBd15 cells. In contrast, HUCCT‐1 cells showed the same level of SNAIL expression as GBh3 cells, whereas ECD expression in HUCCT‐1 cells was lower than that in GBh3 cells. Methylation of the promoter of the ECD gene was detected in HUCCT‐1 cells (data not shown). Recent studies identified specific microRNAs associated with ECD repression or EMT. A candidate oncogenic miRNA, miR‐21, was found to induce TGF‐β‐related EMT,32 and miR‐200 is downregulated in cancer cells, which results in ZEB‐1/‐2‐related EMT.33 These factors should be examined in GBC.
Our data showed the significance of EGFR in the induction of EMT in GBC cells. Activation of EGFR inactivates GSK‐3β and upregulates SNAIL, which results in ECD repression and EMT in uterine cervical cancer.21 Epidermal growth factor receptor also enhances ubiquitination and degradation of ECD by CDC42 activation through the Src pathway.34 In contrast, in cells expressing ECD and showing stable cell‐to‐cell attachment, the activity of the EGFR–ERK pathway is decreased and β‐catenin–T lymphocyte‐specific transcription factor (TCF) signaling is inhibited.35 In dense culture of ECD expressing airway epithelial cells, EGFR activation promotes cell differentiation with mucin production.36 E‐cadherin regulates EGFR by promoting the formation of a complex with the extracellular domain of ECD.37 The intrinsic tyrosine kinase activity and dimerization of the EGFR in cells grown in sparse culture are induced by EGF, whereas these activities are not induced in cells grown in dense culture.38 Thus, interaction between EGFR and ECD generates both tubulogenesis and scattering. Decreased ECD levels enhance EGFR‐related ECD downregulation in a vicious cycle, which results in the inactivation of GSK‐3β, β‐catenin–Wnt activation, increment of stemness, and EMT.
In cholangiocellular carcinoma cell lines, the anti‐EGFR antibody cetuximab is partially effective in EGFR‐expressing cells.39 KRAS mutations affect the efficacy of cetuximab in these cells. Gefinitib, a selective EGFR tyrosine kinase inhibitor, inhibits the phosphorylation of EGFR, ERK, and AKT, and induces G1 arrest and apoptosis by upregulating p21 and p27, and BAX activation in GBC cells.40 Epidermal growth factor receptor targeting is, therefore, critical in the treatment of GBC.
Disclosure Statement
The authors have no conflicts of interest.
Abbreviations
- BTC
biliary tract cancer
- ECD
E‐cadherin
- EGF
epithelial growth factor
- EGFR
epithelial growth factor receptor
- EMT
epithelial–mesenchymal transition
- GBC
gallbladder cancer
- GSK
glycogen synthase kinase
- HGF
hepatocyte growth factor
- KD
knockdown
- NS
nucleostemin
- TGF
transforming growth factor
- VIM
vimentin
Acknowledgments
This work was supported in part by a Grant‐in‐Aid for Scientific Research from the Japan Society for the Promotion of Science, Japan, and a Grant‐in‐Aid for Scientific Research from the Ministry of Health, Labour and Welfare, Japan.
References
- 1. Center for Cancer Control and Information Services , ed. Current Cancer Statistics in Japan. Tokyo, Japan: National Cancer Center, 2011. Available from URL: http://ganjoho.ncc.go.jp/public/statistics/pub/statistics01.html [Google Scholar]
- 2. Bartlett DL, Fong Y, Fortner JG, Brennan MF, Blumgart LH. Long‐term results after resection for gallbladder cancer. Implications for staging and management. Ann Surg 1996; 224: 639–46. [DOI] [PMC free article] [PubMed] [Google Scholar]
- 3. Dawes LG. Gallbladder cancer. Cancer Treat Res 2001; 109: 145–55. [DOI] [PubMed] [Google Scholar]
- 4. Bartlett DL. Gallbladder cancer. Semin Surg Oncol 2000; 19: 145–55. [DOI] [PubMed] [Google Scholar]
- 5. Normanno N, De Luca A, Bianco C et al Epidermal growth factor receptor (EGFR) signaling in cancer. Gene 2006; 366: 2–16. [DOI] [PubMed] [Google Scholar]
- 6. Harder J, Waiz O, Otto F et al EGFR and HER2 expression in advanced biliary tract cancer. World J Gastroenterol 2009; 15: 4511–7. [DOI] [PMC free article] [PubMed] [Google Scholar]
- 7. Kaufman M, Mehrotra B, Limaye S et al EGFR expression in gallbladder carcinoma in North America. Int J Med Sci 2008; 5: 285–91. [DOI] [PMC free article] [PubMed] [Google Scholar]
- 8. Leone F, Cavalloni G, Pignochino Y et al Somatic mutations of epidermal growth factor receptor in bile duct and gallbladder carcinoma. Clin Cancer Res 2006; 12: 1680–5. [DOI] [PubMed] [Google Scholar]
- 9. Ooi A, Suzuki S, Nakazawa K et al Gene amplification of Myc and its coamplification with ERBB2 and EGFR in gallbladder adenocarcinoma. Anticancer Res 2009; 29: 19–26. [PubMed] [Google Scholar]
- 10. Pignochino Y, Sarotto I, Peraldo‐Neia C et al Targeting EGFR/HER2 pathways enhances the antiproliferative effect of gemcitabine in biliary tract and gallbladder carcinomas. BMC Cancer 2010; 10: 631. [DOI] [PMC free article] [PubMed] [Google Scholar]
- 11. Sanada Y, Osada S, Tokuyama Y et al Critical role of c‐Met and Ki67 in progress of biliary carcinoma. Am Surg 2010; 76: 372–9. [PubMed] [Google Scholar]
- 12. Moon WS, Park HS, Lee H et al Co‐expression of cox‐2, C‐met and beta‐catenin in cells forming invasive front of gallbladder cancer. Cancer Res Treat 2005; 37: 171–6. [DOI] [PMC free article] [PubMed] [Google Scholar]
- 13. Matsumoto K, Date K, Shimura H, Nakamura T. Acquisition of invasive phenotype in gallbladder cancer cells via mutual interaction of stromal fibroblasts and cancer cells as mediated by hepatocyte growth factor. Jpn J Cancer Res 1996; 87: 702–10. [DOI] [PMC free article] [PubMed] [Google Scholar]
- 14. Kitamura K, Kasuya K, Tsuchida A et al Immunohistochemical analysis of transforming growth factor beta in gallbladder cancer. Oncol Rep 2003; 10: 327–32. [PubMed] [Google Scholar]
- 15. Yukawa M, Fujimori T, Hirayama D et al Expression of oncogene products and growth factors in early gallbladder cancer, advanced gallbladder cancer, and chronic cholecystitis. Hum Pathol 1993; 24: 37–40. [DOI] [PubMed] [Google Scholar]
- 16. Chang HY, Kao MC, Way TD, Ho CT, Fu E. Diosgenin suppresses HGF‐induced epithelial‐mesenchymal transition by down‐regulation of MDM2 and vimentin. J Agric Food Chem 2011; 59: 5357–63. [DOI] [PubMed] [Google Scholar]
- 17. Barr S, Thomson S, Buck E et al Bypassing cellular EGF receptor dependence through epithelial‐to‐mesenchymal‐like transitions. Clin Exp Metastasis 2008; 25: 685–93. [DOI] [PMC free article] [PubMed] [Google Scholar]
- 18. McConkey DJ, Choi W, Marquis L et al Role of epithelial‐to‐mesenchymal transition (EMT) in drug sensitivity and metastasis in bladder cancer. Cancer Metastasis Rev 2009; 28: 335–44. [DOI] [PMC free article] [PubMed] [Google Scholar]
- 19. Miyazono K. Transforming growth factor‐beta signaling in epithelial‐mesenchymal transition and progression of cancer. Proc Jpn Acad Ser B Phys Biol Sci 2009; 85: 314–23. [DOI] [PMC free article] [PubMed] [Google Scholar]
- 20. Moustakas A, Heldin CH. Signaling networks guiding epithelial‐mesenchymal transitions during embryogenesis and cancer progression. Cancer Sci 2007; 98: 1512–20. [DOI] [PMC free article] [PubMed] [Google Scholar]
- 21. Lee MY, Chou CY, Tang MJ, Shen MR. Epithelial‐mesenchymal transition in cervical cancer: correlation with tumor progression, epidermal growth factor receptor overexpression, and snail up‐regulation. Clin Cancer Res 2008; 14: 4743–50. [DOI] [PubMed] [Google Scholar]
- 22. Fujii K, Luo Y, Sasahira T, Denda A, Ohmori H, Kuniyasu H. Co‐treatment with deoxycholic acid and azoxymethane accelerates secretion of HMGB1 in IEC6 intestinal epithelial cells. Cell Prolif 2009; 42: 701–9. [DOI] [PMC free article] [PubMed] [Google Scholar]
- 23. Gumbiner BM. Regulation of cadherin‐mediated adhesion in morphogenesis. Nat Rev Mol Cell Biol 2005; 6: 622–34. [DOI] [PubMed] [Google Scholar]
- 24. Kimura Y, Furuhata T, Mukaiya M et al Frequent beta‐catenin alteration in gallbladder carcinomas. J Exp Clin Cancer Res 2003; 22: 321–8. [PubMed] [Google Scholar]
- 25. Neth P, Ries C, Karow M, Egea V, Ilmer M, Jochum M. The Wnt signal transduction pathway in stem cells and cancer cells: influence on cellular invasion. Stem Cell Rev 2007; 3: 18–29. [DOI] [PubMed] [Google Scholar]
- 26. Raimondi C, Gianni W, Cortesi E, Gazzaniga P. Cancer stem cells and epithelial‐mesenchymal transition: revisiting minimal residual disease. Curr Cancer Drug Targets 2010; 10: 496–508. [DOI] [PubMed] [Google Scholar]
- 27. Sarkar FH, Li Y, Wang Z, Kong D. Pancreatic cancer stem cells and EMT in drug resistance and metastasis. Minerva Chir 2009; 64: 489–500. [PMC free article] [PubMed] [Google Scholar]
- 28. Singh A, Settleman J. EMT, cancer stem cells and drug resistance: an emerging axis of evil in the war on cancer. Oncogene 2010; 29: 4741–51. [DOI] [PMC free article] [PubMed] [Google Scholar]
- 29. Hirata K, Ajiki T, Okazaki T, Horiuchi H, Fujita T, Kuroda Y. Frequent occurrence of abnormal E‐cadherin/beta‐catenin protein expression in advanced gallbladder cancers and its association with decreased apoptosis. Oncology 2006; 71: 102–10. [DOI] [PubMed] [Google Scholar]
- 30. Priya TP, Kapoor VK, Krishnani N, Agrawal V, Agrawal S. Role of E‐cadherin gene in gall bladder cancer and its precursor lesions. Virchows Arch 2010; 456: 507–14. [DOI] [PubMed] [Google Scholar]
- 31. Koga Y, Kitajima Y, Miyoshi A et al Tumor progression through epigenetic gene silencing of O(6)‐methylguanine‐DNA methyltransferase in human biliary tract cancers. Ann Surg Oncol 2005; 12: 354–63. [DOI] [PubMed] [Google Scholar]
- 32. Zavadil J, Narasimhan M, Blumenberg M, Schneider RJ. Transforming growth factor‐beta and microRNA:mRNA regulatory networks in epithelial plasticity. Cells Tissues Organs 2007; 185: 157–61. [DOI] [PubMed] [Google Scholar]
- 33. Mongroo PS, Rustgi AK. The role of the miR‐200 family in epithelial‐mesenchymal transition. Cancer Biol Ther 2010; 10: 219–22. [DOI] [PMC free article] [PubMed] [Google Scholar]
- 34. Shen Y, Hirsch DS, Sasiela CA, Wu WJ. Cdc42 regulates E‐cadherin ubiquitination and degradation through an epidermal growth factor receptor to Src‐mediated pathway. J Biol Chem 2008; 283: 5127–37. [DOI] [PubMed] [Google Scholar]
- 35. Georgopoulos NT, Kirkwood LA, Walker DC, Southgate J. Differential regulation of growth‐promoting signalling pathways by E‐cadherin. PLoS ONE 2010; 5: e13621. [DOI] [PMC free article] [PubMed] [Google Scholar]
- 36. Kim S, Schein AJ, Nadel JA. E‐cadherin promotes EGFR‐mediated cell differentiation and MUC5AC mucin expression in cultured human airway epithelial cells. Am J Physiol Lung Cell Mol Physiol 2005; 289: L1049–60. [DOI] [PubMed] [Google Scholar]
- 37. Qian X, Karpova T, Sheppard AM, McNally J, Lowy DR. E‐cadherin‐mediated adhesion inhibits ligand‐dependent activation of diverse receptor tyrosine kinases. EMBO J 2004; 23: 1739–48. [DOI] [PMC free article] [PubMed] [Google Scholar]
- 38. Takahashi K, Suzuki K. Density‐dependent inhibition of growth involves prevention of EGF receptor activation by E‐cadherin‐mediated cell‐cell adhesion. Exp Cell Res 1996; 226: 214–22. [DOI] [PubMed] [Google Scholar]
- 39. Xu L, Hausmann M, Dietmaier W et al Expression of growth factor receptors and targeting of EGFR in cholangiocarcinoma cell lines. BMC Cancer 2010; 10: 302. [DOI] [PMC free article] [PubMed] [Google Scholar]
- 40. Ariyama H, Qin B, Baba E et al Gefitinib, a selective EGFR tyrosine kinase inhibitor, induces apoptosis through activation of Bax in human gallbladder adenocarcinoma cells. J Cell Biochem 2006; 97: 724–34. [DOI] [PubMed] [Google Scholar]