

Abstract
Myeloid‐derived suppressor cells (MDSC) represent a heterogeneous population and have the potential to suppress immune responses via diverse mechanisms. In recent studies, a new subset of MDSC was identified by the markers CD14+ and HLA‐DR − in the peripheral blood from cancer patients. In this study, we investigated the proportions and characteristics of CD14+ HLA‐DR − cells in patients with squamous cell carcinoma of the head and neck (SCCHN). As expected, the percentage of CD14+ HLA‐DR − cells was significantly elevated in patients relative to healthy donors and the sorted CD14+ HLA‐DR − cells were able to suppress effectively both the proliferation and IFN‐γ production of anti‐CD3/anti‐CD28 stimulated T cells, suggesting that CD14+ HLA‐DR − cells in patients with SCCHN contribute to the immune suppressive status. Furthermore, CD14+ HLA‐DR − cells revealed a higher level of CD86 and PD‐L1 expression and transforming growth factor (TGF)‐β production than CD14+ HLA‐DR + cells. Addition of anti‐CD86 mAb, anti‐PD‐L1 mAb and anti‐TGF‐β mAb partially restored T‐cell proliferation and IFN‐γ production, respectively, indicating that the suppressive effects of CD14+ HLA‐DR − cells appear to be mediated by various molecules, including coinhibitory molecules and cytokines. Our data suggest that CD14+ HLA‐DR − cells act as potent immunosuppressive cells and particularly contribute to tumor escape from the host immune system in patients with SCCHN. (Cancer Sci 2012; 103: 976–983)
It has been suggested that antitumor immunity plays an important role in the development of and protection from malignancy; however, patients with cancer, especially those with advanced disease, are known to be immunologically compromised. Tumor cells actively induce the dysfunction of dendritic cells and effector T cells and promote the expansion of regulatory immune cells, which downregulate antitumor immunity, allowing tumor cells to escape from immune responses.1, 2, 3 To date, two major subsets of regulatory cells, regulatory T cells (Treg) and myeloid‐derived suppressor cells (MDSC), in cancer have been identified and intensively investigated. The MDSC as well as Treg also have the potential to suppress immune responses of T cells via diverse mechanisms, including the production of arginase I, reactive oxygen, nitrogen species and immunosuppressive cytokines.4, 5 In contrast to murine MDSC, which are defined as CD11b+Gr‐1+ cells, human counterparts of MDSC are still poorly defined due to the lack of specific markers. Myeloid‐derived suppressor cells represent a heterogeneous population of cells, and morphologically comprise at least two subsets of polymorphonuclear and monocytic cells.6, 7 So far, in several carcinomas, MDSC are most commonly defined as lineage‐, HLA‐DR−, CD11b+, CD14−, CD15+ and/or CD33+ cells.8, 9, 10
In recent studies, a new subset of MDSC was identified by markers CD14+ and HLA‐DR− in the peripheral blood from cancer patients.11, 12, 13 Hoechst et al.11 demonstrated that CD14+ HLA‐DR− cells increase in the blood and tumor of hepatocellular carcinoma. Interestingly, these cells showed not only high arginase activity, but also the induction of the CD4+ CD25+ Foxp3+ Treg population when cocultured with autologous T cells. Similarly, in metastatic melanoma patients, CD14+ HLA‐DR− cells secreting TGF‐β were significantly expanded, and administration of granulocyte‐macrophage colony‐stimulating factor (GM‐CSF)‐based vaccines seemed to enhance MDSC‐mediated immunosuppression.12 These findings suggest that in squamous cell carcinoma of the head and neck (SCCHN), which is known to be highly immunosuppressive, abnormal accumulation of CD14+ HLA‐DR− cells in peripheral blood and tumor sites might contribute as an important mechanism of tumor immune evasion. To address this issue, we have focused our work on the proportions and characteristics of CD14+ HLA‐DR− cells in patients with SCCHN. We have shown that significant alterations in the proportion of circulating CD14+ HLA‐DR− subsets exist in the peripheral blood of patients with SCCHN and are significantly associated with that of Treg. Furthermore, CD14+ HLA‐DR− cells revealed a higher level of CD86 and PD‐L1 expression and TGF‐β production than CD14+ HLA‐DR+ cells. Our data provide new insights into MDSC‐mediated immunosuppression in patients with SCCHN and a better understanding of their mechanisms promote the development of effective immunotherapy.
Materials and Methods
Patients
Peripheral blood was obtained from 34 patients with pathologically and clinically confirmed SCCHN. The study was approved by the Institutional Review Board at the University of Yamanashi Hospital and written informed consent was obtained from each individual. The patients received no anticancer drugs, radiotherapy or surgery before blood was drawn. Patient characteristics are summarized in Table 1. The 34 squamous cell carcinomas originated in the oral cavity (n = 22), larynx (n = 6), hypopharynx (n = 4) and maxillary sinus (n = 2). As shown in Table 1 patients were stage I/II and 24 were stage III/IV, based on the Classification of Malignant Tumours by the International Union against Cancer (UICC).
Table 1.
Clinicopathological characteristics of patients with SCCHN tested in the present study
| Characteristic | Value |
|---|---|
| Total no. patients (male/female) | 34 (27/7) |
| Age, mean (range) (years) | 66.2 (35–89) |
| Tumor site | |
| Oral cavity | 22 |
| Larynx | 6 |
| Hypopharynx | 4 |
| Maxillary sinus | 2 |
| TNM classification | |
| T1 | 2 |
| T2 | 13 |
| T3 | 9 |
| T4 | 10 |
| N0 | 18 |
| N1 | 6 |
| N2 | 10 |
| N3 | 0 |
| M0 | 34 |
| M1 | 0 |
| Stage | |
| I | 1 |
| II | 9 |
| III | 6 |
| IV | 18 |
SCCHN, squamous cell carcinoma of the head and neck.
Cell isolation and sorting
Heparinized venous blood (40 mL) was obtained from patients and peripheral blood mononuclear cells (PBMC) were isolated by centrifugation over Ficoll‐Hypaque gradients (Amersham Biosciences, Uppsala, Sweden), washed and counted in the presence of a trypan blue dye. CD14+ HLA‐DR− cells were isolated from the PBMC of patients using MACS® microbeads and columns (Miltenyi Biotec, Gladbach, Germany). Briefly, CD14+ cells were negatively isolated from PBMC with immunomagnetic beads. Purified CD14+ cells were then sorted into CD14+ HLA‐DR+ and CD14+ HLA‐DR− cells with HLA‐DR microbeads.
Isolation of tumor‐infiltrating mononuclear cells
Tumor specimens were obtained from 17 of 34 patients tested. After washing in RPMI‐1640 containing 50 μg/mL gentamycin (Invitrogen, Grand Island, NY, USA), tumor tissues were processed by cutting into small pieces and dissociated using 0.1% collagenase type I (Sigma‐Aldrich, St Louis, MO, USA), 0.02% DNase I (Sigma‐Aldrich) and 1 μ/mL hyaluronidase (Sigma‐Aldrich) in RPMI‐1640 supplemented with 5% (v/v) fetal calf serum. The digest was then passed through 90 μm nylon mesh. The resulting cells were washed with phosphate‐buffered saline and mononuclear cells were isolated using centrifugation over Ficoll–Hypaque gradients.
Flow cytometry analysis
To determine the frequency and phenotype of CD14+ HLA‐DR− cells and Treg in PBMC and tumor‐infiltrating mononuclear cells, multicolor fluorescence‐activated cell sorting analysis was performed using a FACS Calibur flow cytometer (BD Biosciences, San Jose, CA, USA). The following monoclonal antibodies (mAb) were used: fluorescein isothiocyanate (FITC)‐HLA‐DR, FITC‐CD25, phycoerythrin (PE)‐CD127, PE‐CD80, PE‐CD86, allophycocyanin (APC)‐CD4, APC‐CD14 (BD Pharmingen, San Diego, CA, USA), PE‐PD‐L1 and PE‐PD‐L2 (eBiosciences, San Diego, CA, USA). Respective immunoglobulin G (IgG) isotype‐matched controls (BD Pharmingen) were used as negative controls. Data were analyzed with CellQuest software (BD Biosciences). The expression of costimulatory molecules is represented as the mean fluorescence intensity ratio (MFIR), which is the mean fluorescence intensity (MFI) of cells stained with PE‐costimulatory molecule mAb divided by the MFI of cells stained with the PE‐control IgG mAb, as reported by Tomiyama et al.14
Carboxyfluorescein succinimidyl ester (CFSE)‐based suppression assay
The responder PBMC obtained from each patient were stained with 1.5 μM CFSE (Molecular Probe/Invitrogen) and stimulated with expander beads (Miltenyi Biotec) in AIM‐V medium (Invitrogen) containing 5% (v/v) human AB serum (HABS; Sigma‐Aldrich) in 96‐well plates (1 × 10⁵ cells/well). The sorted CD14+ HLA‐DR− or CD14+ HLA‐DR+ cells were added to responder cells at different ratios and cocultures were incubated for 5 days. Proliferation of T cells was measured using flow cytometry on the basis of CFSE dilution. Briefly, harvested CFSE‐labeled responder cells were washed with phosphate‐buffered saline containing 0.1% FBS and 0.1% NaN3. Five microliters of 7‐amino actinomycin D (7‐AAD) were added prior to flow cytometry analysis. Viable cells were gated based on negative 7‐AAD staining. For blocking experiments, anti‐CD86 mAb, anti‐PD‐L1 mAb (each 10 μg/mL; eBioscience) and anti‐TGF‐β neutralizing mAb (10 μg/mL; R&D Systems, Minneapolis, MN, USA) were used. The recovery rate of proliferated T cells was determined as follows: (% proliferated T cells in the presence of mAb−% proliferated T cells in the presence of control IgG)/(% proliferated T cells in T cells alone −% proliferated T cells in the presence of control IgG) × 100.
ELISA assays
For determination of IFN‐γ responses, culture supernatants from the suppression assay were collected. In contrast, supernatants from sorted CD14+ HLA‐DR− or CD14+ HLA‐DR+ cells (5 × 10⁵ cells/mL) were collected after 24 h incubation at 37°C for TGF‐β production. Samples were stored frozen at −80°C until the cytokine concentrations were determined. IFN‐γ (Thermo Fisher Scientific Inc., Rockford, IL, USA) and TGF‐β (R&D Systems Inc) ELISA were used to quantify cytokines in the supernatants according to the manufacturer's instructions.
Statistical analysis
Student's t‐test or the Mann–Whitney U‐test was performed for statistical analysis of flow cytometry data. Spearman's correlation coefficient by rank test was used for analysis of correlations. P < 0.05 was considered to be significant. Analyses were performed using Statcel2 (OMS Publishing, Tokorozawa, Japan).
Results
CD14+ HLA‐DR − and CD4+ CD25+ CD127− cells in patients with SCCHN
The proportions of CD14+ HLA‐DR− cells and CD4+ CD25+ CD127− Treg in the peripheral circulation of patients with SCCHN (Table 1) and control healthy donors were first evaluated using flow cytometry. Representative flow cytometry results for one patient and one healthy donor are shown in Figure 1. The percentage of CD14+ HLA‐DR− cells was significantly elevated in patients relative to healthy donors (Fig. 2A), whereas there was no difference in the percentage of CD14+ cells between patients and healthy donors (data not shown). Similarly, the percentage of Treg was also increased in patients (Fig. 2B). Next we investigated whether the percentage of CD14+ HLA‐DR− cells of SCCHN patients is associated with that of CD14+ cells or Treg. Interestingly, in the circulation of SCCHN patients there was no significant correlation between the percentage of CD14+ cells and CD14+ HLA‐DR− cells, whereas a significant inverse correlation was observed between the percentages of CD14+ HLA‐DR− cells and Treg (rs = −0.42: P < 0.05; Fig. 3A). This correlation was not observed in healthy donors (data not shown). Additionally, we assessed whether the patients' clinical status influenced the percentage of CD14+ HLA‐DR− cells; however, no significant associations were observed between the percentage of CD14+ HLA‐DR− cells and any clinicopathological characteristics, such as age, gender, tumor stage, tumor sites or histological differentiation (data not shown).
Figure 1.
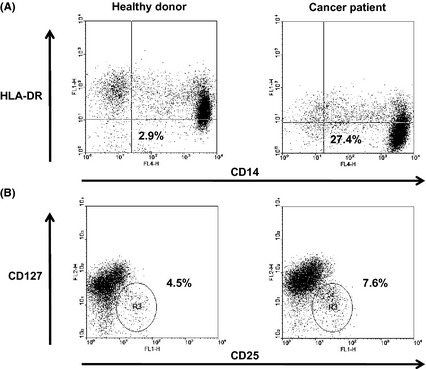
Flow cytometry analysis of circulating CD14+ HLA‐DR − cells (A) and CD4+ CD25+ CD127− Treg (B) in isolated peripheral blood mononuclear cells (PBMC). Representative data from one healthy donor and one cancer patient. For the CD14+ HLA‐DR − cells, PBMC were stained with FITC‐HLA‐DR and APC‐CD14 mAb. Flow cytometry analysis was performed with gates set on PBMC and the results presented as a percentage of CD14+ HLA‐DR − cells in PBMC. For Treg, PBMC were stained with FITC‐CD25, PE‐125 and APC‐CD4 mAb. Flow cytometry analysis was performed with gates set on CD4+ cells and the results presented as the percentage of CD25+ CD127− cells in CD4+ cells.
Figure 2.

Frequency of circulating CD14+ HLA‐DR − cells (A) and CD4+ CD25+ CD127− Treg (B) in the peripheral blood mononuclear cells (PBMC) obtained from cancer patients (n = 34) and healthy donors (n = 10). Lines indicate mean values.
Figure 3.
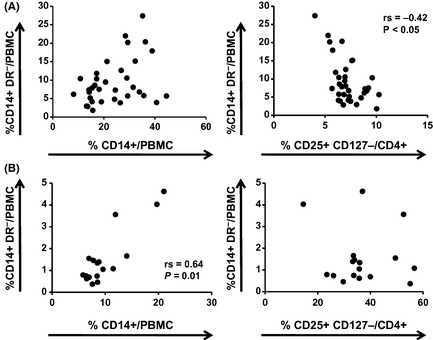
Correlation of the percentages of CD14+ HLA‐DR − cells and CD14+ cells or CD4+ CD25+ CD127− Treg in peripheral blood mononuclear cells (PBMC) (A) and tumor‐infiltrating mononuclear cells (B) in patients with squamous cell carcinoma of the head and neck. Each dot represents an individual patient.
Tumor tissues were obtained from 17 of 34 patients tested and tumor‐infiltrating mononuclear cells were isolated and then analyzed for the presence of CD14+ HLA‐DR− cells and Treg. Contrary to PBMC, in the tumor‐infiltrating mononuclear cells there was a significant correlation between the percentage of CD14+ cells and CD14+ HLA‐DR− cells (rs = 0.64: P = 0.01; Fig. 3B), but not that of CD14+ HLA‐DR− cells and Treg. In contrast, no significant correlation between the percentages of CD14+ HLA‐DR− cells or Treg in PBMC and those in tumor‐infiltrating mononuclear cells was observed (data not shown).
Suppression activity of CD14+ HLA‐DR − cells
Next we evaluated the functional capacity of CD14+ HLA‐DR− cells to suppress autologous T‐cell proliferation and IFN‐γ production. CD14+ HLA‐DR− and CD14+ HLA‐DR+ cells were sorted from PBMC of SCCHN patients and cultured with CFSE‐labeled autologous T cells stimulated with anti‐CD3/anti‐CD28 stimulus. As shown in Figure 4, CD14+ HLA‐DR− cells showed greater suppressor activity than CD14+ HLA‐DR+ cells (Fig. 4A) and inhibited the proliferation of autologous T cells in a dose‐dependent manner (Fig. 4B). Moreover, IFN‐γ production from anti‐CD3/anti‐CD28‐stimulated T cells cocultured with CD14+ HLA‐DR− cells was also significantly decreased compared with that with CD14+ HLA‐DR+ cells (Fig. 4C), indicating that CD14+ HLA‐DR− cells have more potent suppressive activity.
Figure 4.
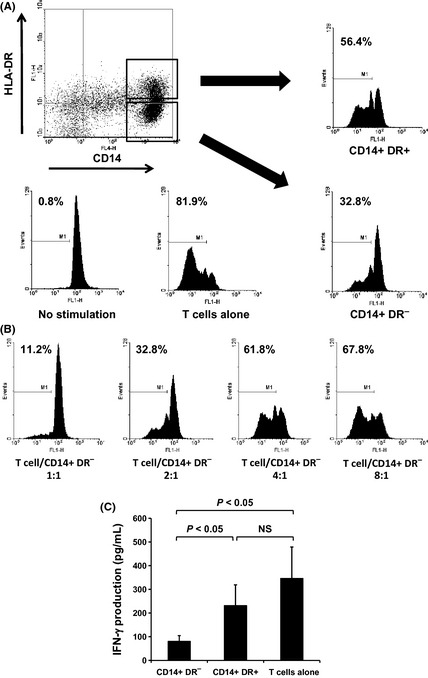
Circulating CD14+ HLA‐DR − cells from patients with squamous cell carcinoma of the head and neck (SCCHN) suppress autologous T‐cell proliferation and interferon (IFN)‐γ production. CD14+ HLA‐DR − and CD14+ HLA‐DR + cells were sorted from peripheral blood mononuclear cells of 10 patients with SCCHN and cultured with carboxyfluorescein succinimidyl ester (CFSE)‐labeled autologous T cells stimulated with anti‐CD3/anti‐CD28 stimulus. Proliferation of T cells was measured by dilution of CFSE staining intensity using flow cytometry. Representative data from one patient with SCCHN (A,B). CD14+ HLA‐DR − cells showed greater suppressor activity than CD14+ HLA‐DR + cells (T cell/CD14+ HLA‐DR − cell ratio, 2:1) (A), and inhibited the proliferation of autologous T cells in a dose‐dependent manner (B). IFN‐γ production from anti‐CD3/anti‐CD28‐stimulated T cells cocultured with CD14+ HLA‐DR − or CD14+ HLA‐DR + cells was measured using ELISA (T cell/CD14+ HLA‐DR − cell ratio, 4:1) (C).
Characterization of CD14+ HLA‐DR − cells
To further characterize CD14+ HLA‐DR− cells, we compared the expression of markers concerning T‐cell activation with CD14+ HLA‐DR+ cells. Representative histograms of the expression of surface markers on CD14+ HLA‐DR− cells are shown in Figure 5A. Both CD14+ HLA‐DR− and CD14+ HLA‐DR+ cells expressed CD86 and PD‐L1, but not CD40, CD80 and PD‐L2. Interestingly, expression of CD86 and PD‐L1 on CD14+ HLA‐DR− cells was significantly higher than that on CD14+ HLA‐DR+ cells (Fig. 5B).
Figure 5.
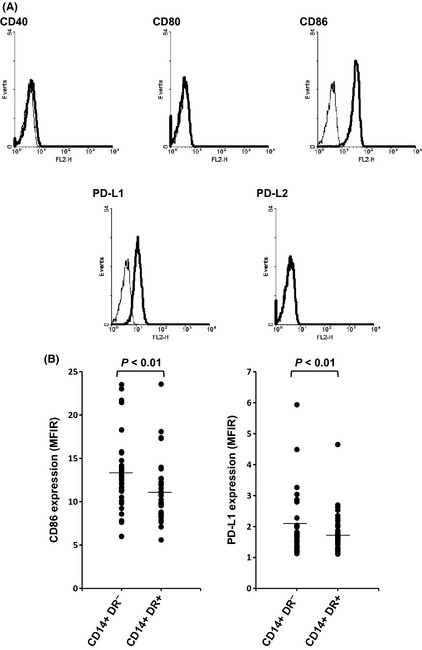
Expression of costimulatory molecules on CD14+ HLA‐DR − cells. Flow cytometry was performed as described in the Materials and Methods. Representative data of CD14+ HLA‐DR − cells obtained from one cancer patient (A). Expression of CD86 and PD‐L1 on CD14+ HLA‐DR − and CD14+ HLA‐DR + cells in peripheral blood mononuclear cells (PBMC) obtained from patients with squamous cell carcinoma of the head and neck (B). Lines indicate mean values. MFIR, mean fluorescence intensity ratio.
Suppressive mechanisms of CD14+ HLA‐DR − cells
The suppressive mechanisms used by CD14+ HLA‐DR− cells remain under investigation in humans. To date, MDSC have been shown to use a variety of mechanisms to suppress tumor immunity, including arginase I, reactive oxygen species, indoleamine‐2,3‐dioxygenase and TGF‐β; therefore, TGF‐β production from CD14+ HLA‐DR− cells was investigated. As expected, TGF‐β secretion from CD14+ HLA‐DR− cells was significantly higher than CD14+ HLA‐DR+ cells (Fig. 6A). Next, the potential role of CD86, PD‐L1 and TGF‐β in the suppressive function of CD14+ HLA‐DR− cells was investigated through the use of blocking and neutralizing mAb. Interestingly, addition of anti‐CD86 mAb, anti‐PD‐L1 mAb and anti‐TGF‐β mAb did not completely but partially restored T‐cell proliferation and IFN‐γ production, respectively (Fig. 6B–D). Thus, the suppressive effects of CD14+ HLA‐DR− cells appear to be mediated by various molecules, including costimulatory molecules and cytokines.
Figure 6.

Suppressive mechanisms of CD14+ HLA‐DR − cells obtained from patients with squamous cell carcinoma of the head and neck (SCCHN). TGF‐β production from CD14+ HLA‐DR − and CD14+ HLA‐DR + cells. Bars indicate mean values derived from five independent patients (A). Supernatants from sorted CD14+ HLA‐DR − or CD14+ HLA‐DR + cells (5 × 10⁵ cells/mL) were collected after 24 h incubation at 37°C and cytokine concentrations were determined using ELISA. The role of CD86, PD‐L1 and TGF‐β in the suppressive function of CD14+ HLA‐DR − cells obtained from patients with SCCHN. Anti‐CD86 mAb, anti‐PD‐L1 mAb and anti‐TGF‐β neutralizing mAb were added for blocking experiments. Representative data from one patient with SCCHN (B: T‐cell proliferation; C: IFN‐γ production, T cell/CD14+ HLA‐DR − cell ratio, 4:1). The recovery rate of proliferated T cells by addition of anti‐CD86 mAb, anti‐PD‐L1 mAb and anti‐TGF‐β neutralizing mAb (D). Proliferation of T cells was measured by dilution of CFSE staining intensity using flow cytometry. Data are the mean of five independent patients.
Discussion
Tumor‐induced immune suppression in cancer patients is a major problem that not only promotes tumor progression, but also severely impairs the efficacy of cancer immunotherapy. The MDSC are thought to play a pivotal role in the regulation of antitumor immune responses in conjunction with Treg. Squamous cell carcinoma of the head and neck is known to be highly immunosuppressive and human MDSC equivalents were described for the first time in the peripheral blood of patients with SCCHN.15 In the present study, we characterized CD14+ HLA‐DR− cells that circulate in peripheral blood and infiltrate tumor tissue in patients with SCCHN. As described in patients with cancers other than SCCHN,11, 12, 13 we also observed a significant increase of the percentages of CD14+ HLA‐DR− cells as well as CD4+ CD25+ CD127− Treg in the peripheral blood of SCCHN patients compared with healthy donors. In the present study, the proportion of CD14+ HLA‐DR− cells did not correlate with any clinicopathological characteristics including tumor stage. With regard to other subsets of MDSC in patients with SCCHN, Diaz‐Montero et al.9 have shown a significant correlation between circulating MDSC (Lin−HLA‐DR− CD33+ CD11b+) and clinical cancer stage in various solid tumor patients including SCCHN. In contrast, Almand et al.16 have reported that a significant correlation between the presence of Lin−HLA‐DR− cells and the stage of disease or duration of the disease was not found in patients with SCCHN. More samples in each cancer group might be required for definitive resolution of whether tumor progression contributes to the abundance of MDSC. In the circulation of SCCHN patients, there was no significant correlation between the percentage of CD14+ cells and CD14+ HLA‐DR− cells, whereas in tumor‐infiltrating mononuclear cells there was a significant correlation between the percentage of CD14+ cells and CD14+ HLA‐DR− cells. This result suggests that in the tumor microenvironment, CD14+ HLA‐DR− cells are accumulated and/or expanded. Squamous cell carcinoma of the head and neck is known to secrete various molecules, including proinflammatory cytokines, angiogenic factors and chemoattractant factors.17 CD14+ HLA‐DR− cells are also likely to be recruited into the tumor site through such molecules. Although several data from murine experiments clearly indicate that MDSC can generate and expand Treg through TGF‐β, IL‐10 and/or arginase metabolism,18, 19, 20 in humans it is still unclear. Recently, Hoechst et al.11 demonstrated that CD14+ HLA‐DR− cells from hepatocellular carcinoma patients induced a CD4+ CD25+ Foxp3+ Treg population when cocultured with autologous T cells, suggesting that CD14+ HLA‐DR− cells contribute to tumor‐associated immune tolerance together with Treg. However, in peripheral blood, an inverse correlation between the percentages of CD14+ HLA‐DR− cells and Treg was observed. One possibility is that in the periphery a form of homeostasis by these two circulating immune suppressive cells might be maintained even in cancer patients.
To further characterize CD14+ HLA‐DR− cells in patients with SCCHN, we examined their ability to suppress T‐cell proliferation. As expected, CD14+ HLA‐DR− cells were able to suppress effectively both the proliferation and IFN‐γ production of anti‐CD3/anti‐CD28‐stimulated T cells. These results strongly suggest that CD14+ HLA‐DR− cells in SCCHN patients contribute to the immune suppressive status as monocytic MDSC. The mechanisms of immune suppression by MDSC, including arginase, upregulation of reactive oxygen species, as well as the production of immunosuppressive cytokines, are diverse21, 22 and the immune suppression mechanisms of CD14+ HLA‐DR− cells remain controversial. For instance, CD14+ HLA‐DR− cells in hepatocellular carcinoma patients had high arginase activity; however, they did not secrete TGF‐β.11 In contrast, in melanoma patients, suppressive activity of CD14+ HLA‐DR− cells was mediated by TGF‐β, whereas no involvement of arginase could be detected.12 In the present study, CD14+ HLA‐DR− cells in SCCHN patients showed higher gene expression of arginase I (data not shown) and higher secretion of TGF‐β than CD14+ HLA‐DR− cells. The MDSC are driven by tumor‐derived factors and different tumors secrete different combinations of molecules; therefore, the characteristics of MDSC might be different in each malignancy.
Additional characterizations showed that CD14+ HLA‐DR− cells expressed a higher level of CD86 and PD‐L1, whereas other costimulatory molecules, namely, CD40, CD80 and PD‐L2, were not detected. Moreover, blocking CD86 or PD‐L1 partially restored T‐cell proliferation and IFN‐γ production. CD86 can either costimulate or coinhibit immune responses through interactions with the receptors CD28 and CTLA‐4.23 One possibility is that CD86 on CD14+ HLA‐DR− cells would provide coinhibitory signals upon binding CTLA‐4 expressed on activated T cells. In contrast, an extensive CD28 costimulatory signal has been shown to be required for the induction of Treg activation and prevention of Treg apoptosis.24 Thus, CD86 on MDSC might play an important role in immunological tolerance. In fact, in hepatocellular carcinoma patients, CD14+ HLA‐DR− cells expressing CD86 induced a CD4+ CD25+ Foxp3+ Treg population.11 PD‐L1 is known to be an immunosuppressive molecule; therefore, it was not unexpected to find that PD‐L1 expression on CD14+ HLA‐DR− cells upregulated and contributed to their potent suppressor activity. Rodrigues et al.25 have also found that monocytes exposed to glioma cells have immunosuppressive, MDSC‐like properties and increased B7‐H1 (PD‐L1) expression. Thus, the preferential expression of CD86 and PD‐L1 could confer additional immunosuppressive properties on CD14+ HLA‐DR− cells in SCCHN patients. Of note, it is important to recognize that blockade of CD86 and PD‐L1 does not completely reverse immunosuppression by MDSC, and other mechanisms, including TGF‐β and arginase I, also contribute to this state. Heterogeneity and multiple immunosuppressive mechanisms of MDSC are major hurdles to target these cells in cancer patients. Nevertheless, several approaches, such as the use of chemotherapeutic agents and induction of the differentiation of MDSC, have been described for the deletion of MDSC. For instance, 5‐fluorouracil and gemcitabine are selectively cytotoxic on MDSC whereas no significant effect on T cells, NK cells and dendritic cells is observed.26 Treatment of sunitinib results in a significant reduction in MDSC.27 Alternatively, all‐trans‐retinoic acid is able to induce the differentiation of MDSC into functional dendritic cells (DC) or macrophages, which are capable of stimulating effector T cells;28, 29, 30 however, to make MDSC suitable clinical targets, more detailed characterizations of MDSC are necessary.
Taken together, our data suggest that in patients with SCCHN, CD14+ HLA‐DR− cells act as potent immunosuppressive cells and particularly contribute to tumor escape from the host immune system. Accordingly, the development of novel strategies to efficiently overcome immune suppression mediated by MDSC, including CD14+ HLA‐DR− cells, is urgently needed.
Disclosure Statement
The authors have no conflict of interest.
Acknowledgments
This work was supported in part by grants‐in‐aid (23592523 to K.C. and 21791606 to T.Y.) from the Ministry of Education, Cultures, Sports, Science and Technology of Japan.
References
- 1. Whiteside TL. Immune responses to malignancies. J Allergy Clin Immunol 2010; 125: S272–83. [DOI] [PMC free article] [PubMed] [Google Scholar]
- 2. Talmadge JE. Immune cell infiltration of primary and metastatic lesions: mechanisms and clinical impact. Semin Cancer Biol 2011; 21: 131–8. [DOI] [PubMed] [Google Scholar]
- 3. Poschke I, Mougiakakos D, Kiessling R. Camouflage and sabotage: tumor escape from the immune system. Cancer Immunol Immunother 2011; 60: 1161–71. [DOI] [PMC free article] [PubMed] [Google Scholar]
- 4. Gabrilovich DI, Nagaraj S. Myeloid‐derived suppressor cells as regulators of the immune system. Nat Rev Immunol 2009; 9: 162–74. [DOI] [PMC free article] [PubMed] [Google Scholar]
- 5. Fujimura T, Mahnke K, Enk AH. Meyloid derived suppressor cells and their role in tolerance induction in cancer. J Dermatol Sci 2010; 59: 1–6. [DOI] [PubMed] [Google Scholar]
- 6. Peranzoni E, Zilio S, Marigo I et al Myeloid‐derived suppressor cell heterogeneity and subset definition. Curr Opin Immunol 2010; 22: 238–44. [DOI] [PubMed] [Google Scholar]
- 7. Greten TF, Manns MP, Korangy F. Myeloid derived suppressor cells in human diseases. Int Immunopharmacol 2011; 11: 802–7. [DOI] [PMC free article] [PubMed] [Google Scholar]
- 8. Zea AH, Rodriguez PC, Atkins MB et al Arginase‐producing myeloid suppressor cells in renal cell carcinoma patients: a mechanism of tumor evasion. Cancer Res 2005; 65: 3044–8. [DOI] [PubMed] [Google Scholar]
- 9. Diaz‐Montero CM, Salem ML, Nishimura MI, Garrett‐Mayer E, Cole DJ, Montero AJ. Increased circulating myeloid‐derived suppressor cells correlate with clinical cancer stage, metastatic tumor burden, and doxorubicin‐cyclophosphamide chemotherapy. Cancer Immunol Immunother 2009; 58: 49–59. [DOI] [PMC free article] [PubMed] [Google Scholar]
- 10. Liu CY, Wang YM, Wang CL et al Population alterations of L‐arginase‐ and inducible nitric oxide synthase‐expressed CD11b+/CD14‐/CD15 + /CD33 + myeloid‐derived suppressor cells and CD8 + T lymphocytes in patients with advanced‐stage non‐small cell lung cancer. J Cancer Res Clin Oncol 2010; 110: 36–45. [DOI] [PMC free article] [PubMed] [Google Scholar]
- 11. Hoechst B, Ormandy LA, Ballmaier M et al A new population of myeloid‐derived suppressor cells in hepatocellular carcinoma patients induces CD4 + CD25 + Foxp3 + T cells. Gastroenterology 2008; 135: 234–43. [DOI] [PubMed] [Google Scholar]
- 12. Filipazzi P, Valenti R, Huber V et al Identification of a new subset of myeloid suppressor cells in peripheral blood of melanoma patients with modulation by a granulocyte‐macrophage colony‐stimulation factor‐based antitumor vaccine. J Clin Oncol 2007; 25: 2546–53. [DOI] [PubMed] [Google Scholar]
- 13. Vuk‐Pavlovic S, Bulur PA, Lin Y et al Immunosuppressive CD14 + HLA‐DRlow/‐ monocytes in prostate cancer. Prostate 2010; 70: 443–55. [DOI] [PMC free article] [PubMed] [Google Scholar]
- 14. Tomiyama H, Matsuda T, Takiguchi M. Differentiation of human CD8 + T cells from a memory to memory/effector phenotype. J Immunol 2002; 168: 5538–50. [DOI] [PubMed] [Google Scholar]
- 15. Pak AS, Wright MA, Matthews JP, Collins SL, Petruzzelli GJ, Young MR. Mechanisms of immune suppression in patients with head and neck cancer: presence of CD34(+) cells which suppress immune functions within cancers that secrete granulocyte‐macrophage colony‐stimulating factor. Clin Cancer Res 1995; 1: 95–103. [PubMed] [Google Scholar]
- 16. Almand B, Resser JR, Lindman B et al Clinical significance of defective dendritic cell differentiation in cancer. Clin Cancer Res 2000; 6: 1755–66. [PubMed] [Google Scholar]
- 17. Young MR, Wright MA, Lozano Y, Matthew JP, Benefield J, Prechel MM. Mechanisms of immune suppression in patients with head and neck cancer: influence on the immune infiltrate of the cancer. Int J Cancer 1996; 29: 333–8. [DOI] [PubMed] [Google Scholar]
- 18. Huang B, Pan PY, Li Q et al Gr‐1 + CD115 + immature myeloid suppressor cells mediate the development of tumor‐induced T regulatory cells and T‐cell anergy in tumor‐bearing host. Cancer Res 2006; 66: 1123–31. [DOI] [PubMed] [Google Scholar]
- 19. Serafini P, Mgebroff S, Noonan K, Borrello I. Myeloid‐derived suppressor cells promote cross‐tolerance in B‐cell lymphoma by expanding regulatory T cells. Cancer Res 2008; 68: 5439–49. [DOI] [PMC free article] [PubMed] [Google Scholar]
- 20. Ghiringhelli F, Puig PE, Roux S et al Tumor cells convert immature myeloid dendritic cells into TGF‐β‐secreting cells inducing CD4 + CD25 + regulatory T cell proliferation. J Exp Med 2005; 202: 919–29. [DOI] [PMC free article] [PubMed] [Google Scholar]
- 21. Kusmartsev S, Gabrilovich DI. Role of immature myeloid cells in mechanisms of immune evasion in cancer. Cancer Immunol Immunother 2006; 55: 237–45. [DOI] [PMC free article] [PubMed] [Google Scholar]
- 22. Ostrand‐Rosenberg S. Myeloid‐derived suppressor cells: more mechanisms for inhibiting antitumor immunity. Cancer Immunol Immunother 2010; 59: 1593–600. [DOI] [PMC free article] [PubMed] [Google Scholar]
- 23. Collins M, Ling V, Carreno BM. The B7 family of immune‐regulatory ligands. Genome Biol 2005; 6: 223. [DOI] [PMC free article] [PubMed] [Google Scholar]
- 24. Hombach AA, Kofler D, Hombach A, Rappl G, Abken H. Effective proliferation of human regulatory T cells requires a strong costimulatory CD28 signal that cannot be substituted by IL‐2. J Immunol 2007; 179: 7924–31. [DOI] [PubMed] [Google Scholar]
- 25. Rodrigues JC, Gonzalez GC, Zhang L et al Normal human monocytes exposed to glioma cells acquire myeloid‐derived suppressor cell‐like properties. Neuro Oncol 2010; 12: 351–65. [DOI] [PMC free article] [PubMed] [Google Scholar]
- 26. Vincent J, Mignot G, Chalmin F et al 5‐fluorouracil selectively kills tumor‐associated myeloid‐derived suppressor cells resulting in enhanced T cell‐dependent antitumor immunity. Cancer Res 2010; 70: 3052–61. [DOI] [PubMed] [Google Scholar]
- 27. Ko JS, Zea AH, Rini B et al Sunitinib mediates reversal of myeloid‐derived suppressor cell accumulation in renal cell carcinoma patients. Clin Cancer Res 2009; 15: 2148–57. [DOI] [PubMed] [Google Scholar]
- 28. Almand B, Clark JI, Nikitina E et al Increased production of immature myeloid cells in cancer patients: a mechanism of immunosuppression in cancer. J Immunol 2001; 166: 678–89. [DOI] [PubMed] [Google Scholar]
- 29. Kusmartsev S, Su Z, Heiser A et al Reversal of myeloid cell‐mediated immunosuppression in patients with metastatic renal cell carcinoma. Clin Cancer Res 2008; 14: 8270–8. [DOI] [PubMed] [Google Scholar]
- 30. Nefedove Y, Fishman M, Sherman S, Wang X, Beg AA, Gabrilovich DI. Mechanism of all‐trans retinoic acid effect on tumor‐associated myeloid‐derived suppressor cells. Cancer Res 2003; 63: 4441–9. [DOI] [PubMed] [Google Scholar]