Abstract
Estrogens are involved in the complex regulation of cell proliferation and apoptosis of hormone sensitive tumors including breast and endometrial cancers. Sulfation is the main pathway for estrogen metabolism, which is believed to be involved in the inactivation of estrogens in target tissues. SULT1E1 and PAPSS (PAPSS1 and PAPSS2) are responsible for the estrogen sulfation by providing catalyzing enzyme and universal sulfate donor. The present study showed the expression patterns of SULT1E1 and PAPSS in the breast and endometrial tissues by tissue array analysis and the assessment of clinical samples. The estrogen sulfation enzymes were comparatively higher in the tumorous tissues than their adjacent normal tissues. SULT1E1 overexpression inhibited the tumorigenesis in subcutaneous xenograft model. By CCK‐8 assay and flow cytometry assay, overexpression of SULT1E1 and PAPSS1 by adenovirus blocked the estrogen pro‐proliferating effect and promoted cell apoptosis induced by H 2 O 2 in MCF‐7 cells. By real‐time reverse transcription‐polymerase chain reaction and western‐blot assays, overexpression of SULT1E1 and PAPSS1 suppressed cell growth and triggered apoptosis by downregulating the levels of c‐myc, cyclin D1 and bcl‐2, meanwhile, upregulating bax expression. In conclusion, the discrepancies in expressions of SULT1E1 and PAPSS between breast and endometrial tumorous tissues and their adjacent normal tissues were prominent. Overexpression of SULT1E1 and PAPSS1 retarded MCF‐7 cells growth in vivo and in vitro by arresting cell cycles and inducing apoptosis. Thus, targeting SULT1E1 and PAPSS expressions might be an important approach for estrogen‐dependent cancers. (Cancer Sci 2012; 103: 1000–1009)
Estrogens are involved in the complex regulation of cell proliferation and apoptosis of hormone sensitive tumors including breast and endometrial cancers.1, 2, 3 Through genomic and/or non‐genomic signaling pathway, estrogen exerts its biological responses by binding to estrogen receptors.4, 5 The concentration of free estrogens in breast cancer and endometrial cancer cells can be affected by the estrogen metabolism. Then the estrogens metabolism is closely associated with the carcinogenesis and progression of breast and endometrial cancers.
Sulfation is the main pathway for estrogen metabolism, which is believed to be involved in the inactivation of estrogens in target tissues.6 Sulfation is catalyzed by a group of sulfotransferases, which are Phase II drug metabolizing enzymes.7, 8 Human SULT1E1 (hSULT1E1), also known as estrogen sulfotransferase, catalyzes the sulfation of estrone and estradiol with extremely high efficiency. Sulfation of active 17β‐estradiol (E2) forms inactive estradiol sulfate, which can be reactivated following desulfation by estrogen sulfatase.9 The universal sulfuryl group donor (co‐substrate) for SULT‐catalyzed sulfation is adenosine 3′‐phosphate 5′‐phosphosulfate (PAPS). The reaction products are a sulfated product and adenosine 3′, 5′‐diphosphate (PAP).10, 11 The PAPS is synthesized by PAPS synthesized enzymes (PAPSS), which include two isoforms, PAPSS1 and PAPSS2.12, 13
To date, some studies have demonstrated that SULT1E1 is expressed in breast and endometrial tissues and investigated the correlation between SULT1E1 and the risk of breast cancer and endometrial cancer, which are estrogen‐dependent cancers. It was reported that common single nucleotide polymorphisms (SNP) in SULT1E1 influenced the risk and the survival of breast cancer and endometrial cancer,9, 14 which indicated the significance of SUlT1E1 in the tumorigenesis. Whether PAPSS plays a role in the tumor development is uncertain. Therefore, our aim of the study is to determine the expression patterns of SULT1E1, PAPSS1 and PAPSS2 in the tumor tissues and the adjacent normal tissues, and investigate the effects of SULT1E1 and PAPSS1 on the proliferation and apoptosis in breast cancer cells and their underlying mechanisms. Our study will illustrate the role of estrogen sulfation enzymes in the estrogen responsive tumor development.
Materials and Methods
Tissue array and immunohistochemical staining
Breast tissue microarray and endometrial tissue microarray (60 spots each array, containing both tumor and adjacent normal tissues from 30 breast cancer and 30 endometrial cancer patients, respectively) were obtained from Shanghai Biochip Co. (Shanghai, China). SULT1E1, PAPSS1 and PAPSS2 expressions were assayed by immunohistochemistry. The sections were incubated with primary antibody at 37°C for 1 h, followed by incubation with a horseradish peroxidase‐conjugated secondary antibody at 37°C for 1 h. The signals were detected using diaminobenzidine substrate kit (Vector Laboratories, Burlingarne, CA, USA). Rabbit anti‐human polyclonal antibody against SULT1E1 (1:25 dilution; Proteintech Group, Chicago, IL, USA), rabbit anti‐human polyclonal antibody against PAPSS2 (1:25 dilution; Abcam, Cambridge, MA, USA), goat anti‐human polyclonal antibody against PAPSS1 (1:25 dilution; Santa Cruz Biotechnology, Santa Cruz, CA, USA), and rabbit anti‐human polyclonal antibody Estrogen Receptor α (ER α, 1:50 dilution; Cell Signal Technology, Boston, MA, USA) were used as the first antibodies.
An immunohistochemical scoring (IHS) was used to value SULT1E1, PAPSS1 and PAPSS2 expressions in tissues. This method was based on the German ImmunoReactive score for image analysis‐based scoring systems.15 Scoring criteria for quantity (the estimated proportion of staining in the cytoplasm or nuclei of cells that were positively stained) were as follows: score = 0, none; score = 1, 1–25%; score = 2, 26–50%; score = 3, 51–75%; score = 4, 76–100%. An intensity score represented the average intensity of the positive cells, as follows: 0 (none); 1 (weak); 2 (intermediate); and 3 (strong). The proportion and intensity scores were then multiplied to obtain a total score, which could range from 0 to 12.
Clinical samples collection
Eighteen cases of breast tissue samples were obtained from Breast Surgery of Fudan University affiliated Hua'shan hospital. Tumor tissue, para‐tumor tissue and normal tissue were involved in each case.
Cell culture
Breast adenocarcinoma cell line MCF‐7 were obtained from the American Type Culture Collection and maintained in Dulbecco's modified Eagle's medium (DMEM) supplemented with 10% fetal calf serum (FCS; Gibco, Carlsbad, CA, USA). The cells were incubated in 5% CO2 at 37°C and 95% humidity. Cell cultures of 60–80% confluence were used for experiments. Prior to experiments, MCF‐7 cells were cultured for 24 h in phenol red‐free medium containing 5% dextran‐coated charcoal‐treated serum (Hyclone, Logan, UT, USA), followed by an incubation in phenol red‐free, serum‐free medium, for indicated experiments.
Construction of adenovirus encoding human SULT1E1 and human PAPSS1 genes
The recombinant adenovirus Ad‐CMV‐SULT1E1 was generated by homologous recombination in HEK‐293 cells. The full length of hSULT1E1 gene was cloned into pEGFP‐N1 vector, and then subcloned into pDC315‐EGFP adenovirus vector. The recombinant adenoviruses encoding human PAPSS1 were prepared as described.16 Ad‐CMV‐EGFP virus encoding enhanced green‐fluorescence protein (EGFP) was used as control.
Determination of mRNA levels by Real‐time quantitative RT‐PCR assay
Total RNA was extracted using the TRIZOL reagent (Invitrogen, Carlsbad, CA, USA) according to the supplier's instructions. Specific mRNA levels were determined by Real‐time reverse transcription‐polymerase chain reaction (RT‐PCR) as previously described.17, 18 Specific primer pairs in the experiment were listed in Table 1, and referenced in the primer bank.19
Table 1.
Primer pairs used to amplify polymerase chain reaction (PCR) products
| NCBI gene ID | Gene name | Forward primer (5′‐3′) | Reverse primer (5′‐3′) |
|---|---|---|---|
| NM_002046.3 | GAPDH | TGTTGCCATCAATGACCCCTT | CTCCACGACGTACTCAGCG |
| NM_005420.2 | SULT1E1 | GGCTGGTCATCCAAATCCTGG | AGGAACCATAAGGAACCTGTCC |
| NM_005443.4 | PAPSS1 | GCAGATGCTGGCTTAGTGTG | GCGATCCTGAGTGTAAGGTGA |
| NM_001015880.1 | PAPSS2 | CCATGTGAGCAGGAATAAGAGAG | CACACGGTACATCCTCGGAAC |
| NM_002467.4 | c‐myc | TGGTCGCCCTCCTATGTTG | CCGGGTCGCAGATGAAACTC |
| NM_053056.2 | cyclin D1 | GCTGCGAAGTGGAAACCATC | CCTCCTTCTGCACACATTTGAA |
| NM_000657.2 | Bcl‐2 | GCCTTCTTTGAGTTCGGTGG | ATCTCCCGGTTGACGCTCT |
| NM_004324.3 | Bax | CCCGAGAGGTCTTTTTCCGAG | CCAGCCCATGATGGTTCTGAT |
NCBI, National Center for Biotechnology Information.
Determination of protein levels by western‐blot assay
After indicated treatment, cells were harvested in radioimmune precipitation assay (RIPA) lysis buffer. Proteins were separated by 10% sodium dodecyl sulfate‐polyacrylamide gel electrophoresis (SDS‐PAGE) to detect the target protein levels and beta‐actin was used as the control.17 The band densities were quantified by densitometry using the software of GIS (Bio‐Tanon, Shanghai, China).
Murine xenograft model for tumorigenicity assay
Six‐week‐old female BALB/c‐nude mice were used for experimental tumorigenicity assays. To facilitate estrogen‐dependent xenograft establishment, each mouse received 17‐estradiol (0.72 mg/pellet, 60 day release; Innovative Research of America) i.p.20 One week after treatment, 5 × 10⁶ MCF‐7 cells were injected in the fat pad of each mouse. Xenograft model was established when animals had developed solid tumors of about 200 mm3, and treatment was initiated. The nude mice were randomized into two groups: vehicle adenovirus Ad‐GFP and Ad‐SULT1E1 (5 × 10⁸ pfu/mouse, n = 6 each group), and injected around the tumor every 4 days. Mice were weighed and the tumor width (W) and length (L) were measured on the day of injection. Tumor volume was estimated according to the standard formula: V = π/6 × L × W2. Observation continued until day 12. Tumors were excised from the animals, frozen and stored at −80°C.
In vitro cell proliferation assay
Cell proliferation was assessed by CCK‐8 assay according to the manufacturer's instruction (Dojindo Laboratories, Gaithersburg, MD, USA). Cells in a 96‐well plate were incubated in 10 μL CCK‐8 solution for 1 h at 37°C. Absorbance of each well was quantified at 450 nm with an automated ELISA reader (Bio‐Tech Instruments, Winooski, VT, USA).
Flow cytometry for cell apoptosis assay
MCF‐7 cells treatment by Ad‐SULT1E1 and (or) Ad‐PAPSS1 were incubated with E2 for 48 h, then cells were induced by 1 mM H2O2 for 6 h. Treated cells were collected, washed twice with ice‐cold PBS, digested by trypsin and resuspended in 1× binding buffer at a concentration of 1 × 10⁶ cells/mL, incubated with Annexin V‐APC and 7‐ADD for 15 min at room temperature in darkness according to the instructions of the apoptosis detection kit (BD Pharmingen, San Diego, CA, USA), and then analyzed by flow cytometry within 1 h.
Estrogen sulfation assay
The assay was carried out according to the method described by Saruwatari et al.21 Briefly, treated MCF‐7 cells by Ad‐GFP, Ad‐SULT1E1, Ad‐PAPSS1 and Ad‐SULT1E1/Ad‐PAPSS1 were cultured in 24‐well plates with 500 μL culture medium. After 48 h, cells were incubated with 1, 10, 100 or 1000 nM cold estrogen combined with 10 nM [3H] E2 (40 Ci/mmol; PerkinElmer, San Jose, CA, USA) for sulfation assay. Aliquots (50 μL) of the medium were sampled at various times (4–48 h) and 50 μL of 0.25 M Tris–HCl (pH 8.7) and 1 mL of water‐saturated chloroform were added to the samples. After mixing and centrifugation, aliquots (50 μL) of aqueous phase (E2S) were subjected to liquid scintillation counting. The activity of estrogen sulfotransferase was calculated from a data point within the initial rate period and corrected by the protein contents.
Statistical analysis
Data from three or more separate experiments were presented as mean ± standard error of the mean (SEM). Analysis of variance (anova) and the independent‐samples t‐test were performed by SPSS 11.0 software (SPSS 11.0 Inc, Chicago, IL, USA). Statistical significance was defined as P < 0.05.
Results
Tissue array analysis of SULT1E1, PAPSS1 and PAPSS2 in 30 cases of breast cancer
Among the 30 cases of breast cancer, 16 cases of ER positive and 14 cases of ER negative samples were involved. The representative staining of SULT1E1 (Fig. 1a,b), PAPSS1 (Fig. 1d,e) and PAPSS2 (Fig. 1g,h) in the adjacent normal breast tissues and tumorous tissues were presented. SULT1E1 were expressed in the cytoplasm of the cells exclusively. As shown in Figure 1(c), by IHS (immunohistochemical scoring), the summarized scores of SULT1E1 expression in the breast tumor tissues were significantly higher than the adjacent normal breast tissues in either ER positive cases or ER negative cases (P < 0.01). In most of the spots, PAPSS1 was located in the cytoplasm of the cells exclusively. But in eight spots, PAPSS1 was expressed both in the cytoplasm and nuclei. As shown in Figure 1(f), the summarized scores of PAPSS1 expression in the breast tumor tissues were significantly higher than the adjacent normal breast tissues in either ER positive cases or ER negative cases (P < 0.01). As shown in Figure 1(i), PAPSS2 levels in the breast tumor tissues were dramatically higher than those of the adjacent normal breast tissues in both ER positive and ER negative cases (P < 0.01).
Figure 1.
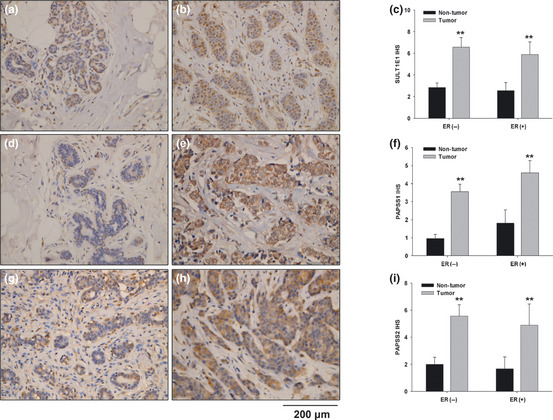
Tissue array analysis of SULT1E1, PAPSS1 and PAPSS2 in 30 cases of breast cancer. Representative staining of SULT1E1 (a,b), PAPSS1 (d,e) and PAPSS2 (g,h) in the adjacent normal breast tissues and tumorous tissues were shown respectively. The immunohistochemical scores of SULT1E1, PAPSS1 and PAPSS2 in the breast tissue assay are summarized as the normalized means of scores ± standard error (SE) in (c,f) and (i), respectively. **P < 0.01 versus adjacent normal breast tissues.
Tissue array analysis of SULT1E1, PAPSS1 and PAPSS2 in 30 cases of endometrial cancer
Among the 30 cases of endometrial cancer, 15 cases of ER positive and 15 cases of ER negative samples were involved. The representative staining of SULT1E1 (Fig. 2a,b), PAPSS1 (Fig. 2d,e) and PAPSS2 (Fig. 2g,h) in the adjacent normal endometrial tissues and tumorous tissues were presented. SULT1E1 was expressed in the cytoplasm of the cells exclusively. As shown in Figure 2(c), the summarized scores of SULT1E1 expression in the endometrial tumor tissues were significantly higher than the adjacent normal endometrial tissues only in the ER positive cases (P < 0.05), but not in the ER negative cases. In 35 spots, PAPSS1 was located in the cytoplasm exclusively. But in 25 spots, PAPSS1 was expressed in both the cytoplasm and nuclei. There was no significant difference between PAPSS1 expression in the endometrial tumor tissues and those of adjacent normal endometrial tissues in either ER positive cases or ER negative cases (Fig. 2f). As shown in Figure 2(i), PAPSS2 levels in the endometrial tumor tissues were dramatically higher than those of the adjacent normal endometrial tissues in ER positive cases (P < 0.05), but not in ER negative cases.
Figure 2.
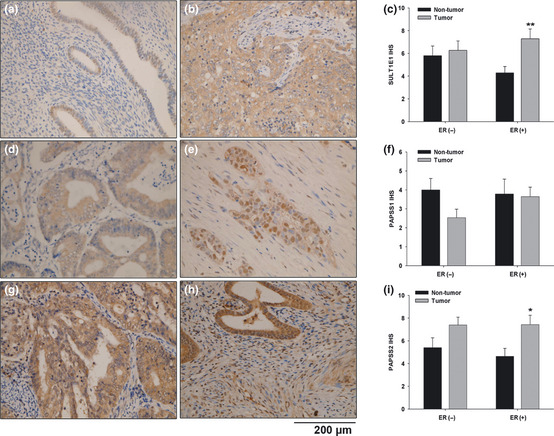
Tissue array analysis of SULT1E1, PAPSS1 and PAPSS2 in 30 cases of endometrial cancer. Representative staining of SULT1E1 (a,b), PAPSS1 (d,e) and PAPSS2 (g,h) in the adjacent normal endometrial tissues and tumorous tissues were shown, respectively. The immunohistochemical scores of SULT1E1, PAPSS1 and PAPSS2 in the endometrial tissue assay are summarized as the normalized means of scores ± standard error (SE) in (c,f) and (i), respectively. *P < 0.05 versus adjacent normal endometrial tissues; **P < 0.01 versus adjacent normal endometrial tissues.
The expressions of SULT1E1, PAPSS1 and PAPSS2 in clinical breast tissue samples
To further confirm the expression profiles of SULT1E1, PAPSS1 and PAPSS2 in breast tissues. 54 specimens from 18 cases of breast cancer patients were collected. Tumor tissue, para‐tumor tissue and normal tissue were involved in each case. Compared with normal breast tissues and adjacent tissues, mRNA (Fig. 3a) and protein levels (Fig. 3b,c) of SULT1E1, PAPSS1 and PAPSS2 were higher in the breast cancer tissues than in normal breast tissues, which were in accordance with analysis of breast tissue array.
Figure 3.
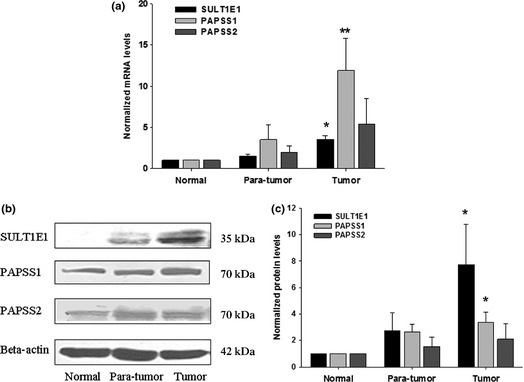
Expressions of SULT1E1, PAPSS1 and PAPSS2 enzymes in clinical breast tissue samples. The mRNA and protein expressions in normal, para‐tumor and tumor tissues are shown in (a) and (b), respectively. The protein levels were normalized to the internal control and represented as the means of results from different samples ± standard error (SE) (c). **P < 0.01 versus normal tissues.
SULT1E1 overexpression inhibit the tumorigenesis in subcutaneous xenograft model
To study the effect of SULT1E1 on the tumorigenesis in vivo, we established a subcutaneous xenograft model in nude mice. SULT1E1 adenovirus was injected around the tumor as described in the Materials and Methods. Compared with the Ad‐GFP group, the tumor volumes of the Ad‐SULT1E1 group decreased dramatically starting from day 8 to day 12 (Fig. 4b), which was accompanied by no significant decrease in body weight (Fig. 4a).
Figure 4.
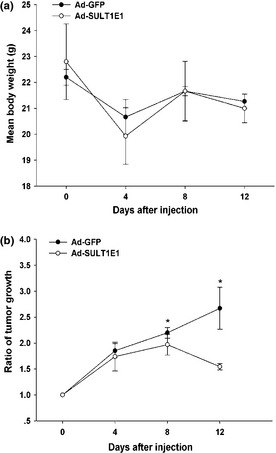
The effect of SULT1E1 on the tumorigenesis in subcutaneous xenograft model after the injection of adenovirus‐SULT1E1 around the tumor. The mean body weight in tumor of nude mice is shown in (a). The tumor growth curve was represented in (b). *P < 0.05 versus the day of first injection.
Effects of SULT1E1 and/or PAPSS1 overexpression on cell growth and apoptosis in MCF‐7 cells in the absence or presence of 17β‐estradiol
To investigate the effects of SULT1E1 and PAPSS1 on the breast cancer cells in vitro, we chose the MCF‐7 cells as the target cells. Overexpression of SULT1E1 and PAPSS1 by adenovirus in MCF‐7 cells was confirmed by Real‐time RT‐PCR and western‐blot (Fig. 5a–c). As shown in Figure 5(d,e), E2 promoted cell growth in the time‐dependent manner and dose‐dependent manner in GFP‐control group, and SULT1E1 and PAPSS1 or combination of them partly blocked estrogen pro‐proliferating effect. 1 mM H2O2 was used to induce apoptosis of MCF‐7 cells in the absence or presence of 10 nM E2. The apoptotic cells were analyzed by flow cytometry, which include the early (labeled with Annexin V alone) and late (labeled with Annexin V/7‐AAD) apoptotic cells.
Figure 5.
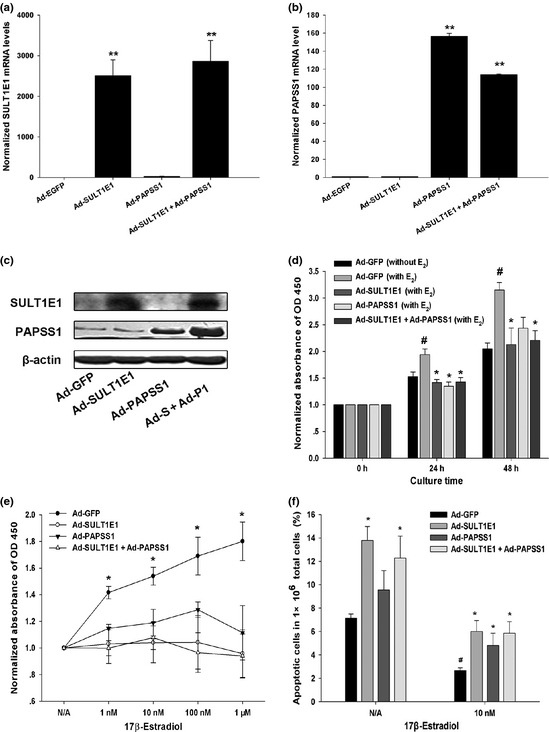
Effects of SULT1E1 and/or PAPSS1 overexpression on cell growth and apoptosis in MCF‐7 cells in the absence or presence of 17β‐estradiol (E 2). The overexpression of SULT1E1 and PAPSS1 by adenovirus in MCF‐7 cells were confirmed by Real‐time reverse transcription‐polymerase chain reaction (RT‐PCR) and western‐blot (a–c). MCF‐7 cells infected with Ad‐GFP, Ad‐SULT1E1, Ad‐PAPSS1 or Ad‐SULT1E1 mixed with Ad‐PAPSS1 were cultured without or with 1, 10, 100 nM, 1 μM E 2. The cell proliferation was assessed by CCK‐8 assay. Panel (d) shows the cell growth of MCF‐7 cells in the absence or presence of 10 nM E 2 after 24 and 48 h culture. Panel (e) presents the growth curve of MCF‐7 cells with SULT1E1 and/or PAPSS1 overexpression in the presence of different concentrations of E 2 for 24 h. 1 mM H 2 O 2 was used to induce apoptosis of MCF‐7 cells for 6 h in the absence or presence of 10 nM E 2. The ratio of apoptotic cells in 1 × 10⁶ total cells was analyzed by flow cytometry after incubation with Annexin V‐APC and 7‐ADD and summarized in (f). The data represents the mean of three independent experiments ± standard deviation (SD). *P < 0.05 versus Ad‐GFP group; #P < 0.05 versus N/A group.
As shown in Figure 5(f), after inducement of H2O2, the population rate of apoptotic cells in total cells increased significantly compared with the Ad‐GFP group both in the E2‐treated MCF‐7 cells. Surprisingly, in E2 non treated cells, H2O2 also induced more apoptotic cells after treatment of Ad‐SULT1E1 and Ad‐SULT1E1 combined with Ad‐PAPSS1. To explain the phenomenon, the mRNA levels of c‐myc, cyclin D1, bcl‐2 and bax in MCF‐7 cells treated by adenovirus for 48 h were measured by Realtime RT‐PCR. As shown in Figure 6, the mRNA levels of c‐myc, cyclin D1, bcl‐2 were reduced and bax was increased in Ad‐SULT1E1 group and Ad‐SULT1E1 combined with Ad‐PAPSS1, which were opposite to the alternations in Ad‐PAPSS1 group.
Figure 6.
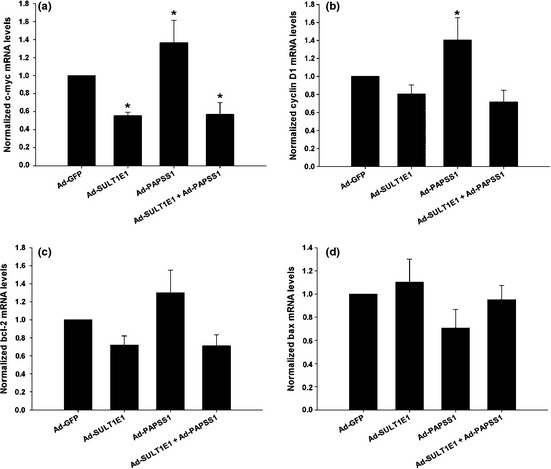
Effects of SULT1E1 and/or PAPSS1 overexpression on the mRNA levels of proliferation and apoptosis related genes in MCF‐7 cells in the absence of 17β‐estradiol. MCF‐7 cells infected with Ad‐GFP, Ad‐SULT1E1, Ad‐PAPSS1 or Ad‐SULT1E1 mixed with Ad‐PAPSS1 were cultured in medium without 17β‐estradiol for 48 h. The mRNA levels of c‐myc, cyclin D1, bcl‐2 and bax were analyzed by Real‐time reverse transcription‐polymerase chain reaction (RT‐PCR) and summarized in (a–d). The data represent the mean of three independent experiments ± standard deviation (SD). *P < 0.05 versus N/A group.
Effects of SULT1E1 and/or PAPSS1 overexpression on proliferation and apoptosis related genes in MCF‐7 cells in the absence or presence of 17β‐estradiol
To elucidate the underlying mechanisms of the inhibition of cell growth and promotion of apoptosis caused by SULT1E1 and/or PAPSS1 overexpression in MCF‐7 cells, the mRNA and protein levels of the four important proliferation and apoptosis related genes were measured by Real‐time RT‐PCR and western‐blot respectively. The mRNA and protein levels of proliferation‐related genes c‐myc (Figs 7a,8a,b), cyclin D1 (Figs 7b,8c,d) and an anti‐apoptotic gene, bcl‐2 (Figs 7c,8e,f), in MCF‐7 cells treated by Ad‐GFP were upregulated by E2 in dose‐dependent manner, which were blocked at least partly by the overexpression of SULT1E1 or SULT1E1 combined with PAPSS1 as the concentration of estrogen was within 10 nM. The co‐infection of Ad‐SULT1E1 and Ad‐PAPSS1 increased the expression of bax (Figs 7d,8g,h), which is a pro‐apoptotic gene.
Figure 7.
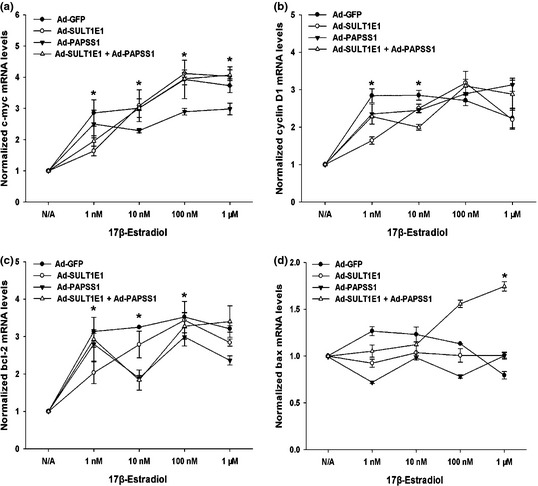
Effects of SULT1E1 and/or PAPSS1 overexpression on the mRNA levels of proliferation and apoptosis related genes in MCF‐7 cells in the absence or presence of 17β‐estradiol. After treatment with Ad‐GFP, Ad‐SULT1E1, Ad‐PAPSS1 or Ad‐SULT1E1 mixed with Ad‐PAPSS1 for 48 h, MCF‐7 cells were incubated without or with 1, 10, 100 nM, 1 μM E 2 for 6 h. The mRNA levels of c‐myc, cyclin D1, bcl‐2 and bax were analyzed by Real‐time reverse transcription‐polymerase chain reaction (RT‐PCR) and summarized in (a–d). The data represent the mean of three independent experiments ± standard deviation (SD). *P < 0.05 versus N/A group.
Figure 8.
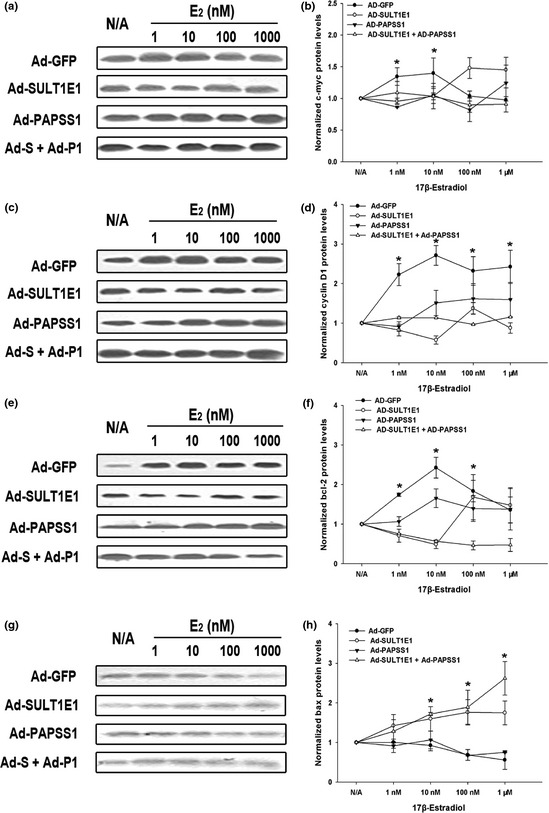
Effects of SULT1E1 and/or PAPSS1 overexpression on the protein levels of proliferation and apoptosis related genes in MCF‐7 cells in the absence or presence of 17β‐estradiol. After treatment with Ad‐GFP, Ad‐SULT1E1, Ad‐PAPSS1 or Ad‐SULT1E1 mixed with Ad‐PAPSS1 for 48 h, MCF‐7 cells were incubated without or with 1, 10, 100 nM, 1 μM E 2 for 18 h. The protein levels of c‐myc (a), cyclin D1 (c), bcl‐2 (e) and bax (g) were analyzed by western‐blot. Summaries of three experiments are shown in (b,d,f,h). The data represent the mean of three independent experiments ± standard deviation (SD). *P < 0.05 versus N/A group.
Estrogen sulfation by Ad‐SULT1E1 and/or Ad‐PAPSS1
After 48 h incubation with Ad‐SULT1E1, MCF‐7 cells were incubated with 10 nM [3H] E2 for 4, 8, 24 and 48 h. Sulfated estrogen in the medium was measured by liquid scintillation counting. The formation of E2S in the medium of MCF‐7 with Ad‐SULT1E1 treatment was linear with the incubation time up to 8 h (Fig. 9a). As shown in Figure 9(b), sulfation assay with 1, 10, 100 or 1000 nM cold estrogen combined with 10 nM [3H] E2 as substrate for 6 h incubation suggested the formation of estrogen sulfate was increased in MCF‐7 cells treated by Ad‐SULT1E1 and/or Ad‐PAPSS1.
Figure 9.
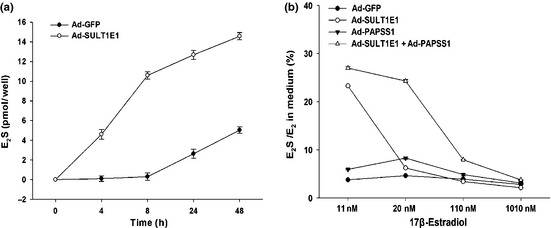
Estrogen sulfation by Ad‐SULT1E1 and/or Ad‐PAPSS1. The formation of sulfated estrogen was analyzed by alkaline–chloroform extraction. MCF‐7 cells were cultured in a 24‐well plate and infected with Ad‐GFP, Ad‐SULT1E1, Ad‐PAPSS1 or Ad‐SULT1E1 mixed with Ad‐PAPSS1 for 48 h. Then the cells were incubated with 10 nM [3 H] E 2 in the absence or presence of 1, 10, 100, 1000 nM cold estrogen for the indicated time. Sulfated estrogen in the medium was measured by liquid scintillation counting as described in Materials and Methods. The E 2 S formation in time‐course is shown in (a). The ratio of E 2 S to E 2 in cultured medium is shown in (b).
Discussion
Most breast cancers and endometrial cancers require the presence of estrogens for tumorigenesis and progression. Sulfation is an important process in the metabolism and inactivation of estrogen, thus modulate the concentrations of active estrogens.22 Then we hypothesized that sulfation, may alter greatly the responsiveness of the cells to estrogens, and then affect the etiology of the estrogen responsive cancers.
SULT1E1 is responsible for sulfating active 17β‐estradiol (E2) into inactive form.23 In recent years, the correlation between SULT1E1 and the carcinogenesis of estrogen‐dependent cancers has been noticed. Choi et al. and Hirata et al.9, 14 reported that single nucleotide polymorphisms (SNPs) in the SULT1E1 gene influenced the risk and survival of breast cancer and endometrial cancer. Our study also suggested the close correlation of SULT1E1 and estrogen‐dependent cancers. Another enzyme, sulfatase, catalyzes the hydrolysis of sulfated estrogen to E1, which is subsequently reduced to E2 by 17β‐hydroxysteroid dehydrogenase type 1 (17β‐HSD1). It was reported that sulfatase inhibitors has been applied to clinical trials in breast cancer patients, which indicated that it would be a promising new treatment strategy for hormone‐sensitive breast cancer.24 To date, various endocrine disrupting compounds can inhibit human SULT1E1, but none of them has been used to treat cancers in in vivo study.25
The PAPSS (PAPSS1 and PAPSS2) catalyzes the biosynthesis of PAPS, which serves as the universal sulfate donor compound for all sulfotransferase reactions.26 According to our data, both in the breast tissues and endometrial tissues, SULT1E1 and PAPSS2 were all located in the cytoplasm exclusively, but PAPSS1 was expressed not only in the cytoplasm but also nuclei of cells, which was consistent with the observation that PAPSS1 localized to the nucleus of eukaryotic cells reported by Besset et al.27 who predicted that a sulfation pathway might exist in the nucleus of eukaryotic cells. The relationship between PAPSS and diseases has been discussed. It was reported that mutation in the PAPSS2 gene may cause an autosomal recessive skeletal disorder in humans, termed as spondyloepimetaphyseal dysplasia (SEMD).28 Kurima et al. reported that missense mutation in the PAPSS gene caused brachymorphism in the mouse, including abnormal hepatic detoxification, bleeding times and postnatal growth.13, 29 However, the role of PAPSS in the development of cancer has not been noticed. Our data suggested that PAPSS1 expressed higher in the breast tumor tissues compared to those adjacent tissues, which was not observed in endometrial cancer; PAPSS2 expressed higher in the tumor tissues compared to those adjacent tissues both in breast and ER‐positive endometrial specimens. In the present study, overexpression of PAPSS1 solely could induce proliferation genes c‐myc, cyclin D1 and anti‐apoptotic gene bcl‐2 expression, but suppress pro‐apoptotic gene bax expression in MCF‐7 cells in the absence of estrogen. According to the data, PAPSS1 may play an important role in cell growth estrogen‐independently.
The comparatively higher level of SULT1E1 and PAPSS in tumorous tissues may be the adaptive response for estrogen in tumor cells. The compensatory upregulation of SULT1E1 and PAPSS may sulfate active estrogen in the local tumor tissue into an inactive form to protect the cells from mitogenicity by estrogen. Falany et al. reported that SULT1E1 was expressed in human breast epithelial cells as well as in the MCF10A cell line, a model of normal human breast epithelial cells, but was not detectable in many breast cancer cell lines.22, 30 We believe the observation is not conflicting with ours due to the discrepancy between in vivo and in vitro assays.
The human MCF‐7 breast cancer cell line has been extensively used as a model system to study the effects of estrogens and anti‐estrogens on breast cancer cell growth. Actually, we screened the SULT1E1 expressions in several breast cancer cell lines including ER positive cell lines (T47D, MCF‐7) and ER negative cell lines (MDA‐MB‐453, MDA‐MB‐468, MDA‐MB‐231). SULT1E1 was only detectable in MDA‐MB‐468 cells, but not in others including estrogen‐responsive MCF‐7 cells (data not shown), which was in accordance with a previous report.4 However, PAPSS1 expression was high in MCF‐7 cells. So a single injection of SULT1E1 could cause estrogen sulfation in in vitro and in vivo experiments.
Based on the estrogen sulfation assay, estrogen could be sulfated completely in MCF‐7 cells by Ad‐SULT1E1 treatment within the concentration of 10 nM. We figured that estrogen sulfation inhibited MCF‐7 cells growth both in vitro and in vivo, meanwhile, it blocked the effects of estrogen protecting MCF‐7 cells from H2O2‐induced apoptosis. Falany et al.4 also reported that stable expression of SULT1E1 in MCF‐7 cells significantly inhibited cell growth. Hereby, estrogen sulfation might suppress cell growth and promote apoptosis to affect the development of estrogen‐dependent cancers.
It is well known that cell proliferation and apoptosis is the transition of cell cycle G1 and S, and estrogen controls the balance by triggering cell proliferation or cell cycle related signaling pathways. C‐myc, termed oncogene, played an important role in tumorigenesis.31 Cylin D1 is a member of cyclin family that functions as a regulator of CDK kinases. Cyclin D1 formed complexes with CDK4 or CDK6, regulating cell cycle G1/S transition. Our data demonstrate that, c‐myc and cyclin D1 were upregulated by estrogen in MCF‐7 cells, which was consistent with previous reports.32, 33 A pair of apoptosis related genes, anti‐apoptotic bcl‐2 gene and pro‐apoptotic bax gene were regulated by estrogen oppositely. However, within the concentration of 10 nM E2, whatever the mRNA or protein levels, the effect of estrogen regulation could be suppressed by the treatment of SULT1E1 and (or) PAPSS1. Although the trend of mRNA levels was inconsistent with protein levels, which could be explained by the incubation time of estrogen and translation from mRNA to protein synthesis. In conclusion, overexpression of SULT1E1 and PAPSS1 suppressed cell growth and triggered apoptosis by downregulating the levels of c‐myc, cyclin D1 and bcl‐2, meanwhile, upregulating bax expression.
In summary, our study showed the expression patterns of SULT1E1 and PAPSS in the breast and endometrial tissues. The estrogen sulfation enzymes were comparatively higher in the tumorous tissues than their adjacent normal tissues, which might be the adaptive response for estrogen in tumorous cells. Overexpression of SULT1E1 and PAPSS1 retarded MCF‐7 cell growth in vivo and in vitro by arresting cell cycles and inducing apoptosis. Thus, targeting SULT1E1 and PAPSS expressions might be an important approach for estrogen‐dependent cancers.
Disclosure Statement
The authors have no conflict of interest.
Acknowledgments
This work was supported by National Natural Science Foundation of China (General Program: NSFC 30800547 and NSFC 81001170, Key Program: 30830050); Shanghai Municipal Natural Science Foundation, Project no. 10ZR1402600.
References
- 1. Hu ZZ, Kagan BL, Ariazi EA et al Proteomic analysis of pathways involved in estrogen‐induced growth and apoptosis of breast cancer cells. PLoS ONE 2011; 6: e20410. [DOI] [PMC free article] [PubMed] [Google Scholar]
- 2. Filigheddu N, Sampietro S, Chianale F et al Diacylglycerol kinase alpha mediates 17‐beta‐estradiol‐induced proliferation, motility, and anchorage‐independent growth of Hec‐1A endometrial cancer cell line through the G protein‐coupled estrogen receptor GPR30. Cell Signal 2011; 23: 1988–96. [DOI] [PubMed] [Google Scholar]
- 3. Foster PA, Purohit A. Steroid sulfatase inhibitors for estrogen‐ and androgen‐dependent cancers. J Endocrinol 2012; 212: 99–110. [DOI] [PubMed] [Google Scholar]
- 4. Falany JL, Macrina N, Falany CN. Regulation of MCF‐7 breast cancer cell growth by beta‐estradiol sulfation. Breast Cancer Res Treat 2002; 74: 167–76. [DOI] [PubMed] [Google Scholar]
- 5. Thomas C, Gustafsson JA. The different roles of ER subtypes in cancer biology and therapy. Nat Rev Cancer 2011; 11: 597–608. [DOI] [PubMed] [Google Scholar]
- 6. Hui Y, Yasuda T, Yasuda S et al Inhibitory effects of nitrative stress on the sulfation of 17beta‐estradiol and 4‐methoxyestradiol by human MCF 10A mammary epithelial cells. Biol Pharm Bull 2011; 33: 1633–7. [DOI] [PubMed] [Google Scholar]
- 7. Coughtrie MW. Sulfation through the looking glass–recent advances in sulfotransferase research for the curious. Pharmacogenomics J 2002; 2: 297–308. [DOI] [PubMed] [Google Scholar]
- 8. Cole GB, Keum G, Liu J et al Specific estrogen sulfotransferase (SULT1E1) substrates and molecular imaging probe candidates. Proc Natl Acad Sci USA 2010; 107: 6222–7. [DOI] [PMC free article] [PubMed] [Google Scholar]
- 9. Choi JY, Lee KM, Park SK et al Genetic polymorphisms of SULT1A1 and SULT1E1 and the risk and survival of breast cancer. Cancer Epidemiol Biomarkers Prev 2005; 14: 1090–5. [DOI] [PubMed] [Google Scholar]
- 10. Alnouti Y, Klaassen CD. Regulation of sulfotransferase enzymes by prototypical microsomal enzyme inducers in mice. J Pharmacol Exp Ther 2008; 324: 612–21. [DOI] [PubMed] [Google Scholar]
- 11. Venkatachalam KV. Human 3′‐phosphoadenosine 5′‐phosphosulfate (PAPS) synthase: biochemistry, molecular biology and genetic deficiency. IUBMB Life 2003; 55: 1–11. [DOI] [PubMed] [Google Scholar]
- 12. Xu ZH, Otterness DM, Freimuth RR et al Human 3′‐phosphoadenosine 5′‐phosphosulfate synthetase 1 (PAPSS1) and PAPSS2: gene cloning, characterization and chromosomal localization. Biochem Biophys Res Commun 2000; 268: 437–44. [DOI] [PubMed] [Google Scholar]
- 13. Stelzer C, Brimmer A, Hermanns P, Zabel B, Dietz UH. Expression profile of Papss2 (3′‐phosphoadenosine 5′‐phosphosulfate synthase 2) during cartilage formation and skeletal development in the mouse embryo. Dev Dyn 2007; 236: 1313–8. [DOI] [PubMed] [Google Scholar]
- 14. Hirata H, Hinoda Y, Okayama N et al CYP1A1, SULT1A1, and SULT1E1 polymorphisms are risk factors for endometrial cancer susceptibility. Cancer 2008; 112: 1964–73. [DOI] [PubMed] [Google Scholar]
- 15. Bloomer CW, Kenyon L, Hammond E et al Cyclooxygenase‐2 (COX‐2) and epidermal growth factor receptor (EGFR) expression in human pituitary macroadenomas. Am J Clin Oncol 2003; 26: S75–80. [DOI] [PubMed] [Google Scholar]
- 16. Ren S, Hylemon P, Zhang ZP et al Identification of a novel sulfonated oxysterol, 5‐cholesten‐3beta,25‐diol 3‐sulfonate, in hepatocyte nuclei and mitochondria. J Lipid Res 2006; 47: 1081–90. [DOI] [PubMed] [Google Scholar]
- 17. Bai Q, Li X, Ning Y, Zhao F, Yin L. Mitochondrial cholesterol transporter, StAR, inhibits human THP‐1 monocyte‐derived macrophage apoptosis. Lipids 2010; 45: 29–36. [DOI] [PubMed] [Google Scholar]
- 18. Yeong P, Ning Y, Xu Y, Li X, Yin L. Tryptase promotes human monocyte‐derived macrophage foam cell formation by suppressing LXRalpha activation. Biochim Biophys Acta 2010; 1801: 567–76. [DOI] [PubMed] [Google Scholar]
- 19. Spandidos A, Wang X, Wang H, Seed B. PrimerBank: a resource of human and mouse PCR primer pairs for gene expression detection and quantification. Nucleic Acids Res 2010; 38: D792–9. [DOI] [PMC free article] [PubMed] [Google Scholar]
- 20. Yan LX, Wu QN, Zhang Y et al Knockdown of miR‐21 in human breast cancer cell lines inhibits proliferation, in vitro migration and in vivo tumor growth. Breast Cancer Res 2011; 13: R2. [DOI] [PMC free article] [PubMed] [Google Scholar]
- 21. Fujishita S, Inaba C, Tada S, Gemmei‐Ide M, Kitano H, Saruwatari Y. Effect of zwitterionic polymers on wound healing. Biol Pharm Bull 2008; 31: 2309–15. [DOI] [PubMed] [Google Scholar]
- 22. Falany JL, Falany CN. Expression of cytosolic sulfotransferases in normal mammary epithelial cells and breast cancer cell lines. Cancer Res 1996; 56: 1551–5. [PubMed] [Google Scholar]
- 23. Falany JL, Falany CN. Regulation of estrogen activity by sulfation in human MCF‐7 breast cancer cells. Oncol Res 1997; 9: 589–96. [PubMed] [Google Scholar]
- 24. Geisler J, Sasano H, Chen S, Purohit A. Steroid sulfatase inhibitors: promising new tools for breast cancer therapy? J Steroid Biochem Mol Biol 2011; 125: 39–45. [DOI] [PubMed] [Google Scholar]
- 25. Stjernschantz E, Reinen J, Meinl W et al Comparison of murine and human estrogen sulfotransferase inhibition in vitro and in silico – implications for differences in activity, subunit dimerization and substrate inhibition. Mol Cell Endocrinol 2010; 317: 127–40. [DOI] [PubMed] [Google Scholar]
- 26. Xu Z, Wood TC, Adjei AA, Weinshilboum RM. Human 3′‐phosphoadenosine 5′‐phosphosulfate synthetase: radiochemical enzymatic assay, biochemical properties, and hepatic variation. Drug Metab Dispos 2001; 29: 172–8. [PubMed] [Google Scholar]
- 27. Besset S, Vincourt JB, Amalric F, Girard JP. Nuclear localization of PAPS synthetase 1: a sulfate activation pathway in the nucleus of eukaryotic cells. FASEB J 2000; 14: 345–54. [DOI] [PubMed] [Google Scholar]
- 28. Faiyaz ul Haque M, King LM, Krakow D et al Mutations in orthologous genes in human spondyloepimetaphyseal dysplasia and the brachymorphic mouse. Nat Genet 1998; 20: 157–62. [DOI] [PubMed] [Google Scholar]
- 29. Kurima K, Warman ML, Krishnan S et al A member of a family of sulfate‐activating enzymes causes murine brachymorphism. Proc Natl Acad Sci USA 1998; 95: 8681–5. [DOI] [PMC free article] [PubMed] [Google Scholar]
- 30. Fu J, Weise AM, Falany JL et al Expression of estrogenicity genes in a lineage cell culture model of human breast cancer progression. Breast Cancer Res Treat 2010; 120: 35–45. [DOI] [PMC free article] [PubMed] [Google Scholar]
- 31. Hynes NE, Stoelzle T. Key signalling nodes in mammary gland development and cancer: Myc. Breast Cancer Res 2009; 11: 210. [DOI] [PMC free article] [PubMed] [Google Scholar]
- 32. Musgrove EA, Sergio CM, Loi S et al Identification of functional networks of estrogen‐ and c‐Myc‐responsive genes and their relationship to response to tamoxifen therapy in breast cancer. PLoS ONE 2008; 3: e2987. [DOI] [PMC free article] [PubMed] [Google Scholar]
- 33. Zwijsen RM, Wientjens E, Klompmaker R, van der Sman J, Bernards R, Michalides RJ. CDK‐independent activation of estrogen receptor by cyclin D1. Cell 1997; 88: 405–15. [DOI] [PubMed] [Google Scholar]


