

Abstract
Mutation of the APC gene occurs during the early stages of colorectal cancer development. To obtain new insights into the mechanisms underlying the aberrant activation of the Wnt pathway that accompanies APC mutation, we carried out a gas chromatography–mass spectrometry‐based semiquantitative metabolome analysis. In vitro experiments comparing SW480 cells expressing normal APC and truncated APC indicated that the levels of metabolites involved in the latter stages of the intracellular tricarboxylic acid cycle, including succinic acid, fumaric acid, and malic acid, were significantly higher in the SW480 cells expressing the truncated APC. In an in vivo study, we found that the levels of most amino acids were higher in the non‐polyp tissues of APC min/+ mice than in the normal tissues of the control mice and the polyp tissues of APC min/+ mice. Ribitol, the levels of which were decreased in the polyp lesions of the APC min/+ mice and the SW480 cells expressing the truncated APC, reduced the growth of SW480 cells with the APC mutation, but did not affect the growth of SW480 transfectants expressing full‐length APC. The level of sarcosine was found to be significantly higher in the polyp tissues of APC min/+ mice than in their non‐polyp tissues and the normal tissues of the control mice, and the treatment of SW480 cells with 50 μM sarcosine resulted in a significant increase in their growth rate. These findings suggest that APC mutation causes changes in energetic metabolite pathways and that these alterations might be involved in the development of colorectal cancer. (Cancer Sci 2012; 103: 1010–1021)
Colorectal cancer is one of the most commonly diagnosed cancers, the second leading cause of cancer mortality in the USA, and the third leading cause of cancer mortality in Japan.1 The National Cancer Center Hospital (Tokyo, Japan) has estimated that the 5‐year survival rate of patients with stage I colorectal cancer exceeds 90%, but that survival decreases with advancing disease stage. To reduce the mortality of colorectal cancer, new screening methods, especially for early stage disease, and new medical treatments for late stage disease have been studied worldwide. Most malignant colorectal cancers arise from pre‐existing benign adenomas. The incidence of colorectal cancer is associated with the multistep accumulation of mutations in both oncogenes and tumor suppressor genes.2, 3 Mutation of the APC gene occurs in the early stages of colorectal cancer,4 and the gene been recognized as the gatekeeper of colorectal carcinogenesis.2 Mutations in the APC gene have also been implicated in familial adenomatous polyposis (FAP).5, 6, 7 This is an autosomal, dominantly inherited disease that typically causes the development of hundreds to thousands of colorectal adenomas. In addition, 80–90% of patients with sporadic colorectal cancer show APC mutations. APC proteins negatively regulate the Wnt pathway by aiding the degradation of β‐catenin, whereas APC mutation results in the stabilization of β‐catenin and activation of the Wnt pathway. Stabilized β‐catenin promotes the transcription of Wnt target genes then leads to aberrant cellular proliferation. Recently, it was revealed by proteome analysis that β‐catenin activation in mouse liver might affect glucose metabolism,8 so an investigation of metabolite changes induced by APC mutation might help to elucidate the mechanisms of colorectal cancer development.
The human genome had been completely identified by the end of 2003. Proteomics has since been heavily studied. In 2002, Petricoin et al.9 found an effective diagnostic marker for ovarian cancer, including stage I disease, using proteomic analysis. Thus, “clinical proteomics” was developed, and since then many researchers have tried to apply proteomic analysis to the medical field in order to find effective diagnostic markers and elucidate unknown pathological conditions. Furthermore, metabolomics, which is the comprehensive study of low molecular weight metabolites, has also been developed. In clinical research using metabolomics, Sreekumar et al.10 revealed, using a combination of the high‐throughput liquid chromatography–mass spectrometry and gas chromatography–mass spectrometry (GCMS), that sarcosine is a potentially important metabolic intermediary factor for prostate cancer cell invasion and aggressivity. In addition, the value of metabolomics for research on diagnostic biomarkers and/or the elucidation of the pathological conditions of lung cancer, gastroenterological cancer, pancreatic cancer, and inflammatory bowel disease has also been shown.11, 12, 13, 14, 15, 16, 17
In this study, we used APCmin/+ mice and human colorectal cancer cell‐implanted nude mice. APC multiple intestinal neoplasia (APCmin) was the first heritable mutant APC allele to be induced in mice.18 APCmin/+ mice develop numerous intestinal lesions that resemble human FAP and are useful models for investigating malignant transformation in colon tumorigenesis.19 It is also well‐known that nude mice implanted with human tumors maintain not only their histological appearance but also their functional mechanisms. In vitro experiments were carried out using SW480 human epithelial colorectal cancer cells expressing truncated APC, and SW480 transfectants expressing full‐length APC. Metabolomic analyses of APCmin/+ mice, human colorectal cancer cell‐implanted nude mice, SW480 cells, and SW480 transfectants were carried out by GCMS, and the relationships between colorectal cancer, APC mutation, and metabolite levels were evaluated.
Materials and Methods
Cell culture and treatment
SW480 cells expressing truncated APC and SW480 transfectants expressing full‐length APC were kindly donated by Dr. Maree C. Faux (Ludwig Institute for Cancer Research, Melbourne, Australia).20 The culture medium consisted of RPMI‐1640 medium supplemented with 10% FBS, 1% penicillin–streptomycin, and 1.25 mg/mL G418. The cells were grown at 5 × 10⁴/well in 96‐well plates for 24 h in medium then exposed to arabitol, inositol, ribitol, L‐proline, isoleucine, 2‐hydroxybutyric acid, 3‐hydroxypropanoic acid, and sarcosine. After 24 h, 10 μL of the solution provided with Cell Counting Kit‐8 (Dojindo Laboratories, Kumamoto, Japan) were added to each well of the plate in order to evaluate cell growth.
Animal and experimental design
All treatments in this study were approved by the Institutional Animal Care and Use Committee and carried out in accordance with the Kobe University Animal Experimentation Regulations. Female 6–8‐week‐old C57BL/6J mice were purchased from Clea Japan (Shizuoka, Japan). APCmin/+ mice were obtained from The Jackson Laboratory (Bar Harbor, ME, USA). APCmin/+ mice with a C57BL/6J background were maintained by breeding male mice that were heterozygous for the Min allele with female wild‐type C57BL/6J mice. All mice were housed and bred at the Animal Unit of the Kobe University School of Medicine (Kobe, Japan) in a specific pathogen‐free facility under an approved experimental protocol. The mice were killed, and their blood was collected by cardiac puncture followed by separation of their serum by centrifugation at 3000g for 10 min at 4°C. Intestinal polyps and non‐polyp regions of the small intestine were obtained from APCmin/+ mice using a microscope. Normal small intestinal tissues were collected from the wild‐type C57BL/6J mice.
BALB/cAJc1‐nu/nu mice were purchased from Clea Japan. Human epithelial colon cancer HT‐29 cells, SW480 cells expressing truncated APC, and the SW480 transfectants expressing full‐length APC were implanted s.c. into male 6‐week‐old nude mice at 2 × 10⁶ cells per mouse. After the enlargement of implanted tumors was recognized, the mice were killed and their blood collected by cardiac puncture followed by serum separation.
Histological examination
The intestinal tissue of the mice was dissected and fixed with 10% formalin, then the paraffin‐embedded tissue was sliced at 5 μm and stained with H&E in a blinded manner. The sections were observed using a microscope (BX51; Olympus, Tokyo, Japan).
Sample collection and preparation
The extraction of low molecular weight metabolites from serum and the pretreatment procedure used for GCMS measurement were carried out according to the methods described in our previous reports.11, 12, 13, 14, 15, 16, 21
The collected intestinal polyps and non‐polyp and normal tissues were stored at −80°C until use. To extract low molecular weight metabolites, 10 mg of the tissues was transferred to a clean tube and homogenized in 1000 μL of a solvent mixture (MeOH : H2O : CHCl3 = 2.5:1:1). Then 10 μL of 0.5 mg/mL 2‐isopropylmalic acid (Sigma‐Aldrich, St. Louis, MO, USA) was added to each tube, and the mixture was mixed well. The mixture was subsequently shaken at 1200 rpm for 30 min at 37°C, before being centrifuged at 16 000 g for 3 min at 4°C. The resultant supernatant (900 μL) was separately collected in a clean tube. Then 450 μL CHCl3 was added to the supernatant before it was centrifuged at 16 000 g for 3 min at 4°C, and 500 μL of the resultant supernatant was separately collected in a clean tube. Distilled water (200 μL) was added to the collected supernatant before it was centrifuged at 16 000 g for 3 min at 4°C, and 500 μL of the resultant supernatant was separately collected in a clean tube. The collected supernatant was then lyophilized using a freeze dryer before oximation and derivatization. The oximation and subsequent derivatization for GCMS measurement were carried out according to the method described in our previous reports.11, 12, 13, 14, 15, 16, 21
The SW480 cells and SW480 transfectants at 70–80% confluence were washed twice with Krebs–Ringer HEPES buffer and collected. The cells were washed twice with Krebs–Ringer HEPES buffer before being counted and collected in a clean tube, then washed with H2O and lyophilized using a freeze dryer. The extraction of low molecular weight metabolites and the pretreatment procedure used for GCMS measurement were carried out according to the methods described in our previous reports.11, 12, 13, 14, 15, 16, 21
Analysis using GC/MS and data processing
According to the method described in a previous report,21 GC/MS analysis was carried out using a GCMS‐QP2010 Ultra (Shimadzu, Kyoto, Japan) with a fused silica capillary column (CP‐SIL 8 CB low bleed/MS, 30 m × 0.25 mm [inner diameter], film thickness 0.25 μm; Agilent Technologies, Palo Alto, CA, USA). Data processing was carried out using MetAlign software (Wageningen UR, http://www.pri.wur.nl/UK/products/MetAlign/) and in‐house analytical software (AIoutput), as described in a previous report.22 For semiquantification, the peak height of each ion was calculated and normalized using the peak height of 2‐isopropylmalic acid as an internal standard. In GC/MS analysis, multiple peaks are sometimes detected for a particular metabolite due to trimethysilyl (TMS) derivatization, isomeric form, etc. In such cases, the peak that most reflected the level of the metabolite was adopted for the semiquantitative evaluation.
Western blot analysis
The extraction of proteins from the cultured cells and the subsequent Western blotting using anti‐APC antibody (Santa Cruz Biotechnology, Santa Cruz, CA, USA) and anti‐β‐actin antibody (Sigma‐Aldrich) were carried out as described in our previous report.22
Statistical analysis
The results are expressed as the mean ± SE. Statistical significance was analyzed using Student's t‐test, and a level of probability of 0.05 was used as the criterion for significance.
Results
To profile the metabolites changed by the APC mutation, we used GCMS‐based metabolome analysis, and the relative levels of metabolites were evaluated across the tissues and/or sera of APCmin/+ mice, SW480 cells, and human colorectal cancer cell‐implanted nude mice. As shown in Figure 1(A), the 51 metabolites were shared across the tissues, sera, and cultured cells, and in our analysis system, distribution of the chemical classes for the detected metabolites were similar among sera, tissues, and cultured cells (Fig. 1B–D).
Figure 1.
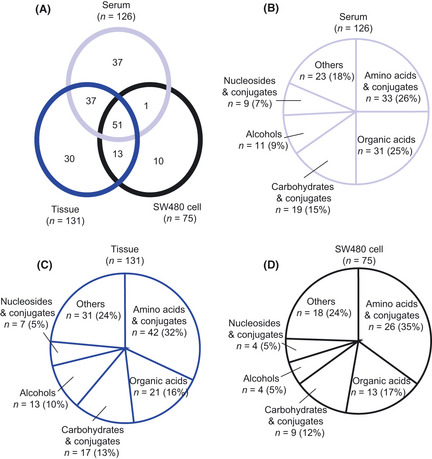
Metabolomic profiling of APC min/+ mice and SW480 human epithelial colorectal cancer cells. (A) Venn diagram based on the metabolites detected in sera and tissues of APC min/+ mice, corresponding control mice, and SW480 cells. The circle graph represents the distribution of chemical classes for the metabolites detected in sera (B), tissues (C), and SW480 cells (D). Others include amines, miscellaneous, heterocyclic molecules, ketones, and aldehydes. The values in parentheses indicate the percentage of total.
Metabolite profiling of sera and polyps of APC min/+ mice
In a histopathological examination with H&E staining (Fig. 2C), adenomatous proliferations characterized by cell dysplasia were noted in the polyp lesions of APCmin/+ mice as well as in parts of their non‐polyp lesions. Low molecular weight metabolites were extracted from the sera and the intestinal tissues of APCmin/+ mice and the corresponding control mice, and a total of 126 and 131 metabolites were detected in their sera and intestinal tissues, respectively (Fig. 1, Tables S1,S2). Among these detected metabolites, the 88 metabolites were shared across the tissues and sera (Fig. 1A). In the sera of the APCmin/+ mice, the levels of 44 and 27 metabolites showed significant increases and decreases, respectively, compared with those of the corresponding control mice (Table 1). In the polyp lesions of APCmin/+ mice, the levels of 25 metabolites were significantly increased and those of 18 metabolites were decreased in comparison to those in the normal intestinal tissue of the corresponding control mice (Table 2). In addition, the levels of 15 and 24 metabolites were significantly increased and decreased, respectively, in the polyp lesions of APCmin/+ mice compared with those of the non‐polyp lesions of the APCmin/+ mice (Table 2). These results suggest that the metabolite profiles of sera and tissues differ between APC mutation mice and the corresponding control mice.
Figure 2.
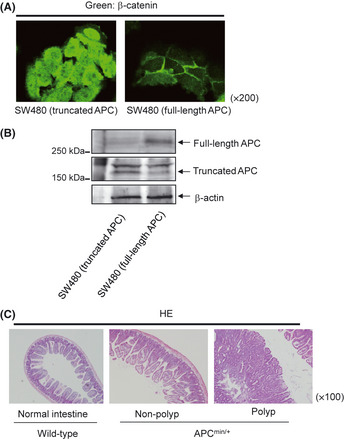
Mutation of the APC gene causes the development of adenoma in the digestive tract. (A) SW480 colorectal cancer cells expressing truncated APC and SW480 transfectants expressing full‐length APC were subjected to immunohistochemical analysis with anti‐β‐catenin antibody. Representative images are shown. Green, β‐catenin. Magnification, ×200. (B) SW480 cells expressing truncated APC and SW480 transfectants expressing full‐length APC were subjected to Western blot analysis with anti‐APC antibody and anti‐β‐actin antibody. Representative images are shown. (C) Small intestinal tissue was collected from APC min/+ mice with non‐polyp and polyp lesions and C57BL/6J mice and subjected to H&E staining. Representative images are shown. Magnification, ×100.
Table 1.
Metabolites that displayed significantly altered serum levels between APC min/+ mice and wild‐type mice
| Chemical class | Fold induction | P‐value | |
|---|---|---|---|
| APCmin/+/control | APCmin/+ versus control | ||
| 1‐Hexadecanol | Alcohols and polyols | 4.56 | <0.00001* |
| 2‐Aminobutyric acid | Amino acids | 2.74 | 0.00081* |
| 2‐Dehydro‐d‐gluconate | Hydroxy acids | 1.21 | 0.04400* |
| 2′‐Deoxyuridine | Nucleoside analogues | 2.41 | 0.01200* |
| 3,4‐Dihydroxymandelic acid | Hydroxy acids | 1.27 | 0.00240* |
| 3‐Hydroxyisovaleric acid | Hydroxy acids | 1.40 | 0.04700* |
| 4‐Hydroxymandelate | Aromatic acids | 3.05 | 0.07700* |
| Adenine | Purines and purine derivatives | 2.01 | 0.00010* |
| Alanine | Amino acids | 2.01 | 0.00010* |
| Anthranilic acid | Amino acids | 2.75 | 0.00045* |
| Arabinose‐5‐phosphate | Carbohydrates | 0.24 | 0.00230* |
| Arabitol | Alcohols and polyols | 0.27 | 0.00006* |
| Ascorbic acid | Hydroxy acids | 5.27 | 0.00011* |
| α‐Sorbopyranose (or fructose) | Carbohydrates | 0.25 | 0.01600* |
| Asparagine | Amino acids | 1.98 | 0.00220* |
| β‐Alanine | Amino acids | 0.49 | 0.00071* |
| Benzoic acid | Aromatic acids | 3.03 | <0.00001* |
| β‐Glutamic acid | Amino acids | 0.86 | 0.04800* |
| β‐Lactose | Carbohydrates | 2.06 | 0.00260* |
| Citrulline | Amino acids | 2.24 | 0.00019* |
| Coniferyl aldehyde | Hydroxy acids | 17.90 | 0.00023* |
| Cysteine + cystine | Amino acids | 1.79 | 0.00058* |
| Dopa | Catecholamines and derivatives | 0.50 | 0.02100* |
| Fructose | Carbohydrates | 0.60 | 0.00032* |
| Fructose‐6‐phosphate | Sugar phosphates | 0.63 | 0.02400* |
| Galactosamine | Carbohydrates | 4.40 | <0.00001* |
| Galactose | Carbohydrates | 0.78 | 0.00330* |
| Galacturonic acid | Hydroxy acids | 0.56 | 0.00024* |
| Glucarate | Dicarboxylic acids | 1.54 | 0.00150* |
| Glucosamine | Aminoglycosides | 1.78 | 0.00440* |
| Glucuronate | Carbohydrates | 0.57 | 0.00058* |
| Glutamine | Amino acids | 1.35 | 0.03300* |
| Glyceric acid | Hydroxy acids | 0.75 | 0.00300* |
| Glycerol | Alcohols and polyols | 0.61 | 0.00037* |
| Glycolic acid | Hydroxy acids | 0.41 | <0.00001* |
| Histidine | Amino acids | 2.01 | 0.00140* |
| Homoserine | Amino acids | 3.91 | <0.00001* |
| Hydroxybutyrate | Hydroxy acids | 2.57 | 0.00110* |
| Inosine | Nucleoside analogues | 0.35 | 0.02300* |
| Ketoisoleucine | Keto‐acids | 0.37 | <0.00001* |
| Ketovaline | Keto‐acids | 0.65 | 0.00048* |
| Lauric acid | Fatty acids | 1.47 | 0.00210* |
| Lysine | Amino acids | 3.07 | 0.00002* |
| Lyxose (or xlylose) | Carbohydrates | 1.52 | 0.000011* |
| Malonic acid | Dicarboxylic acids | 1.87 | 0.00550* |
| Mannose | Carbohydrates | 1.21 | 0.02900* |
| N‐acetyl‐d‐glucosamine | Carbohydrates | 0.60 | 0.04300* |
| N‐caprylic acid | Fatty acids | 5.57 | <0.00001* |
| Nonanoic acid (C9) | Amino acids | 1.90 | 0.00240* |
| O‐phosphoethanolamine | Acyl phosphates | 0.57 | 0.02700* |
| Ornithine | Amino acids | 3.07 | 0.00007* |
| Orotic acid | Pyrimidines and derivatives | 3.65 | <0.00001* |
| Palmitoleate | Fatty acids | 0.20 | <0.00001* |
| Pantothenate | Amino alcohols | 1.54 | 0.00620* |
| Phenylalanine | Aromatic acids | 1.34 | 0.02900* |
| Proline | Amino acids | 2.68 | 0.00013* |
| Putrescine | Polyamines | 1.20 | 0.02700* |
| Ribitol | Alcohols and polyols | 0.44 | 0.00077* |
| Ribose | Carbohydrates | 0.28 | <0.00001* |
| Ribulose‐5‐phosphate | Sugar phosphates | 0.17 | 0.00068* |
| Saccharopine | Amino acids | 1.39 | 0.03200* |
| Sarcosine | Amino acids | 5.92 | 0.00130* |
| Thymine | Pyrimidines and derivatives | 3.19 | 0.00220* |
| Trans‐4‐hydroxy‐L‐proline | Amino acids | 2.07 | 0.00310* |
| Tryptophan | Amino acids | 0.37 | 0.00150* |
| Tyrosine | Amino acids | 1.46 | 0.00110* |
| Uracil | Pyrimidines and derivatives | 1.74 | 0.00033* |
| Uric acid | Purines and purine derivatives | 0.55 | 0.00930* |
| Valine | Amino acids | 1.34 | 0.02800* |
| Xylitol | Alcohols and polyols | 0.42 | 0.00083* |
| Xylulose | Carbohydrates | 0.58 | 0.00260* |
Values are represented as the fold‐induction of the peak intensity for the APCmin/+ mice (n = 7) against that of the corresponding controls (n = 6). All data are represented in Table S1, and the metabolites that showed significantly altered levels are shown in Table 1. APCmin, APC multiple intestinal neoplasia. P‐values were calculated using Student's t‐test; *P < 0.05.
Table 2.
Metabolites that showed significantly altered tissue levels between APC min/+ mice and wild‐type mice
| Chemical class | Fold induction | P‐value | |||||
|---|---|---|---|---|---|---|---|
| Polyp/control | Polyp/non‐polyp | Non‐polyp/control | Polyp versus control | Polyp versus non‐polyp | Non‐polyp versus control | ||
| 1,5‐Anhydro‐d‐glucitol | Carbohydrates | 0.41 | 1.35 | 0.30 | 0.00120* | 0.20000 | 0.00011* |
| 1,6‐Anhydroglucose | Carbohydrates | 2.18 | 1.60 | 1.36 | 0.02900* | 0.17000 | 0.33000 |
| 1‐Methylhistamine | Cyclic amines | 2.59 | 1.91 | 1.35 | 0.08500 | 0.17000 | 0.04100* |
| 2,3‐Bisphospho‐glycerate | Acyl phosphates | 0.28 | 0.55 | 0.52 | 0.27000 | 0.04700* | 0.46000 |
| 2‐Aminobutyric acid | Amino acids | 9.70 | 3.60 | 2.69 | <0.00001* | <0.00001* | 0.00540* |
| 2‐Hydroxypyridine | Hydroxy acids | 1.41 | 0.74 | 1.90 | 0.06200 | 0.04100* | 0.00710* |
| 3‐Hydroxy‐butyrate | Hydroxy acids | 2.47 | 1.43 | 1.73 | 0.00015* | 0.04700* | 0.04100* |
| 4‐Aminobutyric acid | Amino acids | 1.22 | 0.57 | 2.14 | 0.13000 | 0.00250* | 0.00077* |
| 4‐Hydroxybenzyl alcohol | Alcohols and polyols | 1.26 | 0.72 | 1.76 | 0.12000 | 0.06000 | 0.01100* |
| 5‐Hydroxyindoleacetate | Indoles and indole derivatives | 2.38 | 1.42 | 1.67 | 0.03200* | 0.23000 | 0.01200* |
| Adenine | Purines and purine derivatives | 1.95 | 1.65 | 1.18 | 0.02800* | 0.05300 | 0.40000 |
| Arabitol | Alcohols and polyols | 0.82 | 0.64 | 1.29 | 0.32000 | 0.03800* | 0.09800 |
| Ascorbic acid | Hydroxy acids | 3.91 | 5.80 | 0.67 | 0.01400* | 0.00290* | 0.59000 |
| α‐Sorbopyranose (or fructose) | Carbohydrates | 1.77 | 1.26 | 1.40 | 0.00210* | 0.14000 | 0.05400 |
| β‐Alanine | Amino acids | 1.30 | 1.06 | 1.22 | 0.02400* | 0.56000 | 0.20000 |
| β‐Glutamic acid | Amino acids | 0.23 | 0.29 | 0.79 | 0.00003* | 0.00330* | 0.20000 |
| Ciliatine | Amino acids | 0.12 | 0.16 | 0.75 | 0.00330* | <0.00001* | 0.32000 |
| Citric acid + isocitric acid | Tricarboxylic acids | 8.18 | 4.60 | 1.78 | 0.16000 | 0.21000 | 0.02600* |
| Cystathionine | Amino acids | 14.67 | 5.34 | 2.75 | <0.00001* | 0.00001* | 0.01300* |
| Cysteine + cystine | Amino acids | 0.44 | 0.44 | 0.99 | 0.00480* | 0.00100* | 0.97000 |
| Dimethylbenzimidazole | Heterocyclic aromatic organic compound | 3.34 | 2.13 | 1.57 | 0.00250* | 0.02100* | 0.19000 |
| Fructose | Carbohydrates | 1.82 | 1.27 | 1.43 | 0.00160* | 0.12000 | 0.04000* |
| Fructose‐6‐phosphate | Sugar phosphates | 3.67 | 1.32 | 2.78 | 0.01400* | 0.42000 | 0.01200* |
| Fucose | Carbohydrates | 2.34 | 1.52 | 1.55 | <0.00001* | 0.00450* | 0.02600* |
| Fumaric acid | Dicarboxylic acids | 0.65 | 0.62 | 1.05 | 0.01000* | 0.06100 | 0.81000 |
| Galactitol | Alcohols and polyols | 2.90 | 1.00 | 2.90 | 0.02100* | 1.00000 | 0.08900 |
| Galactosamine | Carbohydrates | 0.68 | 0.59 | 1.14 | 0.17000 | 0.00058* | 0.56000 |
| Galactose | Carbohydrates | 0.78 | 0.59 | 1.32 | 0.19000 | 0.01800* | 0.17000 |
| Galacturonic acid | Hydroxy acids | 0.61 | 0.71 | 0.87 | 0.05000 | 0.04400* | 0.52000 |
| Glucosamine | Aminoglycosides | 3.22 | 1.25 | 2.59 | 0.27000 | 0.79000 | 0.27000 |
| Glucose | Carbohydrates | 0.53 | 0.61 | 0.88 | 0.01600* | 0.04900* | 0.56000 |
| Glucuronate | Carbohydrates | 0.53 | 0.62 | 0.86 | 0.01300* | 0.03800* | 0.51000 |
| Glutaric acid | Dicarboxylic acids | 0.79 | 0.49 | 1.61 | 0.16000 | 0.00260* | 0.00750* |
| Glyceraldehyde | Alcohols and polyols | 0.88 | 0.68 | 1.30 | 0.50000 | 0.04600* | 0.22000 |
| Glyceric acid | Hydroxy acids | 1.20 | 0.84 | 1.43 | 0.10000 | 0.21000 | 0.02000* |
| Glycerol | Alcohols and polyols | 0.45 | 0.68 | 0.66 | 0.00007* | 0.09800 | 0.03700* |
| Homoserine | Amino acids | 9.43 | 2.95 | 3.20 | <0.00001* | <0.00001* | 0.00007* |
| Hypotaurine | Amino acids | 2.53 | 2.61 | 0.97 | 0.01600* | 0.01400* | 0.90000 |
| Hypoxanthine | Purines and purine derivatives | 3.49 | 6.80 | 0.51 | 0.00007* | 0.00001* | 0.08900 |
| Inositol | Alcohols and polyols | 0.77 | 0.65 | 1.18 | 0.01800* | 0.02400* | 0.30000 |
| Isoleucine | Amino acids | 0.88 | 0.66 | 1.33 | 0.52000 | 0.02700* | 0.17000 |
| Kojic acid | Hydroxy acids | 2.90 | 1.74 | 1.67 | 0.00260* | 0.02200* | 0.13000 |
| Malic acid | Dicarboxylic acids | 0.69 | 0.62 | 1.10 | 0.00210* | 0.04700* | 0.63000 |
| N‐α‐acetyl‐l‐lysine | Amino acids | 0.59 | 0.55 | 1.07 | 0.07000 | 0.03500* | 0.79000 |
| N‐acetyl‐d‐glucosamine | Carbohydrates | 1.16 | 0.79 | 1.47 | 0.43000 | 0.17000 | 0.01500* |
| O‐phosphoethanolamine | Acyl phosphates | 2.43 | 1.05 | 2.33 | 0.00250* | 0.85000 | 0.01400* |
| Ornithine | Amino acids | 0.56 | 0.58 | 0.98 | 0.00700* | 0.01400* | 0.89000 |
| Orotic acid | Pyrimidines and derivatives | 3.35 | 1.51 | 2.22 | 0.00008* | 0.03400* | 0.00260* |
| Oxalate | Dicarboxylic acids | 1.20 | 0.77 | 1.55 | 0.15000 | 0.09200 | 0.01300* |
| Pantothenate | Amino alcohols | 0.50 | 0.47 | 1.07 | 0.00470* | 0.00087* | 0.70000 |
| Putrescine | Polyamines | 14.01 | 13.63 | 1.03 | 0.04700* | 0.04700* | 0.95000 |
| Rhamnose | Carbohydrates | 2.80 | 1.37 | 2.05 | <0.00001* | 0.08700 | 0.01600* |
| Ribose | Carbohydrates | 0.42 | 0.42 | 1.00 | 0.00120* | 0.00150* | 1.00000 |
| Ribulose | Carbohydrates | 0.65 | 0.57 | 1.13 | 0.01600* | 0.01000* | 0.43000 |
| Sarcosine | Amino acids | 10.44 | 2.08 | 5.01 | <0.00001* | 0.00075* | <0.00001* |
| Sorbitol | Alcohols and polyols | 0.62 | 0.71 | 0.86 | 0.04100* | 0.08100 | 0.49000 |
| Succinic acid (or aldehyde) | Dicarboxylic acids | 0.53 | 0.63 | 0.85 | 0.03600* | 0.09800 | 0.55000 |
| Tagatose | Carbohydrates | 2.73 | 1.95 | 1.40 | 0.00030* | 0.00630* | 0.18000 |
| Trans‐4‐hydroxy‐L‐proline | Amino acids | 4.30 | 2.00 | 2.15 | <0.00001* | 0.00011* | 0.00100* |
| Uric acid | Purines and purine derivatives | 0.73 | 0.37 | 1.95 | 0.03300* | 0.00039* | 0.00200* |
| Xylitol | Alcohols and polyols | 0.45 | 0.52 | 0.86 | 0.00160* | 0.00620* | 0.42000 |
Values are represented as the fold‐induction of the peak intensity among polyps (n = 7) and non‐polyp tissues (n = 7) of the APCmin/+ mice, and the corresponding control intestinal tissues (n = 6) of the wild mice. All data are represented in Table S2, and the metabolites that showed significantly altered levels are shown in Table 2. APCmin, APC multiple intestinal neoplasia. P‐values were calculated using Student's t‐test; *P < 0.05.
Metabolite profiling in SW480 cells expressing truncated APC and full‐length APC
To investigate the effects of APC mutation on the levels of intracellular metabolites, SW480 cells expressing truncated APC and full‐length APC were used. In an immunohistochemical examination, the expression of full‐length APC in SW480 cells led to the localization of β‐catenin in the cell membrane (Fig. 2A). Expression of the truncated APC protein in SW480 cells and expression of the full‐length APC protein in SW480 transfectants could be also confirmed by Western blotting (Fig. 2B). Low molecular weight metabolites were extracted from SW480 cells and SW480 transfectants, and a total of 75 metabolites were detected (Fig. 1, Table S3). Among these detected metabolites, the 64 metabolites were shared across the tissues of APCmin/+ mice and SW480 cells (Fig. 1A). In the SW480 cells expressing truncated APC, the levels of 23 and eight metabolites were significantly increased and decreased, respectively, in comparison to those observed in the SW480 transfectants (Table 3). These results suggest that the APC mutation causes alterations in the levels of metabolites in the intracellular environment.
Table 3.
Metabolites that showed significantly altered levels between SW480 colorectal cancer cells expressing truncated APC and those expressing full‐length APC
| Chemical class | Fold induction | P‐value | |
|---|---|---|---|
| Truncated/full‐length APC | Truncated versus full‐length APC | ||
| 1,5‐Anhydro‐d‐glucitol | Carbohydrates | 3.1500 | 0.03200* |
| 1,6‐Anhydroglucose | Carbohydrates | 1.7500 | 0.02900* |
| 2‐Aminopimelic acid | Dicarboxylic acids | 3.0100 | 0.00088* |
| 2‐Hydroxypyridine | Hydroxy acids | 1.4900 | 0.03000* |
| 6‐Hydroxynicotinic acid | Aromatic acids | 0.3900 | 0.02500* |
| Acetoacetic acid | Keto‐acids | 6.3100 | 0.00005* |
| Alanine | Amino acids | 1.4800 | 0.00100* |
| Arabitol | Alcohols and polyols | 0.5200 | 0.04100* |
| Asparagine | Amino acids | 3.7400 | 0.00200* |
| Aspartic acid | Amino acids | 1.8700 | 0.01200* |
| Citric acid + isocitric acid | Tricarboxylic acids | 2.7600 | 0.00077* |
| Creatinine | Amino ketones | 2.2500 | 0.00120* |
| Cystathionine | Amino acids | 3.9600 | 0.00046* |
| Fumaric acid | Dicarboxylic acids | 2.1000 | 0.00920* |
| Glycolic acid | Hydroxy acids | 1.6300 | 0.00089* |
| Gulcono‐1,4‐lactone | Carbohydrates | 2.1800 | 0.00009* |
| Inositol | Alcohols and polyols | 0.4600 | 0.00002* |
| Kojic acid | Hydroxy acids | 2.4900 | 0.01500* |
| Malic acid | Dicarboxylic acids | 5.3300 | <0.00001* |
| Meso‐erythritol | Alcohols and polyols | 0.7200 | 0.00200* |
| Nicotinamide | Cyclic amines | 0.7400 | 0.01000* |
| Nicotinic acid | Amino acids | 0.0017 | <0.00001* |
| N‐methylethanolamine | Amino alcohols | 1.3000 | 0.03500* |
| Proline | Amino acids | 0.4800 | 0.00006* |
| Putrescine | Polyamines | 1.7200 | 0.00087* |
| Pyroglutamic acid | Amino acids | 2.9600 | 0.00021* |
| Pyruvate + oxalacetic acid | Keto‐acids | 1.8400 | 0.04700* |
| Ribitol | Alcohols and polyols | 0.2400 | 0.00001* |
| Succinic acid (or aldehyde) | Dicarboxylic acids | 18.4600 | 0.00008* |
| Tagatose | Carbohydrates | 1.6900 | 0.00530* |
| Thymine | Pyrimidines and derivatives | 2.5800 | 0.00020* |
Values are represented as the fold‐induction of the peak intensity for SW480 cells expressing truncated APC (n = 5) against that for SW480 transfectants expressing full‐length APC (n = 5). All data are represented in Table S3, and the metabolites that showed significantly altered levels are shown in Table 3. P‐values were calculated using Student's t‐test; *P < 0.05.
Metabolite profiling of the sera of nude mice implanted with HT‐29 or SW480 cells
Human epithelial colorectal adenocarcinoma HT‐29 cells express a truncated APC gene.23 Nude mice were implanted s.c. with HT‐29 cells, SW480 cells expressing the truncated APC, and SW480 transfectants expressing the full‐length APC. After the enlargement of the implanted tumor, the mice were killed and their blood obtained. A total of 95 and 84 metabolites were detected in sera of HT‐29 cells and SW480 cells implanted nude mice, respectively (Tables S4,S5). In the sera of the HT‐29 cell‐implanted mice, the levels of 16 and 17 metabolites were significantly increased and decreased, respectively, in comparison with those of the corresponding control mice (Table 4). In addition, the levels of seven and four metabolites were significantly increased and decreased, respectively, in SW480 cells expressing the truncated APC in comparison to the full‐length APC (Table 5).
Table 4.
Metabolites that showed significantly altered serum levels in HT‐29 cell‐implanted nude mice
| Chemical class | Fold induction | P‐value | |
|---|---|---|---|
| HT‐29‐implanted mice/control | HT‐29‐implanted mice versus control | ||
| 2‐Aminoethanol | Amino alcohols | 0.77 | 0.00026* |
| Acetoacetic acid | Keto‐acids | 0.54 | 0.00066* |
| Acetylsalicylic acid | Salicylates | 1.84 | 0.02800* |
| Aspartic acid | Amino acids | 1.39 | 0.03000* |
| β‐Alanine | Amino acids | 0.68 | 0.00930* |
| Citric acid + isocitric acid | Tricarboxylic acids | 0.73 | 0.00260* |
| Citrulline | Amino acids | 1.59 | 0.00140* |
| Fumaric acid | Dicarboxylic acids | 0.47 | 0.00015* |
| Glucose | Carbohydrates | 0.88 | 0.04200* |
| Glyceric acid | Hydroxy acids | 0.78 | 0.00410* |
| Glycerol | Alcohols and polyols | 0.75 | 0.00001* |
| Hippurate | Amino alcohols | 1.68 | 0.02000* |
| Histidine | Amino acids | 1.45 | 0.00710* |
| Homocysteine | Amino acids | 0.64 | 0.03100* |
| Hydrocinnamate | Aromatic acids | 1.94 | 0.01800* |
| Hypoxanthine | Purines and purine derivatives | 0.38 | 0.02500* |
| Isoleucine | Amino acids | 1.48 | 0.00014* |
| Lactic acid | Hydroxy acids | 0.84 | 0.00530* |
| Lysine | Amino acids | 1.20 | 0.02100* |
| Malic acid | Dicarboxylic acids | 0.44 | 0.00009* |
| Ornithine | Amino acids | 2.00 | 0.00029* |
| Phenylalanine | Amino acids | 1.52 | 0.00031* |
| Proline | Amino acids | 1.62 | 0.00780* |
| Pyruvate + Oxalacetic acid | Keto‐acids | 0.58 | 0.00021* |
| Ribose | Carbohydrates | 0.63 | 0.00007* |
| Ribulose | Carbohydrates | 0.55 | 0.00023* |
| Serine | Amino acids | 1.37 | 0.03100* |
| Succinic acid(or aldehyde) | Dicarboxylic acids | 0.62 | 0.00310* |
| Tagatose (or psicose) | Carbohydrates | 2.11 | 0.00090* |
| Threonine | Amino acids | 1.76 | 0.00210* |
| Trans‐4‐hydroxy‐L‐proline | Amino acids | 1.59 | 0.02400* |
| Urea | Amino ketones | 0.88 | 0.04200* |
| Valine | Amino acids | 1.40 | 0.00053* |
Values are represented as the fold‐induction of the peak intensity for HT‐29 cell‐implanted nude mice (n = 9) against that of the corresponding controls (n = 12). All data are represented in Table S4, and the metabolites that showed significantly altered levels are shown in Table 4. P‐values were calculated using Student's t‐test; *P < 0.05.
Table 5.
Metabolites detected in the serum of SW480 cells with truncated APC and SW480 transfectants with full‐length APC implanted in nude mice
| Chemical class | Fold induction (SW480 cell‐implanted nude mice) | P‐value | |||||
|---|---|---|---|---|---|---|---|
| Mutation/full‐length | Full‐length/control | Mutation/control | Mutation versus full | Full versus control | Mutation versus control | ||
| 2‐Hydroxypyridine | Hydroxy acids | 0.35 | 1.77 | 0.62 | 0.0190* | 0.04600* | 0.0540 |
| Alanine | Amino acids | 1.02 | 0.72 | 0.74 | 0.8500 | 0.00800* | 0.0440* |
| Arabitol | Amino acids | 0.55 | 3.67 | 2.01 | 0.0440* | 0.00046* | 0.0100* |
| α‐Sorbopyranose (or fructose) | Carbohydrates | 0.49 | 1.08 | 0.52 | 0.0350* | 0.56000 | 0.0210* |
| Asparagine | Amino acids | 0.81 | 0.82 | 0.67 | 0.2200 | 0.13000 | 0.0260* |
| Coniferyl alcohol | Alcohols and polyols | 1.25 | 0.67 | 0.84 | 0.0170* | 0.00180* | 0.0880 |
| Glucose | Carbohydrates | 1.23 | 0.87 | 1.08 | 0.0052* | 0.07700 | 0.2400 |
| Histidine | Amino acids | 0.90 | 0.77 | 0.69 | 0.3600 | 0.00510* | 0.0046* |
| Ketoisoleucine | Keto‐acids | 1.18 | 0.63 | 0.75 | 0.3300 | 0.00300* | 0.0390* |
| Lactic acid | Hydroxy acids | 1.01 | 0.70 | 0.70 | 0.9100 | 0.00290* | 0.0110* |
| Lauric acid | Fatty acids | 1.02 | 1.09 | 1.11 | 0.5900 | 0.02900* | 0.0021* |
| Lysine | Amino acids | 0.89 | 0.82 | 0.73 | 0.2700 | 0.03400 | 0.0032* |
| Malic acid | Dicarboxylic acids | 0.75 | 0.89 | 0.66 | 0.2600 | 0.49000 | 0.0690 |
| n‐Caprylic acid | Fatty acids | 0.42 | 1.82 | 0.77 | 0.0140* | 0.06600 | 0.6700 |
| Pyruvate + Oxalacetic acid | Keto‐acids | 0.89 | 0.76 | 0.68 | 0.4100 | 0.08000 | 0.0480* |
| Rhamnose | Carbohydrates | 2.07 | 0.57 | 1.18 | 0.0340* | 0.16000 | 0.6100 |
| Ribitol | Alcohols and polyols | 0.27 | 1.70 | 0.46 | 0.0180* | 0.12000 | 0.0970 |
| Ribose | Carbohydrates | 0.66 | 1.34 | 0.88 | 0.0019* | 0.03500* | 0.4800 |
| Succinic acid (or aldehyde) | Dicarboxylic acids | 0.87 | 0.83 | 0.72 | 0.3700 | 0.21000 | 0.0480* |
| Tagatose | Carbohydrates | 1.15 | 0.75 | 0.86 | 0.0380* | 0.34000 | 0.6300 |
| Taurine | Amino acids | 0.65 | 1.86 | 1.21 | 0.0420* | 0.02500* | 0.5700 |
| Uracil | Pyrimidines and derivatives | 1.11 | 0.69 | 0.76 | 0.0640 | 0.00310* | 0.0220* |
| Xylose | Carbohydrates | 0.99 | 0.43 | 0.43 | 0.9700 | 0.02100* | 0.0360* |
Values are represented as the fold‐induction of the peak intensity among nude mice implanted with SW480 cells with truncated APC (n = 4), SW480 transfectants full‐length APC (n = 5), and the corresponding control nude mice (n = 6). All data are represented in Table S5, and the metabolites that showed significantly altered levels are shown in Table 5. P‐values were calculated using Student's t‐test; *P < 0.05.
Changes in amino acid levels induced by APC gene mutation
The changes in the amino acid compositions of the sera and intestinal tissues of mice and SW480 cells were examined. In our experimental conditions, 18 amino acids were detected in the tissues and sera of APCmin/+ mice and sera of SW480 cell‐implanted nude mice. Seventeen amino acids were detected in the sera of HT‐29 cell‐implanted nude mice, and 14 amino acids were detected in SW480 cells (Tables 6, 7,S1–S5). The levels of 10 amino acids were significantly increased in the sera of APCmin/+ mice than in the corresponding control mice, but the serum level of tryptophan in the APCmin/+ mice was only significantly lower than that of the control mice (Table 6). In addition, 10 of the 17 amino acids showed significantly increased serum levels in the HT‐29 cell‐implanted nude mice compared with the control mice, and no amino acids displayed significant decreases (Table 4). There were no significant changes in the serum levels of amino acids between mice implanted with SW480 cells with truncated APC and full‐length APC. In contrast, the levels of four amino acids in the serum of nude mice implanted with SW480 cells expressing truncated APC or full‐length APC were significantly lower than that of the control nude mice (Table 6). In the intestinal tissue, the levels of most amino acids in the non‐polyp tissue of the APC min/+ mice were higher than those in the corresponding control mice and the polyps of the APCmin/+ mice (Table 7). In the SW480 cells expressing truncated APC, the levels of most amino acids were similar or modestly increased compared with those of the SW480 cells expressing full‐length APC (Table 7). The level of cysteine + cystine in the polyps of the APCmin/+ mice was significantly lower than those in the non‐polyp tissue of the APCmin/+ mice and the normal intestinal tissue of the corresponding control mice (Table 2).
Table 6.
Identified major metabolites in sera of APC min/+ mice and SW480 cell‐implanted nude mice
| Pathway and chemical class | Metabolite | Fold induction (APCmin/+ mice) | Fold induction (SW480 cell‐implanted nude mice) | ||
|---|---|---|---|---|---|
| APCmin/+ mice/wild mice | Truncated APC/full‐length APC | Full‐length APC/control | Truncated APC/control | ||
| Glycolysis | Glucose | 1.16 | 1.23* | 0.87 | 1.08 |
| Fructose‐6‐phosphate | 0.63 | n.d. | n.d. | n.d. | |
| Pyruvate + oxalacetic acid | 1.05 | 0.89 | 0.76 | 0.68 | |
| Lactic acid | 1.18 | 1.01 | 0.70** | 0.70** | |
| Tricarboxylic acid cycle | Citric acid + isocitric acid | 1.12 | 0.97 | 0.96 | 0.93 |
| Succinic acid | 1.08 | 0.87 | 0.83 | 0.72* | |
| Fumaric acid | 0.76 | 0.83 | 0.92 | 0.76 | |
| Malic acid | 0.84 | 0.75 | 0.89 | 0.66 | |
| Amino acids (essential) | Histidine | 2.04* | 0.90 | 0.77** | 0.69** |
| Isoleucine | 1.39 | 1.31 | 0.79 | 1.04 | |
| Lysine | 3.08*** | 0.89 | 0.82* | 0.73** | |
| Methionine | 1.26 | 1.11 | 0.87 | 0.96 | |
| Phenylalanine | 1.34* | 1.12 | 0.87 | 0.97 | |
| Threonine | 1.31 | 1.16 | 0.82 | 0.95 | |
| Tryptophan | 0.37* | 0.93 | 1.26 | 1.17 | |
| Valine | 1.34* | 1.17 | 0.85 | 1.00 | |
| Amino acids (non‐essential) | Alanine | 2.01*** | 1.02 | 0.72** | 0.74* |
| Asparagine | 1.98** | 0.81 | 0.82 | 0.67* | |
| Aspartic acid | 1.08 | 0.78 | 1.25 | 0.97 | |
| Cysteine + cystine | 1.79*** | 1.08 | 0.90 | 0.98 | |
| Glutamic acid | 0.72 | 0.70 | 1.31 | 0.92 | |
| Glutamine | 1.35* | 1.00 | 0.82* | 0.81 | |
| Glycine | 1.18 | 1.06 | 0.86 | 0.92 | |
| Proline | 2.68*** | 0.98 | 0.82 | 0.81 | |
| Serine | 1.25 | 0.99 | 0.88 | 0.88 | |
| Tyrosine | 1.46** | 0.94 | 0.87 | 0.82 | |
| Monosaccharides | Allose | 0.50 | n.d. | n.d. | n.d. |
| Arabinose | 1.21 | 0.75 | 1.14 | 0.86 | |
| Fructose | 0.60*** | 1.03 | 1.18 | 1.21 | |
| Fucose | 0.85 | n.d. | n.d. | n.d. | |
| Galactose | 0.78** | n.d. | n.d. | n.d. | |
| Glucosamine | 1.78** | n.d. | n.d. | n.d. | |
| Glucose | 1.16 | 1.23* | 0.87 | 1.08 | |
| Glucuronate | 0.65*** | 1.04 | 0.92 | 0.95 | |
| Gulcono‐1,4‐lactone | 1.25 | n.d. | n.d. | n.d. | |
| Mannose | 1.21* | 0.97 | 0.90 | 0.87 | |
| Rhamnose | n.d. | 2.07* | 0.57 | 1.18 | |
| Ribose | 0.28*** | 0.66** | 1.34* | 0.88 | |
| Ribulose | n.d. | 0.52 | 1.11 | 0.57 | |
| Tagatose | n.d. | 1.15* | 0.75 | 0.86 | |
| Xylulose | 0.58** | n.d. | n.d. | n.d. | |
| Xylose | 1.87 | 0.99 | 0.43* | 0.43* | |
| Alcohols | 2‐Aminoethanol | 0.95 | 0.95 | 0.93 | 0.88 |
| Arabitol | 0.27*** | 0.55* | 3.67*** | 2.01* | |
| Inositol | 1.13 | 0.90 | 1.03 | 0.93 | |
| Lyxose(or xlylose) | 1.52 | n.d. | n.d. | n.d. | |
| Ribitol | 0.45*** | 0.27* | 1.69 | 0.46 | |
| Xylitol | 0.42*** | 0.88 | 1.10 | 0.96 | |
| Nucleobases | Adenine | 2.01*** | n.d. | n.d. | n.d. |
| Thymine | 3.20** | n.d. | n.d. | n.d. | |
| Uracil | 1.74*** | 1.11 | 0.69** | 0.76* | |
Alterations in serum levels of metabolites were shown according to major metabolomic pathways and chemical classes. Values are represented as the fold‐induction between two groups shown in Table 6. APCmin, APC multiple intestinal neoplasia. P‐values were calculated using Student's t‐test; *P < 0.05; **P < 0.01; ***P < 0.001. n.d., not determined.
Table 7.
Identified major metabolites in intestinal tissues of APC min/+ mice and SW480 cells
| Pathway and chemical class | Metabolite | Fold induction (intestinal tissue of APCmin/+ mice) | Fold induction (SW480 cells) | ||
|---|---|---|---|---|---|
| Polyp/control | Polyp/non‐polyp | Non‐polyp/control | Truncated APC/full‐length APC | ||
| Glycolysis | Glucose | 0.53* | 0.61* | 0.88 | 1.29 |
| Fructose‐6‐phosphate | 3.67* | 1.32 | 2.78* | n.d. | |
| Pyruvate + oxalacetic acid | 1.41 | 1.15 | 1.23 | 1.84* | |
| Lactic acid | 0.96 | 0.79 | 1.22 | 0.88 | |
| Tricarboxylic acid cycle | Citric acid + isocitric acid | 8.18 | 4.60 | 1.78* | 2.76*** |
| Succinic acid | 0.53* | 0.63 | 0.85 | 18.46*** | |
| Fumaric acid | 0.65* | 0.62 | 1.05 | 4.61*** | |
| Malic acid | 0.69** | 0.63* | 1.10 | 5.33*** | |
| Amino acids (essential) | Histidine | 0.93 | 0.69 | 1.35 | n.d. |
| Isoleucine | 0.88 | 0.66* | 1.33 | 0.87 | |
| Lysine | 0.77 | 0.64 | 1.20 | 0.70 | |
| Methionine | 0.78 | 0.75 | 1.04 | n.d. | |
| Phenylalanine | 0.87 | 0.73 | 1.18 | 1.00 | |
| Threonine | 1.01 | 0.74 | 1.36 | 0.97 | |
| Tryptophan | 0.92 | 0.75 | 1.23 | 1.49 | |
| Valine | 1.01 | 0.74 | 1.36 | 0.93 | |
| Amino acids (non‐essential) | Alanine | 0.91 | 0.77 | 1.18 | 1.48** |
| Asparagine | 1.01 | 0.79 | 1.27 | 3.74** | |
| Aspartic acid | 1.00 | 0.76 | 1.32 | 1.87* | |
| Cysteine + cystine | 0.44** | 0.44*** | 0.99 | n.d. | |
| Glutamic acid | 0.96 | 0.77 | 1.25 | 2.10** | |
| Glutamine | 1.13 | 0.86 | 1.32 | n.d. | |
| Glycine | 1.10 | 0.80 | 1.37 | 0.83 | |
| Proline | 0.95 | 0.77 | 1.24 | 0.48*** | |
| Serine | 0.99 | 0.77 | 1.28 | 1.49 | |
| Tyrosine | 1.05 | 0.79 | 1.34 | 1.21 | |
| Monosaccharides | Arabinose | 0.92 | 0.70 | 1.31 | n.d. |
| Fructose | 1.82** | 1.27 | 1.43* | 1.09 | |
| Fucose | 2.34*** | 1.52** | 1.55* | n.d. | |
| Galactose | n.d. | 0.78 | 0.59* | 1.32 | |
| Glucosamine | 3.22 | 1.25 | 2.59 | n.d. | |
| Glucose | 0.53* | 0.61* | 0.88 | 1.29 | |
| Glucuronate | 0.53* | 0.62* | 0.86 | n.d. | |
| Gulcono‐1,4‐lactone | n.d. | n.d. | n.d. | 2.18*** | |
| Mannose | 0.84 | 0.75 | 1.13 | n.d. | |
| Rhamnose | 2.80*** | 1.37 | 2.05* | n.d. | |
| Ribose | 0.42** | 0.42** | 1.00 | 0.99 | |
| Ribulose | 0.65 | 0.57 | 1.13 | 0.80 | |
| Tagatose | 2.73*** | 1.95** | 1.40 | 1.69** | |
| Xylose | 0.53 | 0.56 | 0.95 | n.d. | |
| Alcohols | 2‐Aminoethanol | 0.83 | 0.79 | 1.05 | 0.85 |
| Inositol | 0.77* | 0.65* | 1.18 | 0.46*** | |
| Lyxose (or xlylose) | 0.57 | 0.56 | 1.01 | n.d. | |
| Ribitol | 0.84 | 0.80 | 1.05 | 0.24*** | |
| Xylitol | 0.45** | 0.52** | 0.86 | n.d. | |
| Nucleobase | Adenine | 1.95* | 1.65 | 1.18 | 0.87 |
| Cytosine | 1.12 | 0.93 | 1.19 | n.d. | |
| Thymine | 1.28 | 0.98 | 1.32 | 2.58*** | |
| Uracil | 1.27 | 1.02 | 1.24 | 1.01 | |
Alterations in tissue and cellular levels of metabolites are shown according to major metabolomic pathways and chemical classes. Values are represented as the fold‐induction between two groups shown in Table 7. APCmin, APC multiple intestinal neoplasia. P‐values were calculated using the Student's t‐test; *P < 0.05; **P < 0.01; ***P < 0.001. n.d., not determined.
Changes in levels of metabolites associated with the tricarboxylic acid (TCA) cycle induced by APC gene mutation
The changes in the levels of metabolites involved in the TCA cycle induced by APC mutation were evaluated. In our experimental conditions, citric acid + isocitric acid, succinic acid, fumaric acid, and malic acid were detected. In the polyp tissues of the APCmin/+ mice, the levels of citric acid and isocitric acid were higher than in non‐polyp tissues and those of the control mice (Table 7). In the SW480 cells expressing truncated APC, the levels of all of these TCA cycle‐related metabolites were significantly increased compared to those of the SW480 cells expressing full‐length APC (Table 7), indicating that the APC mutation might cause the increases in TCA cycle‐related metabolite levels to gain more energy. In the sera of the APCmin/+ mice and SW480 cell‐implanted nude mice, there were no significant changes in the serum levels of TCA cycle‐related metabolites compared with those of the control mice (Table 6). In contrast, in the sera of the HT‐29 cell‐implanted nude mice, the levels of all of these metabolites were significantly decreased compared with those of the control mice (Table 4).
Changes in proliferation of SW480 cells treated with metabolites
Next, we evaluated whether the metabolites whose levels were altered by APC mutation affect tumor proliferation. The levels of proline, arabitol, inositol, ribitol, isoleucine, 2‐hydroxybutyric acid, and 3‐hydroxypropanic acid tended to be decreased in the polyp lesions of the APCmin/+ mice and SW480 cells expressing truncated APC. The sarcosine level was significantly increased in the polyp lesions of APCmin/+ mice and tended to be increased in SW480 cells expressing truncated APC (Tables 2, 3,S2,S3). Therefore, the growth rate of SW480 cells that had been treated with three different concentrations of each metabolite was investigated. In SW480 cells expressing full‐length APC, the addition of 1 mM inositol significantly increased their proliferation rate (Fig. 3A). The addition of 1 or 10 mM ribitol significantly decreased the proliferation rate of SW480 cells expressing truncated APC (Fig. 3B). The addition of 50 μM sarcosine significantly promoted the growth rate of SW480 cells expressing truncated APC (Fig. 3E). Both 2‐hydroxybutyric acid and 3‐hydroxypropanic acid had similar effects on SW480 cell proliferation at each concentration (Fig. 3C,D). In addition, L‐proline (0.6–1.8 mM), arabitol (0.1–10 mM), and isoleucine (0.6–1.8 mM) did not significantly affect the rate of cell growth (data not shown). These results suggest that some of the metabolites whose levels are altered by APC mutation regulate the tumor environment and proliferation.
Figure 3.
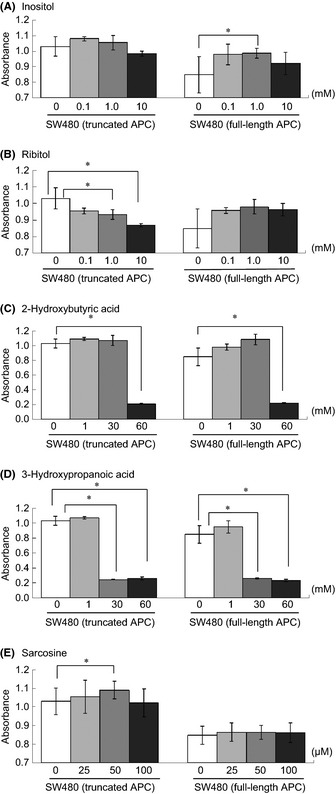
Effects of target metabolites on the cell growth rates of SW480 colorectal cancer cells and SW480 transfectants. SW480 cells were grown at 5 × 10⁴/well in 96‐well plates for 24 h then exposed to the indicated concentrations of inositol (A), ribitol (B), 2‐hydroxybutyric acid (C), 3‐hydroxypropanoic acid (D), and sarcosine (E). After 24 h, the rate of cell growth was evaluated. Data are shown as the mean ± SD, n = 3–10. Statistical significance was analyzed using Student's t‐test, and a level of probability of 0.05 was used as the criterion of significance. *P < 0.05. L‐proline (0.6–1.8 mM), arabitol (0.1–10 mM), and isoleucine (0.6–1.8 mM) did not significantly affect the rate of cell growth (data not shown).
Discussion
To obtain new insights into the mechanisms underlying the aberrant activation of the Wnt pathway that accompanies APC mutation, we carried out a GCMS‐based semiquantitative metabolome analysis using in vitro and in vivo experiments. In intestinal tissue, APC mutation accompanied by activation of the Wnt pathway seems to cause alterations in the levels of various metabolites. In APCmin/+ mice, which display the same histological findings as human colorectal adenomas (Fig. 2C), differences in the metabolite profiles of polyp and non‐polyp regions were observed (Table 2). The serum levels of various metabolites in APCmin/+ mice were significantly altered compared with those of the corresponding control mice (Tables 1,S1). In addition, in nude mice that had been implanted with HT‐29 cells and SW480 cells, the serum levels of various metabolites were markedly altered compared with those of the control nude mice (Tables 4, 5), and an in vitro comparison between SW480 cells expressing truncated APC and those expressing normal APC showed variations in the levels of metabolites between the two cell types (Table 3). These results indicate that the APC mutation in intestinal tissue and/or intestinal epithelial cells causes alterations in the metabolome by activation of the Wnt pathway.
As expected from the notion that the tumor microenvironment induces many changes in energetic metabolite pathways in order to gain sufficient energy for cell proliferation, the levels of intermediates involved in the latter stages of the intracellular TCA cycle, including succinic acid, fumaric acid, and malic acid, were significantly higher in SW480 cells expressing truncated APC than in SW480 transfectants expressing full‐length APC (Tables 3, 7). Hirayama et al.17 showed that the levels of three TCA metabolites, succinic acid, fumaric acid, and malic acid, were significantly higher in colorectal tumor tissues and that the active use of fumarate respiration by cancer cells may provide a feasible and intriguing explanation for the accumulation of fumaric acid and succinic acid. Some parasites and bacteria are able to synthesize ATP in anaerobic conditions by producing fumaric acid, which accepts electrons from succinic acid.24 This process is known as fumarate respiration, and the pattern of changes in the levels of TCA cycle intermediates observed in the SW480 cells with truncated APC was also indicative of fumarate respiration. On the contrary, no significant increases in the levels of these TCA cycle intermediates were observed in the polyp regions of APCmin/+ mice (i.e., adenoma). It was shown that an anthelminthic, pyrvinium pamoate, which is an inhibitor of fumarate respiration, inhibited the growth of the human colon cancer cell line WiDr and the human pancreatic cancer cell line PANC‐1.25 These findings suggest that APC mutation causes changes in energetic metabolite pathways, and such regulation might lead to the discovery of therapeutic strategies for colorectal carcinoma.
Amino acid profiles also seem to be important for understanding APC mutation and the subsequent Wnt pathway activation. Hirayama et al.17 reported that the levels of most amino acids, except glutamine, were significantly higher in colorectal cancer tissues than in normal colon tissues, indicating that a relationship exists between colorectal cancer and amino acids. In this study, the levels of most amino acids tended to be higher in the non‐polyp tissues of the APCmin/+ mice than in the normal tissues of the control mice (Table 7). The amino acid levels in the polyp tissues of APCmin/+ mice also tended to be lower than those in non‐polyp tissues (Tables 7,S2). These results indicate that APC mutation is the first step in colorectal cancer development and causes variations in amino acid profiles, and such changes might lead to the formation of polyps. One of the reasons why the changes in amino acid levels are induced by APC mutation is that autophagy might be responsible. Autophagy is a catabolic process involving the degradation of a cell's own components by lysosomal machinery, resulting in the production of peptides and amino acids by protein degradation. The autophagy pathway is downregulated in colorectal tumor tissues,26 while a mutation in p53 was found to impair autophagic flux and cause excessive LC3 accumulation upon starvation, culminating in apoptosis.27 Therefore, the studies about the interrelationship between amino acid profiles and autophagy must be needed to understand the colorectal cancer in detail.
In metabolite profiling, significantly lower levels of lactic acid were observed in the sera of mice implanted with HT‐29 cells, SW480 cells, and SW480 transfectants (Tables 4, 5, 6). These results differ from observations in previous studies using clinical samples obtained from colorectal cancer patients.16 The serum levels of lactic acid in colorectal cancer and other cancer patients were higher than in healthy volunteers.11, 28 However, lower serum levels of lactic acid were observed in patients with metastatic colorectal cancer.29 Gluconeogenesis of metastatic colorectal cancer patients may mask anaerobic dissimilation of glucose at the end stage of cancer,30 and the condition of human colorectal tumor xenograft model mice may be similar to metastatic colorectal cancer patients. In addition, it could be confirmed that there were differences in metabolite profiling between the sera of nude mice implanted with SW480 cells expressing truncated APC and SW480 transfectants expressing full‐length APC (Table 5), suggesting that the presence of tumor in the body would lead to alterations in serum metabolome. Although the number of metabolites with significant differences between the sera of SW480 cell‐ and SW480 transfectant‐implanted nude mice were small, some interesting alterations in serum metabolome were evident. Serum levels of arabitol and ribitol in the SW480 cell‐implanted nude mice were significantly lower than those of the SW480 transfectant‐implanted nude mice, and these phenomena were similar to alterations in the intracellular levels of SW480 cells and SW480 transfectants (Tables 5, 6). In addition, ribitol could affect the proliferation of SW480 cells with truncated APC (Fig. 3B). These results suggest that a decrease in the level of ribitol in tumor cells by APC mutation might cause the proliferation of tumor cells.
Metabolism is the set of chemical reactions occurring in a cell to keep it living, growing, and dividing, indicating that the tumor microenvironment may cause many changes in metabolism to gain more energy. As described above, ribitol was suggested as one metabolite affecting tumor cell proliferation. Ribitol reduced the growth of SW480 cells expressing the APC mutation, but it did not affect the growth of SW480 transfectants expressing full‐length APC (Fig. 3B). Bello et al.31 revealed that 5‐o‐alkyl 1,4‐imino‐1,4‐dideoxyribitols are active as inhibitors of cancer cell growth, and it was shown that the inhibitory activity depends on the length of the alkyl side chain, although the anticancer activity of ribitol itself has not been investigated. In contrast, 1 mM inositol significantly increased the proliferation rate of SW480 transfectants expressing full‐length APC (Fig. 3A). It was previously reported that the inositol level in colon polyps were significantly decreased and that glycolysis may be critical in early tumorigenesis.32 Therefore, the action of inositol on the tumor cells may lead to upregulation of glycolysis and cancer cell growth. Treatment of 2‐hydroxybutyric acid and 3‐hydroxypropanoic acid caused similar effects on SW480 cell proliferation at each concentration (Fig. 3C,D). These results may be due to the cell toxicity of 2‐hydroxybutyric acid and 3‐hydroxypropanoic acid, and this action would be independent of APC mutation in the cells, although their cell toxicity was not reported until now. In this study, we observed interesting behavior of sarcosine, an N‐methyl derivative of the amino acid glycine. Sreekumar et al.10 revealed that the level of sarcosine was highly increased during prostate cancer progression to metastasis and that it can be detected non‐invasively in urine. In our study, we found that the serum levels of sarcosine were significantly higher in APCmin/+ mice than in corresponding control mice (Table 1), and they were significantly higher in polyp tissues than in non‐polyp tissues of APCmin/+ mice (Table 2). The treatment of SW480 cells expressing truncated APC with 50 μM sarcosine resulted in a significant increase in their rate of growth (P = 0.043, Fig. 2E). In a previous study, LNCaP cells, a human prostate cancer cell line, exposed to 25, 50, and 100 μM showed upregulated HER2/neu mRNA expression with the strongest effect being seen at 50 μM,17 and an increase in the intracellular sarcosine concentration was observed in cells exposed to 50 μM sarcosine.10 Therefore, cancer cells might be regulated by sarcosine within a small concentration range. In prostate cancer cells, it was reported that the levels of sarcosine might be involved in the regulation of HER2/neu33 and that they were correlated with the tumor suppressor activity of the transmembrane protein with epidermal growth factor and two follistatin motifs 2,34 although the relationship between sarcosine and human colorectal cancer remains to be confirmed. Taken together, sarcosine and related molecules might have potential as biomarkers of early colorectal cancer involving APC mutation and could serve as targets of new therapeutic interventions.
In conclusion, we analyzed the metabolomic status of cells and tissues with APC gene mutation and found that the APC gene might regulate amino acid‐related pathways and other energy‐related metabolomic pathways. It was also suggested that some metabolites might influence cancer cell proliferation. This metabolomic study will aid the discovery of novel biomarkers for early cancer and the development of cancer‐specific therapies, and the results from this study increase our understanding of colorectal cancer.
Disclosure Statement
The authors have no conflict of interest.
Supporting information
Table S1. Metabolites detected in the sera of APC min/+ mice and wild‐type mice.
Table S2. Metabolites detected in the tissues of APC min/+ mice and wild‐type mice.
Table S3. Metabolites detected in SW480 cells with truncated APC and full‐length APC.
Table S4. Metabolites detected in the serum of HT‐29 cell‐implanted nude mice.
Table S5. Metabolites detected in the serum of SW480 cells with truncated APC‐ or full‐length APC‐implanted nude mice.
Acknowledgments
This study was supported by grants from the Research Fellows of the Global COE Program (Global Center of Excellence for Education and Research on Signal Transduction Medicine in the Coming Generation) from the Ministry of Education, Culture, Sports, Science, and Technology of Japan (to T.Y., M.Y., and T.A.), and from the Ministry of Agriculture, Forestry and Fisheries of Japan (Development of fundamental technology for analysis and evaluation of functional agricultural products and functional foods) (to M.Y.).
References
- 1. Parkin M, Freddie B, Ferlay J, Pisani P. Global cancer statistics, 2002. CA Cancer J Clin 2005; 55: 74–108. [DOI] [PubMed] [Google Scholar]
- 2. Kinzler KW, Vogelstein B. Lessons from hereditary colorectal cancer. Cell 1996; 87: 159–70. [DOI] [PubMed] [Google Scholar]
- 3. Fearon ER, Vogelstein B. A genetic model for colorectal tumorigenesis. Cell 1990; 61: 759–67. [DOI] [PubMed] [Google Scholar]
- 4. Powell SM, Zilz N, Beazer‐Barclay Y et al APC mutations occur early during colorectal tumorigenesis. Nature 1992; 359: 235–7. [DOI] [PubMed] [Google Scholar]
- 5. Nishisho I, Nakamura Y, Miyoshi Y et al Mutation of chromosome 5q21 genes in FAP and colorectal cancer patients. Science 1991; 253: 665–9. [DOI] [PubMed] [Google Scholar]
- 6. Bodmer WF, Bailey CJ, Bodmer J et al Localization of the gene for familial adenomatous polyposis on chromosome 5. Nature 1987; 328: 614–6. [DOI] [PubMed] [Google Scholar]
- 7. Leppert M, Dobbs M, Scambler P et al The gene for familial polyposis coli maps to the long arm of chromosome 5. Science 1987; 238: 1411–3. [DOI] [PubMed] [Google Scholar]
- 8. Chafey P, Finzi L, Boisgard R et al Proteomics analysis of β‐catenin activation in mouse liver by DIGE analysis identifies glucose metabolism as a new target of the Wnt pathway. Proteomics 2009; 9: 3889–900. [DOI] [PubMed] [Google Scholar]
- 9. Petricoin EF, Ardekani AM, Hitt BA et al Use of proteomic patterns in serum to identify ovarian cancer. Lancet 2002; 359: 572–7. [DOI] [PubMed] [Google Scholar]
- 10. Sreekumar A, Poisson LM, Rajendiran TM et al Metabolomic profiles delineate potential role for sarcosine in prostate cancer progression. Nature 2009; 457: 910–5. [DOI] [PMC free article] [PubMed] [Google Scholar] [Research Misconduct Found]
- 11. Nishiumi S, Shinohara M, Ikeda A et al Serum metabolomics as a novel diagnostic approach for pancreatic cancer. Metabolomics 2010; doi: 10.1007/s11306-010-0224-9 [Epub ahead of print]. [DOI] [Google Scholar]
- 12. Shiomi Y, Nishiumi S, Ooi M et al GCMS‐based metabolomic study in mice with colitis induced by dextran sulfate sodium. Inflamm Bowel Dis 2011; doi: 10.1002/ibd.21616 [Epub ahead of print]. [DOI] [PubMed] [Google Scholar]
- 13. Yoshida M, Hatano N, Nishiumi S et al Diagnosis of gastroenterological diseases by metabolome analysis using gas chromatography‐mass spectrometry. J Gastroenterol 2012; 47: 9–20. [DOI] [PubMed] [Google Scholar]
- 14. Ooi M, Nishiumi S, Yoshie T et al The GC/MS‐based profiling of amino acids and TCA cycle‐related molecules in ulcerative colitis. Inflamm Res 2011; 60: 831–40. [DOI] [PubMed] [Google Scholar]
- 15. Kondo Y, Nishiumi S, Shinohara M et al Serum fatty acid profiling of colorectal cancer by gas chromatography/mass spectrometry. Biomark Med 2011; 5: 451–60. [DOI] [PubMed] [Google Scholar]
- 16. Ikeda A, Nishiumi S, Shinohara M et al Serum metabolomics as a novel diagnostic approach for gastrointestinal cancer. Biomed Chromatogr 2011; doi: 10.1002/bmc.1671 [Epub ahead of print]. [DOI] [PubMed] [Google Scholar]
- 17. Hirayama A, Kami K, Sugimoto M et al Quantitative metabolome profiling of colon and stomach cancer microenvironment by capillary electrophoresis time‐of‐flight mass spectrometry. Cancer Res 2009; 69: 4918–25. [DOI] [PubMed] [Google Scholar]
- 18. Su LK, Kinzler KW, Vogelstein B et al Multiple intestinal neoplasia caused by a mutation in the murine homolog of the APC gene. Science 1992; 256: 668–70. [DOI] [PubMed] [Google Scholar]
- 19. Yamada Y, Mori H. Multistep carcinogenesis of the colon in Apc min/+ mouse. Cancer Sci 2007; 98: 6–10. [DOI] [PMC free article] [PubMed] [Google Scholar]
- 20. Faux MC, Ross JL, Meeker C et al Restoration of full‐length adenomatous polyposis coli (APC) protein in a colon cancer cell line enhances cell adhesion. J Cell Sci 2004; 117: 427–39. [DOI] [PubMed] [Google Scholar]
- 21. Tsugawa H, Bamba T, Shinohara M, NIshiumi S, Yoshida M, Fukusaki E. Practical non‐targeted gas chromatography/mass spectrometry‐based metabolomics platform for metabolic phenotype analysis. J Biosci Bioeng 2011; doi: 10.1016/j.jbiosc.2011.05.001 [Epub ahead of print]. [DOI] [PubMed] [Google Scholar]
- 22. Fujishima Y, Nishiumi S, Masuda A et al Autophagy in the intestinal epithelium reduces endotoxin‐induced inflammatory responses by inhibiting NF‐κB activation. Arch Biochem Biophys 2011; 506: 223–35. [DOI] [PubMed] [Google Scholar]
- 23. Roy UK, Henkhaus RS, Iqnatenko NA, Mora J, Fultz KE, Gerner EW. Wild‐type APC regulates caveolin‐1 expression in human colon adenocarcinoma cell lines via FOXO1a and C‐myc. Mol Carcinog 2008; 47: 947–55. [DOI] [PMC free article] [PubMed] [Google Scholar]
- 24. Kita K, Hirawake H, Miyadera H, Amino H, Takeo S. Role of complex II in anaerobic respiration of the parasite mitochondria from Ascaris suum and Plasmodium falciparum. Biochim Biophys Acta 2002; 1553: 123–39. [DOI] [PubMed] [Google Scholar]
- 25. Esumi H, Lu J, Kurashima Y, Hanaoka T. Antitumor activity of pyrvinium pamoate, 6‐(dimethylamino)‐2‐[2‐(2,5‐dimethyl‐1‐phenyl‐1H‐pyrrol‐3‐yl)ethenyl]‐1‐methyl‐quinolinium pamoate salt, showing preferential cytotoxicity during glucose starvation. Cancer Sci 2004; 95: 685–90. [DOI] [PMC free article] [PubMed] [Google Scholar]
- 26. Chang YT, Tseng HC, Huang CC, Chen YP, Chiang HC, Chou FP. Relative down‐regulation of apoptosis and autophagy genes in colorectal cancer. Eurs J Clin Invest 2011; 41: 84–92. [DOI] [PubMed] [Google Scholar]
- 27. Scherz‐Shouval R, Weidberg H, Gonen C, Wilder S, Elazar Z, Oren M. p53‐dependent regulation of autophagy protein LC3 supports cancer cell survival under prolong starvation. Proc Natl Acad Sci USA 2010; 107: 18511–6. [DOI] [PMC free article] [PubMed] [Google Scholar]
- 28. Hori S, Nisiumi S, Kobayhashi K et al A metabolomic approach to lung cancer. Lung Cancer 2011; 74: 284–92. [DOI] [PubMed] [Google Scholar]
- 29. Bertini I, Cacciatore S, Jensen BV et al Metabolomin NMR fingerprinting to identify and predict survival of patients with metastatic colorectal cancer. Cancer Res 2012; 72: 356–64. [DOI] [PubMed] [Google Scholar]
- 30. Bongaerts GPA, van Halteren HK, Verhagen CAM, Wagener DJT. Cancer cachexia demonstrates the energetic impact of gluconeogenesis in human metabolism. Med Hypotheses 2006; 67: 1213–22. [DOI] [PubMed] [Google Scholar]
- 31. Bello C, Bello GD, Cea M et al Anti‐cancer activity of 5‐o‐alkyl 1,4‐imino‐1,4‐dideoxyribitols. Bioorg Med Chem 2011; 19: 7720–7. [DOI] [PubMed] [Google Scholar]
- 32. Ong ES, Zou L, Li S, Cheah PY, Eu KW, Ong CN. Metabolic profiling in colorectal cancer reveals signature metabolic shifts during tumorigenesis. Mol Cell Proteomics 2010; doi: 10.1074/mcp.M900551‐MCP200 [Epub ahead of print]. [DOI] [PubMed] [Google Scholar]
- 33. Dahl M, Bouchelouche P, Kramer‐Marek G, Capala J, Nordling J, Bouchelouche K. Sarcosine induces increase in HER2/neu expression in androgen‐dependent prostate cancer cells. Mol Biol Rep 2011; 38: 4237–43. [DOI] [PMC free article] [PubMed] [Google Scholar]
- 34. Chen X, Overcash R, Green T, Hoffman D, Asch AS, Ruiz‐Echevarria MJ. The tumor suppressor activity of the transmembrane protein with epidermal growth factor and two follistatin motifs 2 (TMEFF2) correlates with its ability to modulate. J Biol Chem 2011; 286: 16091–100. [DOI] [PMC free article] [PubMed] [Google Scholar]
Associated Data
This section collects any data citations, data availability statements, or supplementary materials included in this article.
Supplementary Materials
Table S1. Metabolites detected in the sera of APC min/+ mice and wild‐type mice.
Table S2. Metabolites detected in the tissues of APC min/+ mice and wild‐type mice.
Table S3. Metabolites detected in SW480 cells with truncated APC and full‐length APC.
Table S4. Metabolites detected in the serum of HT‐29 cell‐implanted nude mice.
Table S5. Metabolites detected in the serum of SW480 cells with truncated APC‐ or full‐length APC‐implanted nude mice.