

Abstract
C4.4A is a glycolipid‐anchored membrane protein expressed in several human malignancies. The aim of this study was to explore the association between C4.4A expression at the invasion front of colorectal cancer (CRC) and tumor budding, a putative hallmark of cell invasion of CRC. Advanced CRCs (T2–4, n = 126) had a budding count of 3.66 ± 5.66, which was significantly higher than that of T1 early CRCs (1.75 ± 2.78, n = 87). C4.4A‐positive CRC specimens showed a larger budding cell number than C4.4A‐negative CRC specimens in T1 CRCs, and especially advanced CRCs (9.45 ± 5.83 vs 1.60 ± 3.93). Furthermore, we found a correlation between the percentage of C4.4A‐positive cases and budding count in advanced CRC. Multivariate analysis for patients' survival showed that C4.4A was superior to tumor budding as a prognostic factor. With siRNA treatment, C4.4A levels were associated with cell invasion, but not with proliferation, in HCT116 and DLD1 cell lines. An immunohistochemical study in a subset of CRCs showed no relationship between C4.4A and Ki‐67 proliferation marker. In vitro assays using HCT116 indicated that C4.4A levels correlated well with epithelial–mesenchymal transition (EMT) with regard to cell morphology and alterations of EMT markers including E‐cadherin, vimentin, and partially N‐cadherin. We also found that C4.4A expression was significantly associated with loss of E‐cadherin and gain of β‐catenin in clinical CRC tissue samples. These findings suggest that a tight association between C4.4A and tumor budding may, in part, be due to C4.4A promoting EMT at the invasive front of CRC. (Cancer Sci 2012; 103: 1155–1164)
The C4.4A protein has been identified in a highly metastasizing rat pancreatic adenocarcinoma cell line but not in locally growing rat tumors.1, 2 Rat C4.4A cDNA was cloned in 1998, and the molecular structure indicates GPI‐anchored membrane proteins with 30% homology to the urokinase‐type plasminogen activator receptor.3 Subsequently, the human homologue of rat C4.4A, located on chromosome 19q13.1–q13.2, was cloned in 2001.4 In normal human tissues, C4.4A mRNA is present in placental tissue, skin, esophagus, and peripheral blood leukocytes but not in other tissues, based on Northern blot analysis.4 Although the physiological function of the C4.4A protein is largely unknown, upregulation of C4.4A expression has been observed during the wound‐healing process of migrating keratinocytes or urothelium.5, 6
Recent studies have shown that C4.4A expression is also present in subsets of human malignancies. Human C4.4A mRNA has been detected in cancer cell lines, including melanoma, breast, bladder, and renal cell carcinoma, as well as in tumor tissue samples from malignant melanoma, colorectal cancer (CRC), breast cancer, lung carcinoma, and urothelial tumors.6, 7, 8, 9, 10 C4.4A expression increases in metastatic lymph nodes and metastasized skin lesions compared with primary malignant melanoma,7 and evidence suggests that C4.4A expression is associated with poor prognosis of patients with non‐small‐cell lung cancer.9
Tumor budding, a pathologic characteristic of CRC, is defined as the occurrence of a single tumor cell or clusters consisting of up to four cells at the invasion front of the tumor.11, 12 Tumor budding is reportedly associated with various clinicopathological parameters, including lymph node metastasis, vascular and lymphatic invasion, distant metastasis, local recurrence, and poor outcome.11, 12, 13, 14, 15, 16, 17, 18 It also has been classified as an additional prognostic factor by the UICC.19
We recently found that expression of the C4.4A protein at the invasive front is a novel prognostic marker in CRC.20 During that study, we often observed an intense staining of the C4.4A protein on the plasma membrane of budding foci adjacent to the invasive front of the CRC. To elucidate the molecular basis that contributes to the promotion of tumor budding, we investigated the association between tumor budding and C4.4A expression in CRC samples. We comparatively analyzed tumor budding in early CRCs (UICC T1, n = 87) and advanced CRCs (UICC T2–4, n = 126) in relation to C4.4A expression. We also examined the relationship between C4.4A‐expressing cells and cells positive for the cell proliferation marker Ki‐67. In vitro studies were done to assess growth and invasion of colon cancer cells with knocked‐down or enhanced C4.4A gene expression. In an effort to explore the underlying mechanism between C4.4A and tumor budding, we further examined whether C4.4A would promote EMT, as tumor budding was reportedly linked to EMT change in clinical tissue samples including CRC.21, 22, 23
Materials and Methods
Tissue samples and cell lines
Colorectal tissue samples (n = 213) were collected during surgery at the Department of Surgery, Osaka University (Osaka, Japan), including T1 CRCs (n = 87) (1990–2004) that invaded the submucosa layer, and T2–4 CRCs (n = 126) (1995–2007) that invaded the muscularis propria, subserosa, and other organs or structures and/or perforated the visceral peritoneum. In this study, none of the patients had preoperative chemotherapy or irradiation. As adjuvant therapy, patients with stage III/IV were treated with 5‐fluorouracil‐based chemotherapy.
Samples were fixed in buffered formalin at 4°C overnight, processed through graded ethanol solutions, and embedded in paraffin. The specimens were appropriately used under approval by the ethics committee at the Graduate School of Medicine, Osaka University. The human colon cancer cell lines HCT116, DLD1, LoVo, and Caco2 were obtained from the ATCC (Manassas, VA, USA). These cells were grown in DMEM supplemented with 10% FBS, 100 U/mL penicillin, and 100 μg/mL streptomycin, and grown at 37°C in a humidified incubator, under 5% CO2 in air.
Antibodies
Anti‐human C4.4A polyclonal antibody20 was used for this study. Among the full amino acid sequences of human C4.4A,6 the sequence AGHQDRSNSGQYPAKG at the C‐terminus containing a portion of the GPI anchor was selected as the immunogen.
Anti‐human Ki‐67 mAb (BD Pharmingen, San Diego, CA, USA), anti‐human E‐cadherin mAb (Dako, Glostrup, Denmark), and anti‐human β‐catenin mAb (Invitrogen, Carlsbad, CA, USA) were also used.
Immunohistochemistry
Tissue sections (4 μm thick) were prepared from paraffin‐embedded blocks. After antigen retrieval treatment in 10 mM citrate buffer (pH 6.0) at 95°C for 40 min, immunostaining was carried out using the Vectastain ABC peroxidase kit (Vector Laboratories, Burlingame, CA, USA) as we have described previously.24, 25 The slides were incubated with appropriate antibodies overnight at 4°C at the following dilutions: C4.4A, 1:200; Ki‐67, 1:50; E‐cadherin, 1:75; β‐catenin; 1:75. Non‐immunized rabbit IgG or mouse IgG (Vector Laboratories) was used as a negative control and substituted for the primary antibody to exclude possible false‐positive responses from the secondary antibody or from non‐specific binding of IgG.
Assessment of tumor budding
Tumor budding was estimated according to the definition proposed by Ueno et al.11, 16 An isolated cancer cell or a cluster composed of fewer than five cancer cells (1, 2, 3, or 4) was defined as tumor budding. The number of buddings was counted in the field under a magnification of ×200 in the invasive front area. The tumor buddings were classified as low grade (0–9 budding foci per microscopic field) or high grade (10 or more budding foci per microscopic field).
Transfection of small interfering RNAs and plasmids
For siRNA inhibition, double‐stranded RNA duplexes targeting human C4.4A were as follows: 5′‐GGAUGAAUUCUGCACUCGGGAUGGA‐3′/5′‐UCCAUCCCGAGUGCAGAAUUCAU‐CC‐3′ (siRNA I, HSS120350; Invitrogen); 5′‐GCUGUAACUCUGACCUCCGCAACAA‐3′/5′‐UUGUUGCGGAGGUCAGAGUUACAGC‐3′ (siRNA II, HSS120351; Invitrogen); and 5′‐CAACGUCACCUUGACGGCAGCUAAU‐3′/5′‐AUUAGCUGCCGUCAAGGUGACGUUG‐3′ (siRNA III, HSS178302; Invitrogen). Negative‐control siRNAs were purchased in a Stealth RNAi kit (Invitrogen). Colorectal cancer cell lines were transfected with siRNA using Lipofectamine RNAiMAX (Invitrogen) according to the manufacturer's protocols. Plasmids with the human C4.4A NM_014400 (Origene, Rockville, MD, USA) were transiently transfected with Lipofectamine 2000 (Invitrogen). An empty vector pCMV6‐XL5 was used as a mock control.
Proliferation assay
Cells were uniformly seeded (5 × 10⁴ per well) into 12‐well dishes in triplicate and grown in a complete medium supplemented with 10% FBS. After 24, 48, and 72 h, the cells were counted using a hemocytometer.
Invasion assay
Using Transwell cell culture chambers (BD Biosciences, Franklin Lakes, NJ, USA), the invasion assay was carried out as described previously.26 Briefly, 5 × 10⁵ cells were seeded in triplicate on the Matrigel‐coated membrane. After 48 h, cells that had invaded the undersurface of the membrane were fixed with 100% methanol and stained with 1% toluidine blue. Three microscopic fields were randomly selected for cell counting.
Quantitative real‐time PCR
Total RNA was extracted using TRIzol reagent (Life Technologies, Rockville, MD, USA). cDNA was generated from 1 μg total RNA with avian myeloblastosis virus reverse transcriptase (Promega, Madison, WI, USA). Quantitative real‐time PCR was carried out using LightCycler (Idaho Technology, Salt Lake City, UT, USA) as described previously.27 Quantification data from each sample were analyzed using the LightCycler analysis software.
The primer sequences8 used in this study were: C4.4A sense, 5′‐AAGAATGACCGCGGCCTGGATC‐3′; C4.4A antisense, 5′‐GACATGATCGCTGGCGTTGTAG‐3′; E‐cadherin sense, 5′‐CCCGGGACAACGTTTATTAC‐3′; antisense, 5′‐GCTGGCTCAAGTCAAAGTCC‐3′; N‐cadherin sense, 5′‐ACAGTGGCCACCTACAAAGG‐3′; N‐cadherin antisense, 5′‐CCGAGATGGGGTTGATAATG‐3′; vimentin sense, 5′‐AAAGTGTGGCTGCCAAGAAC‐3′; and vimentin antisense, 5′‐AGCCTCAGAGAGGTCAGCAA‐3′. The amount of each transcript was normalized against the expression of the housekeeping gene, G3PDH, from the same sample with the primers: sense, 5′‐CAACTACATGGTTTACATGTTC‐3′; and antisense, 5′‐GCCAGTGGACTCCACGAC‐3′.28
Statistical analysis
Statistical analysis was carried out using the JMP8 program (SAS Institute, Cary, NC, USA). The Kaplan–Meier method was used to estimate tumor recurrence from CRC, and the log–rank test was used to determine the statistical significance. Associations between discrete variables were assessed using the chi‐square test. Mean values were compared using the Mann–Whitney U‐test. Spearman's rank correlation test was used to analyze the correlation between two factors. For continuous variables used in the in vitro analysis, data are expressed as mean ± SD and were analyzed with the Wilcoxon rank test. P‐values < 0.05 were considered statistically significant.
Results
Tumor budding in CRC tissue
Representative images of tumor budding adjacent to the invasive front of T1 CRC or advanced CRC are shown in Figure 1(A,B). Tumor budding was noted in 43 of 87 T1 CRC cases (49.4%), and 54 of 126 advanced CRC cases (42.9%). The T1 CRCs had a budding (foci) count of 1.75 ± 2.78, and the advanced CRCs had 3.66 ± 5.66; the difference was significant (P = 0.004; Fig. 1C). The number of T1 CRC cases when stratified by budding count was as follows: budding count 1–4, n = 31; 5–9, n = 9; and ≥10, n = 3 (Fig. 1D). The number of advanced CRC cases was as follows: budding count 1–4, n = 18; 5–9, n = 14; and ≥10, n = 22 (Fig. 1E). When the advanced CRC cases were classified into two groups, that is, high‐grade budding (≥10, n = 22) and low‐grade budding (0–9, n = 104), as previously reported,11 the presence of lymph node metastasis was significantly greater in the high‐grade budding group (P = 0.005; Table 1). Survival analysis indicated that the high‐grade budding group was significantly associated with poorer prognosis when compared to the low‐grade budding group in both 5‐year OS and 5‐year DFS (P < 0.0001 and P = 0.004, respectively; Fig. S1).
Figure 1.
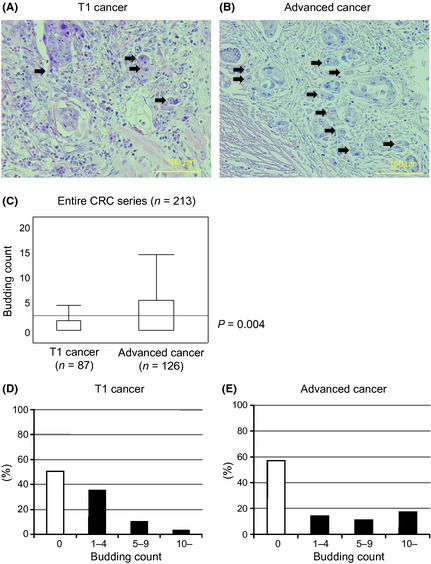
Tumor budding in colorectal cancer (CRC). (A) Tumor budding (arrows) at the invasive front of specimens from early T1 CRC (H&E). (B) Tumor budding (arrows) at the invasive front of specimens from advanced T2–4 CRC (H&E). (C) The budding count of advanced CRC was significantly greater than for T1 CRC (P = 0.004). (D) The number of T1 CRC cases when stratified by budding count: 0, n = 44; 1–4, n = 31; 5–9, n = 9; ≥10, n = 3. (E) The number of advanced CRC cases when stratified by budding count: 0, n = 72; 1–4, n = 18; 5–9, n = 14; ≥10, n = 22. Magnification, (A) ×200; (B) ×200.
Table 1.
Budding count and clinicopathological features of colorectal cancer
| Budding count |
Low grade (0–9) (n = 104) |
High grade (≥10) n = 22) |
P‐value |
|---|---|---|---|
| Factors | Number | Number | |
|
Tumor size (median ± SD) |
5.02 ± 2.39 | 4.85 ± 1.74 | 0.638 |
| Depth of invasion | |||
| ~mp | 20 | 3 | 0.763 |
| ss~ | 84 | 19 | |
| Differentiation | |||
| Well, mod | 94 | 22 | 0.208 |
| Por, muc | 10 | 0 | |
| Lymph invasion | |||
| Negative | 17 | 1 | 0.195 |
| Positive | 87 | 21 | |
| Lymph node metastasis | |||
| Negative | 59 | 5 | 0.005a |
| Positive | 45 | 17 | |
| Venous invasion | |||
| Negative | 71 | 12 | 0.226 |
| Positive | 33 | 10 | |
| Distant metastasis | |||
| Negative | 87 | 16 | 0.234 |
| Positive | 17 | 6 | |
| Peritoneal dissemination | |||
| Negative | 96 | 22 | 0.349 |
| Positive | 8 | 0 | |
Statistically significant. Mod, moderately differentiated adenocarcinoma; mp, muscularis propria; muc, mucinous carcinoma; por, poorly differentiated adenocarcinoma; ss, subserosa; well, well‐differentiated adenocarcinoma.
C4.4A expression and tumor budding
In either T1 CRCs or advanced CRCs, C4.4A expression was present on the plasma membrane at the invasive front, whereas C4.4A was weakly expressed in the cytoplasm in the superficial and intermediate portions of the specimen (Fig. 2A,B). Membranous C4.4A expression was found at the tumor frontier in 12 of 87 T1 CRCs (13.8%) and 33 of 126 advanced CRCs (26.2%).
Figure 2.
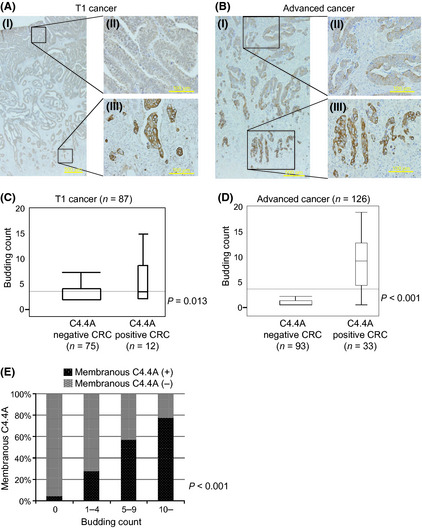
Expression of C4.4A and budding count in colorectal cancer (CRC). Strong C4.4A expression was present on the plasma membrane at the invasive front, whereas C4.4A was weakly expressed in the cytoplasm in the superficial or intermediate portion of these specimens. (A) Positive pattern of C4.4A staining at the invasive front of specimens from T1 CRC. (B) Positive pattern of C4.4A staining at the invasive front of specimens from advanced T2–4 CRC. (C,D) The budding count of T1 and advanced CRC with C4.4A positivity is significantly greater than for C4.4A negativity (P = 0.013 and P < 0.0001, respectively). (E) The C4.4A‐positive ratio for budding‐negative was 4.2%, and the ratio for a budding count ≥10 was 77.3%. The C4.4A‐positive ratio significantly correlated with the number of buddings (P < 0.001, Spearman's rank correlation coefficient). (A) Magnification, (I) ×12.5; (II) ×200; (III) ×200. (B) Magnification, (I) ×40; (II) ×200; (III) ×200.
In T1 CRC cases, the C4.4A‐positive cases had a budding count of 3.58 ± 0.78, whereas the C4.4A‐negative cases had a count of 1.45 ± 0.31. The difference was statistically significant (P = 0.013; Fig. 2C). In advanced CRC cases, the C4.4‐positive cases had a markedly larger budding count (9.45 ± 5.83) than did C4.4A‐negative cases (1.60 ± 3.93), with a statistical difference (P < 0.001; Fig. 2D). Furthermore, we found a clear correlation between the percentage of C4.4A‐positive cases and budding count in advanced CRC (P < 0.001; Fig. 2E).
Multivariate analysis for patient survival
Univariate analysis showed that the following factors were significantly related to 5‐year OS: tumor size; lymph node metastasis; distant metastasis; peritoneal dissemination; high‐grade budding; and C4.4A expression (Table 2a). Multivariate analysis revealed that C4.4A expression, lymph node metastasis, and peritoneal metastasis (P = 0.02, P = 0.002, and P = 0.02, respectively) but not tumor budding were independent prognostic factors (Table 2a).
Table 2.
(a) Overall survival analysis in colorectal cancer patients (n = 126) (b) disease‐free survival analysis in colorectal cancer patients (n = 81)
| Univariate analysis | P‐value | Multivariate analysis | ||
|---|---|---|---|---|
| Risk ratio | Confidence interval | P‐value | ||
| (a) | ||||
| Tumor size (≥4.8 vs <4.8 cm)a | 0.048b | 2.149 | 0.936–5.263 | 0.072 |
| Depth of invasion (~mp vs ss~) | 0.199 | – | – | – |
| Differentiation (well, mod vs por, muc) | 0.483 | – | – | – |
| Lymph invasion (positive vs negative) | 0.165 | – | – | – |
| Lymph node metastasis (positive vs negative) | 0.001b | 4.896 | 1.754–17.451 | 0.002b |
| Venous invasion (positive vs negative) | 0.532 | – | – | – |
| Distant metastasis (positive vs negative) | 0.0004b | 10.435 | 0.837–133.270 | 0.067 |
| Peritoneal dissemination (positive vs negative) | 0.045b | 5.545 | 1.341–20.449 | 0.020b |
| Expression of C4.4A (positive vs negative) | 0.001b | 3.928 | 1.245–12.582 | 0.020b |
| Budding (high grade vs low grade) | 0.0003b | 1.761 | 0.620–5.300 | 0.292 |
| (b) | ||||
| Tumor size (≥5.0 vs <5.0 cm)a | 0.116 | – | – | – |
| Depth of invasion (~mp vs ss~) | 0.735 | – | – | – |
| Differentiation (well, mod vs por, muc) | 0.088 | – | – | – |
| Lymph invasion (positive vs negative) | 0.967 | – | – | – |
| Lymph node metastasis (positive vs negative) | 0.014b | 2.714 | 1.005–8.075 | 0.049b |
| Venous invasion (positive vs negative) | 0.645 | – | – | – |
| Expression of C4.4A (positive vs negative) | 0.001b | 3.890 | 1.314–11.658 | 0.015b |
| Budding (high grade vs low grade) | 0.013b | 1.149 | 0.366–3.620 | 0.810 |
Median tumor size.
Statistically significant. –, not tested; mod, moderately differentiated adenocarcinoma; mp, muscularis propria; muc, mucinous carcinoma; por, poorly differentiated adenocarcinoma; ss, subserosa; well, well‐differentiated adenocarcinoma.
In stage II and III CRCs (n = 81), univariate analysis showed that lymph node metastasis, high‐grade budding, and C4.4A expression were significantly related to 5‐year DFS. The C4.4A expression and lymph node metastasis (P = 0.015 and P = 0.049, respectively) but not tumor budding were identified as independent prognostic factors by multivariate analysis (Table 2b).
In vitro effects of C4.4A on cell growth and invasion
The results of the RT‐PCR assay showed that colon cancer cell lines varied in C4.4A mRNA levels (Fig. 3A). Using the HCT116 cell line that showed high C4.4A expression, treatment with three different siRNAs against C4.4A (siRNAs I, II, and III) yielded a considerable reduction in C4.4A mRNA compared to negative‐control siRNA (Fig. 3B‐1). Proliferation assays indicated that the knockdown of C4.4A resulted in no change in the number of HCT116 cells (Fig. 3B‐2). However, invasion assays showed that siRNA treatment caused a decrease in invasive HCT116 cells at 48 h (P < 0.05; Fig. 3B‐3,B‐4).
Figure 3.
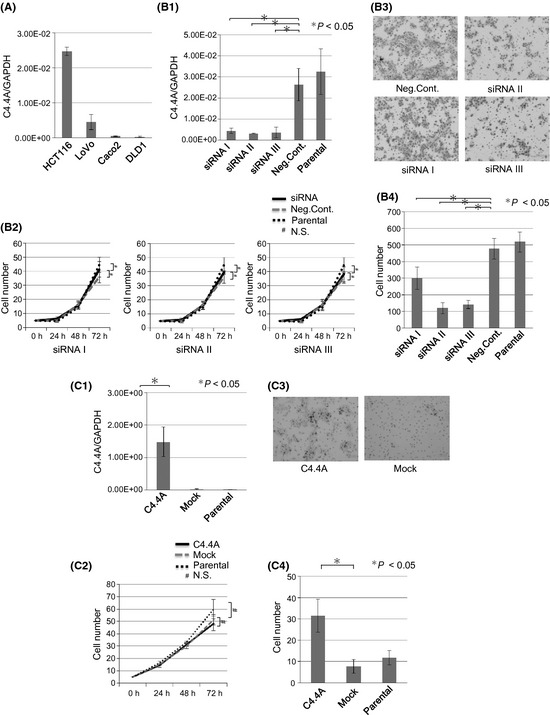
In vitro growth and invasion by C4.4A levels. (A) The C4.4A expression study indicated that HCT116 and LoVo cells had higher levels of expression compared to other colorectal cancer cell lines such as Caco2 and DLD1, by RT‐PCR. (B) Knockdown assessment of C4.4A by siRNA in the HCT116 cell line. (B‐1) HCT116 cells were transfected for 24 h with siRNA using Lipofectamine RNAiMAX. Confirmation of reduced C4.4A mRNA levels was made using RT‐PCR. (B‐2) Proliferation assay showed growth of the HCT116 cell line. There were no significant differences between Neg.Cont. (transfection control of scramble sequence) and siRNAs I, II, and III. (B‐3,4) Invasion assay revealed that siRNAs I, II, and III were significantly less invasive than Neg.Cont. (B‐3) Magnification, ×200. Values are the mean ± SD of three independent experiments. (C) C4.4A transfection assessment using a plasmid in the DLD1 cell line. (C‐1) DLD1 cells were transfected for 24 h with plasmid using Lipofectamine 2000. Confirmation of C4.4A mRNA levels was by RT‐PCR. (C‐2) Proliferation assay showed growth of the plasmid‐containing DLD1 cell line. There were no significant differences between empty vector transfection control (Mock) and C4.4A plasmid‐transfected cells (C4.4A). (C‐3) Invasion assay showed that C4.4A‐transfected cells increased invasion compared to Mock cell lines. Magnification, ×200. Values are the mean ± SD of four independent experiments. N.S., not significant; Parental, a control without transfection.
Using the DLD1 cell line that expressed low levels of C4.4A mRNA, we transiently introduced C4.4A cDNA (Fig. 3C‐1). Cell proliferation was not affected (Fig. 3C‐2), but forced expression of C4.4A resulted in increased cell invasion of DLD1 at 48 h (P < 0.05, Fig. 3C‐3,C‐4).
Comparative immunostaining for C4.4A and Ki‐67 proliferation marker
We then carried out a comparative immunohistochemical study between C4.4A and the Ki‐67 proliferation marker in a subset of C4.4A‐positive CRCs (n = 23). Membranous C4.4A expression was exclusively found at the invasive front of CRCs tested (Fig. S2A), whereas Ki‐67‐positive cells were randomly distributed (Fig. S2B). No clear relationship between C4.4A and Ki‐67 expression was found.
In vitro studies on EMT of HCT116 cells
The cells treated with negative control siRNA often displayed a spindle‐shaped, fibroblast‐like morphology when seeded at high cell density and these features were more evident when cells were seeded at a low density (Fig. 4A). In contrast, C4.4A knocked‐down cells by siRNA II adopted an epithelial cell‐like morphology, with a more rounded cell shape, and cell–cell adhesion was obvious at a high cell density. This morphological feature was maintained even in a low density culture (Fig. 4A). The RT‐PCR assays indicated that E‐cadherin mRNA significantly increased (P < 0.05) and vimentin mRNA significantly decreased (P < 0.05) in C4.4A knocked‐down cells. However, no significant change was noted in N‐cadherin mRNA levels (Fig. 4B).
Figure 4.
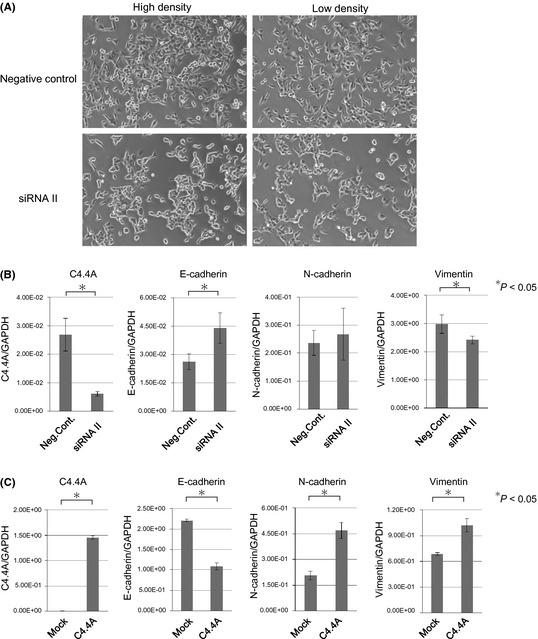
In vitro studies on epithelial–mesenchymal transition of HCT116 colon cancer cells. (A) Morphological changes of HCT116 cells when treated with siRNA II. The cells were transfected for 48 h with C4.4A siRNA II using Lipofectamine RNAiMAX. Control HCT116 cells showed a fibroblast‐like morphology, but after C4.4A inhibition, they adopted an epithelial cell‐like morphology. Representative photographs at a high density culture and at a low density culture are shown. Magnification, ×100. (B) Cells were collected 24 h after transfection with negative control siRNA or C4.4A siRNA II. Quantitative RT‐PCR showed the mRNA levels of each culture. Values are the mean ± SD of three independent experiments. *Statistical significance. Neg.Cont., transfection control of scramble sequence; siRNA, C4.4A siRNA. (C) C4.4A plasmid and empty vector (pCMV6‐XL5) were introduced into HCT116 cells. Forty‐eight hours after transfection, cells were collected and subjected to RT‐PCR assays. Values are the mean ± SD of three independent experiments. C4.4A, C4.4A plasmid‐transfected cells; Mock, empty vector transfection control.
In contrast, forced overexpression of C4.4A cDNA did not show apparent morphological changes, showing similar fibroblast‐like morphology to the control cultures (data not shown). In the RT‐PCR assays, we found that C4.4A overexpression led to significant decrease in E‐cadherin mRNA, and increase in N‐cadherin mRNA and vimentin mRNA (P < 0.05 for each) (Fig. 4C).
Immunohistochemistry for E‐cadherin and β‐catenin in CRC tissues
We carried out immunohistochemical staining of E‐cadherin and β‐catenin in C4.4A‐positive CRCs (n = 31) and C4.4A‐negative CRCs (n = 35). In a considerable fraction of CRCs, E‐cadherin expression was reduced or lost and nuclear β‐catenin with cytoplasmic accumulation increased at the invasive front, when compared to CRCs in the superficial portions (Fig. 5). As summarized in Table 3, C4.4A expression was significantly associated with a decrease in E‐cadherin expression (P = 0.0002) and an increase in β‐catenin expression (P = 0.0058).
Figure 5.
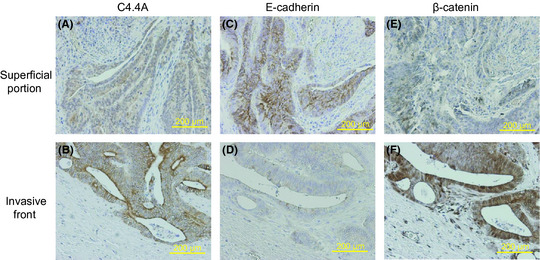
Immunohistochemistry for C4.4A, E‐cadherin and β‐catenin in clinical CRC samples. Both the superficial portion (A,C,E) and the invasive front (B,D,F) of the cancer body are shown. At the invasive front, the C4.4A protein was translocated onto the plasma membrane (A), E‐cadherin expression was largely reduced (D), and nuclear β‐catenin increased with cytoplasmic accumulation (F). Magnification, ×100.
Table 3.
Expression of C4.4A, E‐cadherin, and β‐catenin in colorectal cancer tissues (n = 66)
| C4.4 negative (n = 35) | C4.4 positive (n = 31) | P‐value | |
|---|---|---|---|
| E‐cadherin | |||
| Decreasea | 16 | 28 | 0.0002c |
| Others | 19 | 3 | |
| β‐catenin | |||
| Increaseb | 9 | 19 | 0.0058c |
| Others | 26 | 12 | |
cadherin expression is reduced or lost at the invasive front compared to that at the superficial portion of the cancer body.
Nuclear β‐catenin with cytoplasmic accumulation increases at the invasive front compared to that at the superficial portion of the cancer body.
Statistically significant.
Discussion
We previously showed a significant association between high expression of C4.4A mRNA and shorter OS in CRC.20 In that study, we also found that the anti‐C4.4A antibody, which recognizes the C‐terminus of C4.4A, indicated intense C4.4A expression on the plasma membrane at the invasive front in 25.8% of CRC tissue samples.
Tumor budding is a hallmark of invasion of CRC that appears at the invasive front. Our previous study showed that a membranous C4.4A expression pattern was linked to venous invasion and depth of tumor invasion, so we developed the hypothesis that the C4.4A protein might be responsible for the generation or expansion of tumor budding.
To address this issue, we examined the tumor budding count in relation to C4.4A expression at the tumor invasion front. We also prepared clinical samples of 87 T1 early cancers and compared the results with advanced cancers (T2–T4) to assess whether C4.4A might affect budding formation at an early stage or contribute to expansion of budding foci at a relatively late stage during progression.
We found that the number of budding foci significantly increased from 1.75 ± 2.78 to 3.66 ± 5.66. Because the percentage of tumors with budding foci was similar between early cancer (49.4%) and advanced cancer (42.9%), it appears that the individual tumor may be destined at an early stage to produce or not produce budding foci. In early cancer, the number of budding foci was still small, and the majority were associated with 1–4 budding foci (35.6%) (Fig. 1D). It is noteworthy that CRCs with 10 or more budding foci increased from 3.5% to 17.5% from early cancer to advanced cancer. These findings suggest that budding foci produced at the early stage subsequently increase during tumor progression.
We then examined the relationship between budding count and membranous C4.4A expression at the tumor invasive front. In early cancer, the budding count in C4.4A‐positive tumors (3.58 ± 0.78) was significantly higher than in C4.4A‐negative tumors (1.45 ± 0.31). This difference markedly increased in advanced cancer. Thus, C4.4A‐positive samples had 9.45 ± 5.83 budding foci, whereas C4.4A‐negative samples had only 1.60 ± 3.93 budding foci. Further detailed analysis indicated a close relationship between budding count and C4.4A positivity (Fig. 2E). Of note, 77.3% of CRCs (17/22) harboring more than 10 or more budding foci were C4.4A‐positive cases. Conversely, CRCs devoid of budding foci were almost all C4.4A‐negative cases (95.8%, 69/72). These findings strongly suggest that the C4.4A protein positively acts to contribute to the expansion of budding foci in the process of tumor progression.
Several studies have indicated that tumor budding is a strong unfavorable prognostic factor in CRC.11, 12, 17, 29, 30, 31 We also found in this study that high‐grade budding (budding count ≥10) was a significant predictor of poor prognosis and disease recurrence in CRC. However, we found that C4.4A expression, but not tumor budding, remained as an independent prognostic factor by multivariate analysis, suggesting that C4.4A, rather than the budding foci, may be a superb predictor of disease recurrence in CRC. This outcome is not surprising because, as we showed previously, C4.4A expression is highly predictive of hematogenous metastases to liver and lung in CRC,20 which are the major reasons for CRC‐related death. Similar to our findings, several large‐scale studies indicated that tumor budding was associated with lymph node metastasis, but not always related to venous invasion.32, 33, 34, 35
To assess how C4.4A helps to increase tumor budding, we examined cell proliferation in relation to C4.4A expression. In vitro knockout of C4.4A or introduction of C4.4A cDNA did not affect growth of colon cancer cells, either. Immunohistochemistry for Ki‐67 revealed no correlation between C4.4A‐positive cells and cycling cells with proliferative activity in a subset of CRC tissue samples (Fig. S2). These findings indicate that an increase in budding foci is not simply the result of cell cycle acceleration. To maintain budding status (of which cell number is <5) and to increase the number of budding foci, cells need to migrate and divide. In this context, a report by Paret et al. is of interest; they found that C4.4A supports cell migration through the binding of laminin 5, a putative molecular marker for tumor budding.36, 37, 38 In the 3‐D cancer microenvironment, however, cells need to not only migrate, but also invade the ECM, which led us to carry out invasion assays. The invasion assay, using a Boyden chamber, revealed that the C4.4A level was clearly associated with the cell‐invasive ability of HCT116 and DLD1 colon cancer cell lines. Based on these findings, it is postulated that the C4.4A‐expressing cells invade into the ECM, which may help to maintain budding status and may also facilitate release of the budding foci easily from the tumor invasive front, resulting in an increased budding count as compared to C4.4A‐negative tumors.
To further investigate the underlying molecular mechanism of how C4.4A helps to increase tumor budding, we examined the role of C4.4A in EMT. Tumor budding is reportedly associated with loss of E‐cadherin and gain of β‐catenin, which are putative molecular changes during EMT in CRC and tongue squamous cell carcinoma.21, 22, 23 For in vitro assessment of EMT, we used HCT116 cells because they have a spindle, fibroblast‐like shape that represents mesenchymal features, and we could either enhance or reduce C4.4A expression levels by the genetic engineering technique. Using siRNA II, the most effective siRNA (see Fig. 3B), C4.4A inhibition drastically altered the morphology of HCT116 cells from the fibroblast‐like shape to a more epithelial appearance (Fig. 4A). As cell–cell contact increased, E‐cadherin levels increased, and vimentin mRNA decreased. When we overexpressed C4.4A cDNA in HCT116 cells, we did not find morphological changes, probably because the intrinsic C4.4A level may be enough to represent the spindle‐shaped, fibroblastic morphology. However, we should emphasize that intracellular signaling modulated by C4.4A overexpression is clearly linked to typical changes in EMT markers, that is, increase in vimentin and N‐cadherin levels, and decrease in E‐cadherin.
Based on these findings in vitro, we raised the hypothesis that C4.4A could promote EMT at the invasive front of CRC tissue. We carried out immunohistochemistry for E‐cadherin and β‐catenin in clinical CRC samples and found a strong association between C4.4A expression and loss of E‐cadherin (P = 0.0002), and gain of nuclear β‐catenin with cytoplasmic accumulation (P = 0.0058). In addition, C4.4A expression was associated with gain of either nuclear β‐catenin alone (P = 0.027) or cytoplasmic accumulation of β‐catenin alone (P = 0.006) (data not shown). We could not detect vimentin expression in tumor cells, although intense vimentin expression was noted in fibroblasts in cancer‐associated stroma, as we previously reported in a separate CRC series39 (data not shown). Taken together, it is likely that C4.4A could play a crucial role in promoting EMT at the tumor invasive front of CRC, which may help invasion of budding foci. This finding may also account for the reason why C4.4A was linked to venous invasion and metastasis of CRC.
In conclusion, the present study revealed that membranous expression of C4.4A at the tumor front was tightly associated with an increase in tumor budding of CRC. We found that C4.4A was a superior prognostic factor in CRC compared to tumor budding. Our data suggest that C4.4A may contribute to increasing the budding foci through the enhancement of cell invasion by the EMT mechanism.
Disclosure Statement
The authors have no conflicts of interest.
Abbreviations
- CRC
colorectal cancer
- DFS
disease‐free survival
- EMT
epithelial–mesenchymal transition
- GPI
glycosylphosphatidyl‐inositol
- OS
overall survival
- UICC
International Union Against Cancer
Supporting information
Fig. S1. Tumor budding grade and patient prognosis.
Fig. S2. Immunohistochemistry of C4.4A and Ki‐67 expression in colorectal cancer.
Acknowledgments
We thank K. Konishi for valuable discussions. This work was supported by a Grant‐in Aid for Cancer Research from the Ministry of Education, Science, Sports and Culture Technology, Japan, to H.Y. (Grant No. 21390360).
References
- 1. Matzku S, Wenzel A, Liu S, Zller M. Antigenic differences between metastatic and nonmetastatic BSp73 rat tumor variants characterized by monoclonal antibodies. Cancer Res 1989; 49: 1294. [PubMed] [Google Scholar]
- 2. Claas C, Herrmann K, Matzku S, Mller P, Zller M. Developmentally regulated expression of metastasis‐associated antigens in the rat. Cell Growth Differ 1996; 7: 663. [PubMed] [Google Scholar]
- 3. Roesel M, Claas C, Seiter S, Herlevsen M, Zoeller M. Cloning and functional characterization of a new phosphatidyl‐inositol anchored molecule of a metastasizing rat pancreatic tumor. Oncogene 1998; 17: 1989–2002. [DOI] [PubMed] [Google Scholar]
- 4. Wurfel J, Seiter S, Stassar M et al Cloning of the human homologue of the metastasis‐associated rat C4. 4A. Gene 2001; 262: 35–41. [DOI] [PubMed] [Google Scholar]
- 5. Smith BA, Kennedy WJ, Harnden P, Selby PJ, Trejdosiewicz LK, Southgate J. Identification of genes involved in human urothelial cell‐matrix interactions: implications for the progression pathways of malignant urothelium. Cancer Res 2001; 61: 1678. [PubMed] [Google Scholar]
- 6. Hansen LV, Grdsvoll H, Nielsen BS et al Structural analysis and tissue localization of human C4. 4A: a protein homologue of the urokinase receptor. Biochem J 2004; 380: 845. [DOI] [PMC free article] [PubMed] [Google Scholar]
- 7. Seiter S, Stassar M, Rappl G, Reinhold U, Tilgen W, Zller M. Upregulation of C4. 4 A expression during progression of melanoma. J Investig Dermatol 2001; 116: 344–7. [DOI] [PubMed] [Google Scholar]
- 8. Fletcher G, Patel S, Tyson K et al hAG‐2 and hAG‐3, human homologues of genes involved in differentiation, are associated with oestrogen receptor‐positive breast tumours and interact with metastasis gene C4. 4a and dystroglycan. Br J Cancer 2003; 88: 579–85. [DOI] [PMC free article] [PubMed] [Google Scholar]
- 9. Hansen LV, Skov BG, Ploug M, Pappot H. Tumour cell expression of C4. 4A, a structural homologue of the urokinase receptor, correlates with poor prognosis in non‐small cell lung cancer. Lung Cancers 2007; 58: 260–6. [DOI] [PubMed] [Google Scholar]
- 10. Paret C, Hildebrand D, Weitz J et al C4. 4A as a candidate marker in the diagnosis of colorectal cancer. Br J Cancer 2007; 97: 1146–56. [DOI] [PMC free article] [PubMed] [Google Scholar]
- 11. Ueno H, Murphy J, Jass J, Mochizuki H, Talbot I. Tumourbudding'as an index to estimate the potential of aggressiveness in rectal cancer. Histopathology 2002; 40: 127–32. [DOI] [PubMed] [Google Scholar]
- 12. Hase K, Shatney C, Johnson D, Trollope M, Vierra M. Prognostic value of tumor “budding“ in patients with colorectal cancer. Dis Colon Rectum 1993; 36: 627–35. [DOI] [PubMed] [Google Scholar]
- 13. Nakanishi Y, Ohara M, Doumen H, Kimura N, Ishidate T, Kondo S. Correlation between tumor budding and post‐resection prognosis in patients with invasive squamous cell carcinoma of the thoracic esophagus. World J Surg 2010; 35: 1–8. [DOI] [PubMed] [Google Scholar]
- 14. Tanaka M. Tumor budding at the invasive margin can predict patients at high risk of recurrence after curative surgery for stage II, T3 colon cancer. Dis Colon Rectum 2003; 46: 1054–9. [DOI] [PubMed] [Google Scholar]
- 15. Ueno H, Mochizuki H, Hashiguchi Y, Hatsuse K, Fujimoto H, Hase K. Predictors of extrahepatic recurrence after resection of colorectal liver metastases. Br J Surg 2004; 91: 327–33. [DOI] [PubMed] [Google Scholar]
- 16. Ueno H, Mochizuki H, Hashiguchi Y et al Risk factors for an adverse outcome in early invasive colorectal carcinoma. Gastroenterology 2004; 127: 385–94. [DOI] [PubMed] [Google Scholar]
- 17. Shinto E, Jass JR, Tsuda H et al Differential prognostic significance of morphologic invasive markers in colorectal cancer: tumor budding and cytoplasmic podia. Dis Colon Rectum 2006; 49: 1422–30. [DOI] [PubMed] [Google Scholar]
- 18. Tateishi Y, Nakanishi Y, Taniguchi H, Shimoda T, Umemura S. Pathological prognostic factors predicting lymph node metastasis in submucosal invasive (T1) colorectal carcinoma. Mod Pathol 2010; 23: 1068–72. [DOI] [PubMed] [Google Scholar]
- 19. Gospodarowicz MK, O'Sullivan B, Sobin LH. Cancer IUa. Prognostic Factors in Cancer. Hoboken, NJ: Wiley‐Liss, 2006. [Google Scholar]
- 20. Konishi K, Yamamoto H, Mimori K et al Expression of C4. 4A at the invasive front is a novel prognostic marker for disease recurrence of colorectal cancer. Cancer Sci 2010; 101: 2269–77. [DOI] [PMC free article] [PubMed] [Google Scholar]
- 21. Zlobec I, Lugli A. Epithelial mesenchymal transition and tumor budding in aggressive colorectal cancer: tumor budding as oncotarget. Oncotarget 2010; 1: 651–61. [DOI] [PMC free article] [PubMed] [Google Scholar]
- 22. Wang C, Huang H, Huang Z et al Tumor budding correlates with poor prognosis and epithelial‐mesenchymal transition in tongue squamous cell carcinoma. J Oral Pathol Med 2011; 40: 545–51. [DOI] [PMC free article] [PubMed] [Google Scholar]
- 23. Jang TJ. Expression of E‐cadherin and β‐catenin is altered at tumor budding sites, whose number is associated with the progression of colorectal carcinoma. Korean J Pathol 2009; 43: 523. [Google Scholar]
- 24. Hayashi N, Yamamoto H, Hiraoka N et al Differential expression of cyclooxygenase‐2 (COX‐2) in human bile duct epithelial cells and bile duct neoplasm. Hepatology 2001; 34: 638–50. [DOI] [PubMed] [Google Scholar]
- 25. Noura S, Yamamoto H, Ohnishi T et al Comparative detection of lymph node micrometastases of stage II colorectal cancer by reverse transcriptase polymerase chain reaction and immunohistochemistry. J Clin Oncol 2002; 20: 4232. [DOI] [PubMed] [Google Scholar]
- 26. Hoshino H, Miyoshi N, Nagai K et al Epithelial‐mesenchymal transition with expression of SNAI1‐induced chemoresistance in colorectal cancer. Biochem Biophys Res Commun 2009; 390: 1061–5. [DOI] [PubMed] [Google Scholar]
- 27. Yamamoto H, Kondo M, Nakamori S, Nagano H. JTE‐522, a cyclooxygenase‐2 inhibitor, is an effective chemopreventive agent against rat experimental liver fibrosis1,* 1. Gastroenterology 2003; 125: 556–71. [DOI] [PubMed] [Google Scholar]
- 28. Makino T, Yamasaki M, Takeno A et al Cytokeratins 18 and 8 are poor prognostic markers in patients with squamous cell carcinoma of the oesophagus. Br J Cancer 2009; 101: 1298–306. [DOI] [PMC free article] [PubMed] [Google Scholar]
- 29. Wang LM, Kevans D, Mulcahy H et al Tumor budding is a strong and reproducible prognostic marker in T3N0 colorectal cancer. Am J Surg pathol 2009; 33: 134. [DOI] [PubMed] [Google Scholar]
- 30. Nakamura T, Mitomi H, Kanazawa H, Ohkura Y, Watanabe M. Tumor budding as an index to identify high‐risk patients with stage II colon cancer. Dis Colon Rectum 2008; 51: 568–72. [DOI] [PubMed] [Google Scholar]
- 31. Kanazawa H, Mitomi H, Nishiyama Y et al Tumour budding at invasive margins and outcome in colorectal cancer. Colorectal Dis 2008; 10: 41–7. [DOI] [PubMed] [Google Scholar]
- 32. Märkl B, Renk PI, Oruzio DV et al Tumour budding, uPA and PAI‐1 are associated with aggressive behaviour in colon cancer. J Surg Oncol 2010; 102: 235–41. [DOI] [PubMed] [Google Scholar]
- 33. Ogawa T, Yoshida T, Tsuruta T et al Tumor budding is predictive of lymphatic involvement and lymph node metastases in submucosal invasive colorectal adenocarcinomas and in non‐polypoid compared with polypoid growths. Scand J Gastroenterol 2009; 44: 605–14. [DOI] [PubMed] [Google Scholar]
- 34. Okuyama T, Oya M, Ishikawa H. Budding as a risk factor for lymph node metastasis in pT1 or pT2 well‐differentiated colorectal adenocarcinoma. Dis Colon Rectum 2002; 45: 628–34. [DOI] [PubMed] [Google Scholar]
- 35. Koike M, Kodera Y, Itoh Y et al Multivariate analysis of the pathologic features of esophageal squamous cell cancer: tumor budding is a significant independent prognostic factor. Ann Surg Oncol 2008; 15: 1977–82. [DOI] [PubMed] [Google Scholar]
- 36. Masaki T, Matsuoka H, Sugiyama M et al Laminin‐5 ƒÁ2 chain expression as a possible determinant of tumor aggressiveness in T1 colorectal carcinomas. Dig Dis Sci 2003; 48: 272–8. [DOI] [PubMed] [Google Scholar]
- 37. Pyke C, Rmer J, Kallunki P et al The gamma 2 chain of kalinin/laminin 5 is preferentially expressed in invading malignant cells in human cancers. Am J Pathol 1994; 145: 782. [PMC free article] [PubMed] [Google Scholar]
- 38. Nilsson PJ. Tumour budding detected by laminin‐5 2‐chain immunohistochemistry is of prognostic value in epidermoid anal cancer. Ann Oncol 2005; 16: 893–8. [DOI] [PubMed] [Google Scholar]
- 39. Ngan C, Yamamoto H, Seshimo I et al Quantitative evaluation of vimentin expression in tumour stroma of colorectal cancer. Br J Cancer 2007; 96: 986–92. [DOI] [PMC free article] [PubMed] [Google Scholar]
Associated Data
This section collects any data citations, data availability statements, or supplementary materials included in this article.
Supplementary Materials
Fig. S1. Tumor budding grade and patient prognosis.
Fig. S2. Immunohistochemistry of C4.4A and Ki‐67 expression in colorectal cancer.