Abstract
Purpose
SARS-CoV-2 virus dynamics in different hosts and different samples and their relationship with disease severity have not been clearly revealed. The aim of this study is to evaluate the viral loads of 6 different sample types (nasopharyngeal/oropharyngeal combined, oral cavity, saliva, rectal, urine, and blood) of patients with different ages and clinics, to reveal the relationship between disease course and SARS-CoV-2 viral load, and differences in viral loads of asymptomatic and symptomatic patients.
Methods
Nasopharyngeal/oropharyngeal, oral cavity, saliva, rectal, urine, and blood samples are collected from patients who were hospitalized with diagnosis of COVID-19 on admission. Laboratory analysis were carried out at Public Health Institute of Turkey Virology Reference and Research Laboratory.
Results
A total of 360 samples from 60 patients were obtained on admission. Fifteen (25%) of the patients were asymptomatic while 45 (75%) were symptomatic. A significant difference was found between mean ages of asymptomatic vs symptomatic patients (26.4 and 36.4, respectively, p = 0.0248). No PCR positivity were found in blood. Only one asymptomatic patient had positive PCR result for urine sample. Viral loads of asymptomatic patients were found to be significantly higher (p = 0.0141) when compared with symptomatic patients. Viral load had a significant negative trend with increasing age. A significant decrease in viral load was observed with increasing disease severity.
Conclusion
In conclusion, this study demonstrates that asymptomatic patients have higher SARSCoV-2 viral loads than symptomatic patients and unlike in the few study in the literature, a significant decrease in viral load of nasopharyngeal/oropharyngeal samples was observed with increasing disease severity. Factors associated with poor prognosis are found to be significantly correlated with low viral load.
Keywords: COVID-19, Viral load, Asymptomatic, Severity, Saliva, Urine, Anal swab, Oral cavity
Introduction
On December 31, 2019, the World Health Organization (WHO) China Office reported pneumonia cases of unknown etiology in Wuhan, China, Hubei province. On January 7, 2020, the causative agent was identified as a new Coronavirus (2019-nCoV), which has not previously been detected in humans [1]. Later, the name of 2019-nCoV disease was accepted as COVID-19, and the virus was named as SARS-CoV-2 because of its close resemblance to SARS CoV. After this date, the number of patients increased rapidly, and on March 11, 2020, WHO declared COVID-19 as a global pandemic for the second time in the twenty-first century after the influenza pandemic caused by H1N1. In mid-June 2020, COVID-19 occurred in 215 countries in total, with nearly 8 million confirmed cases and 500.000 deaths.
COVID-19 is a challenging disease that appeared to be just an upper respiratory tract infection at first but showed its dark side later. Eventually, it was understood that it was a complicated disease which could cause systemic inflammation and even thrombosis. It is still not fully understood why some patients exhibit mild or no symptoms, while others suffer severe symptoms. This is because neither the amount of time SARS-CoV-2 RNA can survive in the upper respiratory tract nor the correlation of viral load and prognosis is well known. In addition to viral load, there are many parameters which affect the course of COVID-19 such as age, gender, comorbid diseases, and genetic factors. In the current literature, there are studies with limited sample size, which report different results regarding the PCR positivity rates of different tissues [2–6]. There are many unclear issues regarding the relationship between the course of the disease and virus dynamics in different age groups and patients with different comorbidities, different immune responses in different hosts, correlation between virus excretion amount and pathways, and clinical course of the disease.
The aim of this study is to evaluate the viral loads of six different sample types (nasopharyngeal/ oropharyngeal combined, oral cavity, saliva, rectal, urine, and blood) of patients with different ages and clinics, to reveal the relationship between disease course and SARS-CoV-2 viral load, and differences in viral loads of asymptomatic and symptomatic patients.
Materials and methods
Study design and patients
Patients who were hospitalized between May 1, 2020 and May 30, 2020 in Ankara City Hospital Infectious Diseases and Clinical Microbiology clinic with laboratory-confirmed diagnosis of COVID-19 were included in the study. Patients who had no follow-up for at least 1 month were excluded from the study.
Demographic features such as age, gender, place of residence, symptoms and onset time, comorbidities, physical examination, fever, and vital signs were recorded from the follow-up charts. Laboratory tests such as complete blood count, blood chemical analysis (including renal and liver function), coagulation parameters, acute phase reactants (ferritin, C-reactive protein (CRP), procalcitonin (PCT) obtained. Both X-ray and computed tomography (CT) of the chest were used for radiological assessment. For comparisons, patients are classified into three categories as mild disease, pneumonia, and severe acute respiratory illness (SARI) according to the WHO guideline for clinical management of COVID-19 (released on 27 May 2020) [7].
Sample collection
All samples in the study were collected by a single physician according to “Interim Guidelines for Collecting, Handling, and Testing Clinical Specimens for COVID-19” of CDC [8]. Nasopharyngeal and oropharyngeal combined (NP+OP) swabs were taken from the patients. Afterwards, oral cavity swab was taken by swabbing inside both cheeks, upper and lower gums, palate, top and underneath of the tongue. Finally, saliva, urine, blood, and anal swab samples were taken from the patients. Breast milk samples were also taken from nursing mothers. NP+OP swab, oral cavity, and rectal swab samples were transported to the laboratory using viral transport media; while saliva, urine, and breast milk samples were transported with sterile transport systems. Laboratory analysis for PCR and viral load were carried out at Public Health Institute of Turkey Virology Reference and Research Laboratory.
Urine samples were centrifuged at 3000 rpm for 5 min before separation of the supernatant; one-ml viral transport media (VTM) was added to the pellet, vortexed for homogenization, and transferred to 2-mL cryovial tubes. After 1-mL VTM addition, saliva samples were vortex-homogenized and transferred to cryovial tubes. Recorded samples were immediately transferred to extraction. NP+OP, oral cavity, and rectal swab containing VTMs were transferred to cryovial tubes before extraction process.
Molecular analysis
Nucleic acid extraction from the samples was performed with the RINA™M14-01 nucleic acid extraction device using the extraction kit RN-NA-14-111-100. PCRs were achieved with “Bio-Speedy® COVID-19 RT-qPCR Detection Kit (Cat No BS-SY-WCOR-305, Bioeksen R&D Ltd., Turkey)” and Bio-Rad CFX96 Touch™ (Bio-Rad Laboratories, Inc. USA). For the evaluation of results, replication curves of the FAM/HEX channels were observed. Human RNase P was used as an internal control to rule out false-negative results for each sample. Also, one positive patient’s sample with a known ct value was used as an internal quality positive control. LoD of Bio-Speedy® COVID-19 RT-qPCR Detection Kit is 20 copy/ml. Non-sigmoidal curves were recorded as negative. In the cases where positive, negative, and internal control values met the appropriate criteria, Ct < 40 was assumed positive. Note that patients were assumed positive either through positivity of at least two separate clinical samples or at least two positive results obtained from the same clinical sample according to WHO recommendations [9]. SARS-CoV-2 viral load analysis were performed with RdRp (RNA-dependent RNA polymerase) gene targeted Bio-Speedy® SARS-CoV-2 RT-qPCR Kit (BS-SY-WCOR-307) (Bioeksen, Turkey) and Bio-Rad CFX96 Touch™ (Bio-Rad, USA). Viral load of standards synthetic SARS-CoV-2 RdRp fragment/mL was between 2.5 × 10²–5 copy/ml.
Statistical analysis
Results were analyzed with SAS JMP® 11 statistical software package. Comparisons between groups for continuous variables were performed with Student’s t-test if they were distributed normally and with Kruskal–Wallis test if they were not distributed normally. Nominal variables were compared with Pearson χ2 and Fisher’s Exact test. Analysis of variance was used to determine significance of regression models. A p value below 0.05 was considered statistically significant.
Results
Demographics and baseline characteristics
A total of 360 samples from 60 patients (48% males, 52% females) were obtained on admission. Fifteen (25%) of the patients were asymptomatic while 45 (75%) were symptomatic. Mean age was 33.9 (3–64) years. Characteristics of the patients are given in Table 1. A significant difference was found between mean ages of asymptomatic vs symptomatic patients (26.4 and 36.4, respectively, p = 0.0248). Contact with a COVID-19 patient was identified in 39 (%65) patients. Inclusion of time from contact to admission is unfortunately not a reliable factor to assess due to the fact that almost all asymptomatic patients (identified through contact tracing) had multiple contacts with index patients (i.e., they live or work in the same place and, thus, have contact almost every day) and it is hard to tell which particular contact with the index case actually caused infection. Although 39 out of 60 patients had data related with “number of days since contact”, most had multiple contacts and therefore, it was not used since its inclusion could cause erroneous multivariate models.
Table 1.
Characteristics of the patients
| All patients | |
|---|---|
| Demographic characteristics | |
| Age, years (median, min–max) | 35, 3–64 |
| Sex, male (n, %) | 29, 48.3% |
| Preexisting conditions | |
| Any comorbidity | 8, 13.3% |
| Clinical features (among symptomatic patients n:45) n, % | |
| Time between onset of symptoms to admission (median, min–max) | 3 (1–14) days |
| Fever | 14, 31.1% |
| Cough | 31, 68.9% |
| Dyspnea | 12, 26.7 |
| Sore throat | 9, 20.0% |
| Laboratory findings (median, IQR) | |
| White blood cell count—× 109/L | 4970, 2660 |
| Neutrophil count—× 109/L | 2730, 1760 |
| Lymphocyte count—× 109/L | 1430, 1230 |
| Neutrophil to lymphocyte ratio | 2, 1.99 |
| Aspartate transaminase (AST), U/L | 24, 16 |
| Alanine transaminase (ALT), U/L | 31, 28 |
| C-reactive protein—mg/L | 0, 0.03 |
| Procalcitonin (PCT) μg/L | 0.03, 0.0125 |
| CT (n: 58) | |
| Normal | 10, 17.2% |
| Unilateral ground-glass opacity | 12, 20.7% |
| Bilateral ground-glass opacity | 20, 34.5% |
In symptomatic patients, median time from illness onset to admission was 3 (1–14) days. Asymptomatic patients were detected through contact tracing and were admitted to the hospital for observation. Contact tracing is performed by dedicated personnel according to Turkish Ministry of Health guidelines. Living in the same place as well as having worked at the same workplace with a COVID-19-positive patient within the last 2 weeks is categorized as contact. Other contacts are determined through detailed interviews with the patients. None of them presented symptoms after admission, all remained asymptomatic during the follow-up. Median time from reported contact to admission was 1 (1–7) day. Among the patients, 50 had mild disease, 8 patients had pneumonia, and 2 had SARI. At least one co-morbidity was present in 8 (13.3%) patients. Cough and fatigue were the most observed symptoms on admission, 51.7% and 30.5%, respectively. In average, symptoms that improved last were headache, myalgia/arthralgia, and dyspnea (4.9, 4.7, and 4.25 days, respectively). Median day for the first negative test after positive PCR was 6 (2–21). Among 58 patients who had chest CTs, CT was normal in 10 (17.2%) patients; bilateral ground-glass opacity and unilateral ground-glass opacity was observed in 34.5% and 20.7%, respectively. Seven of asymptomatic patients (46.7%) had abnormal chest CT (3 had bilateral ground-glass opacity and 4 had unilateral ground-glass opacity).
Correlation between SARS-CoV-2 viral load in different sample types and disease severity
Number of positive PCR results and viral load of the positive samples are given in Table 2. Note that not all PCR-positive samples have viral load data (21 out of 92 samples’ viral loads are missing). Cross comparisons of PCR positivity between different sample types are given in Table 3. Oral cavity, rectal, and urine PCRs of NP+OP PCR-negative patients were negative. However, 3 of 12 NP+OP PCR-negative patients’ saliva PCRs were found to be positive. NP+OP samples were observed to be the most sensitive (80%). No positive PCR result was found in blood. Among all patients, only 1 urine sample was positive for SARS-CoV-2 PCR. This patient was asymptomatic but had unilateral ground-glass opacity in chest CT. Although breast milk samples of 2 nursing mothers were tested negative for SARS-CoV-2 PCR, number of nursing mothers are too few to interpret any results. PCR positivity rates in different sample types were compared across symptomatic and asymptomatic patients. No significant difference in probability of PCR positivity across these patient groups were found (Table 4). Numbers and percentages of PCR positivity detected in symptomatic and asymptomatic patients are summarized in Table 4. NP+OP sample viral loads of asymptomatic patients were found to be significantly higher (p = 0.0141) when compared with symptomatic patients. However, a similar difference was not observed when other samples (i.e., oral cavity, saliva) were compared between symptomatic and asymptomatic patients (p = 0.2483, p = 0.8155). Comparisons of NP+OP and saliva samples’ viral loads between symptomatic and asymptomatic patients are shown in Figs. 1 and 2, respectively. PCR positivity and viral loads of several different sample types were compared across male and female patients and no significant differences were found.
Table 2.
PCR results and viral loads of the samples
| PCR | Viral Load (Log10, copy/ml) | ||||||
|---|---|---|---|---|---|---|---|
| Negative, n (%) | Positive, n (%) | n | Mean | Median | Min | Max | |
| NP+OP | 12 (20) | 48 (80) | 38 | 5.23 | 5.11 | 2.22 | 7.27 |
| Saliva | 30 (50) | 30 (50) | 27 | 5.18 | 5.25 | 2.87 | 7.47 |
| Oral cavity | 52 (86.7) | 8 (13.3) | 5 | 4.04 | 4.31 | 3.23 | 4.37 |
| Rectal | 55 (91.7) | 5 (8.3) | 1 | 3.88 | 3.88 | 3.88 | 3.88 |
| Urine | 59 (98.3) | 1 (1.7) | 0 | ||||
| Blood | 60 (100) | 0 (0) | 0 | ||||
Table 3.
Cross comparisons of PCR positivity between different sample types
| NP+OP | |||||||||
|---|---|---|---|---|---|---|---|---|---|
| NEG | POS | ||||||||
| Saliva | NEG | 9 | 21 | Saliva | |||||
| POS | 3 | 27 | NEG | POS | |||||
| Oral cavity | NEG | 12 | 40 | 29 | 23 | Oral cavity | |||
| POS | 0 | 8 | 1 | 7 | NEG | POS | |||
| Rectal | NEG | 12 | 43 | 30 | 25 | 49 | 6 | Rectal | |
| POS | 0 | 5 | 0 | 5 | 3 | 2 | NEG | POS | |
| Urine | NEG | 12 | 47 | 29 | 30 | 51 | 8 | 54 | 5 |
| POS | 0 | 1 | 1 | 0 | 1 | 0 | 1 | 0 | |
Table 4.
PCR results of symptomatic vs asymptomatic patients
| NP+OP PCR | Saliva PCR | |||
|---|---|---|---|---|
| Count Total % PCR Group % Row % |
NEG | POS | NEG | POS |
|
Symptomatic (n = 45) |
10 16.67 83.33 22.22 |
35 58.33 72.92 77.78 |
23 38.33 76.67 51.11 |
22 36.67 73.33 48.89 |
|
Asymptomatic (n = 15) |
2 3.33 16.67 13.33 |
13 21.67 27.08 86.67 |
7 11.67 23.33 46.67 |
8 13.33 26.67 53.33 |
|
Total (n = 60) |
12 20.00 |
48 80.00 |
30 50.00 |
30 50.00 |
|
P (Symptomatic vs asymptomatic) |
0.7119 | 1.0000 | ||
Fig. 1.
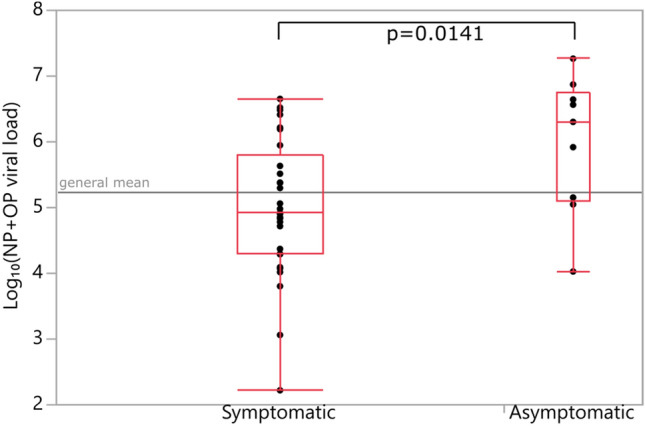
Viral loads of NP (Nasopharyngeal) + OP (Oropharyngeal) samples (Student’s t-test)
Fig. 2.
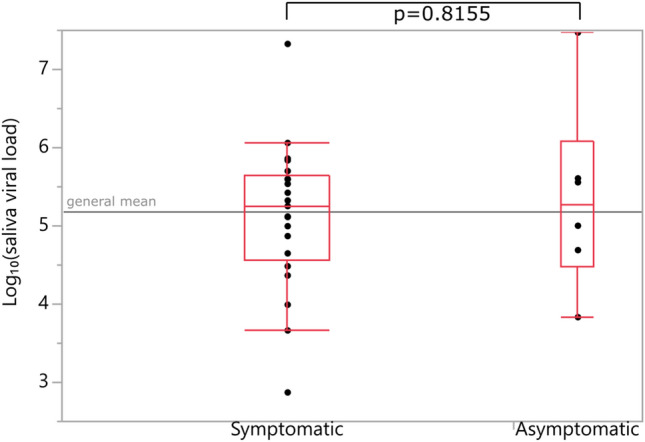
Viral loads of saliva samples (Student’s t-test)
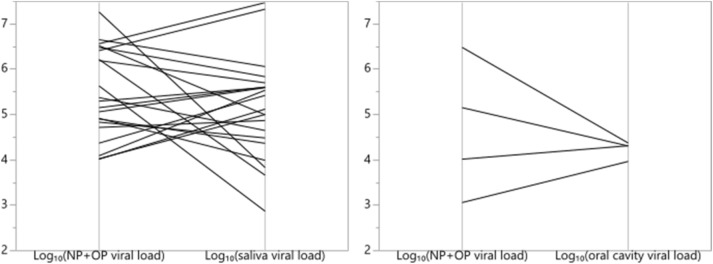
No significant difference was found between viral loads measured from different types of samples in neither matched pairs nor bivariate analysis. Parallel plots of NP+OP viral loads versus saliva and oral cavity viral loads are shown in Fig. 3.
Fig. 3.
NP (Nasopharyngeal) + OP (Oropharyngeal) viral loads versus saliva and oral cavity viral loads
When ages across PCR-positive and -negative patients were compared within each sample type separately, it was found that ages of PCR-positive patients were significantly lower within oral cavity, saliva, and rectal samples (p = 0.0113, p = 0.0190, p = 0.0270, respectively). Viral load had a significant negative trend with increasing age in NP+OP samples (Fig. 4). No significant trend relative to age was observed in other sample types.
Fig. 4.
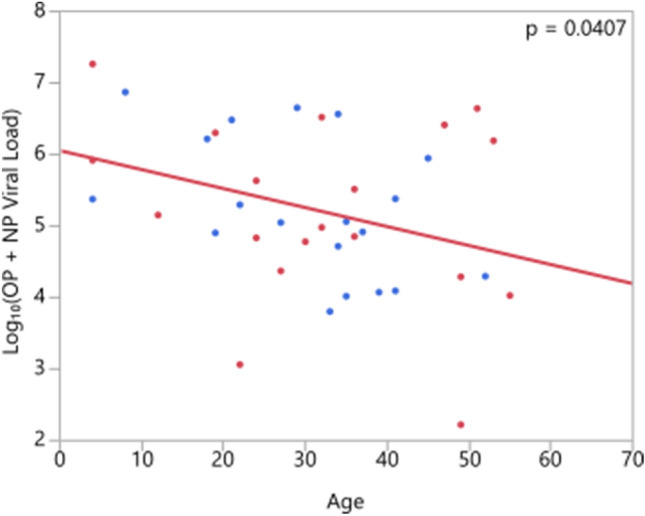
Correlation of viral load and age (NP:Nasopharyngeal, OP: Oropharyngeal; red: male, blue: female patients)
To investigate the relations between viral load, age, and existence of symptoms, multivariate analysis using REML method and a Least Squares regression on viral load with age and “being symptomatic” as factors were performed. Correlations between age and viral load as well as having symptoms and viral load were found to be significant (p < 0.05 for both). In regression analysis, a statistically significant model was obtained (p = 0.0217) with both factors having similar effects. Although some correlation between symptoms and age seem to exist, both factors influence viral load.
Viral loads significantly decreased with increased time from symptom onset to admission (Fig. 5).
Fig. 5.
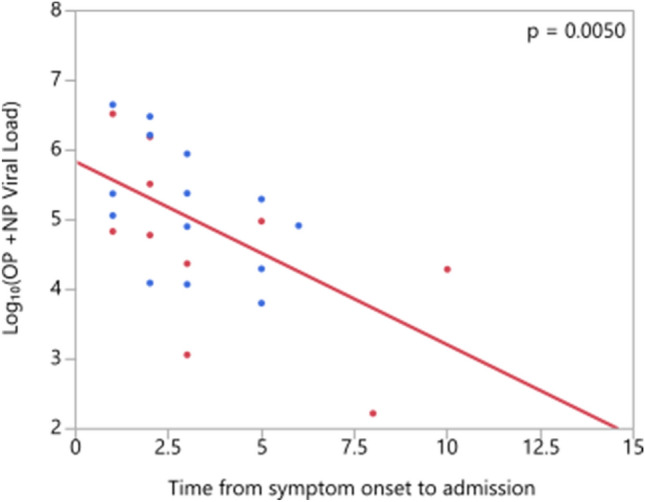
Correlation of viral load and time from symptom onset to admission (NP:Nasopharyngeal, OP: Oropharyngeal)
Viral loads of patients with at least one comorbidity (i.e., hypertension, diabetes, malignancy, chronic pulmonary disease) were found to be significantly lower than patients with no comorbidity (p = 0.0281). Furthermore, patients with at least one comorbidity were found to be significantly more probable to have a more severe disease (p = 0.0224).
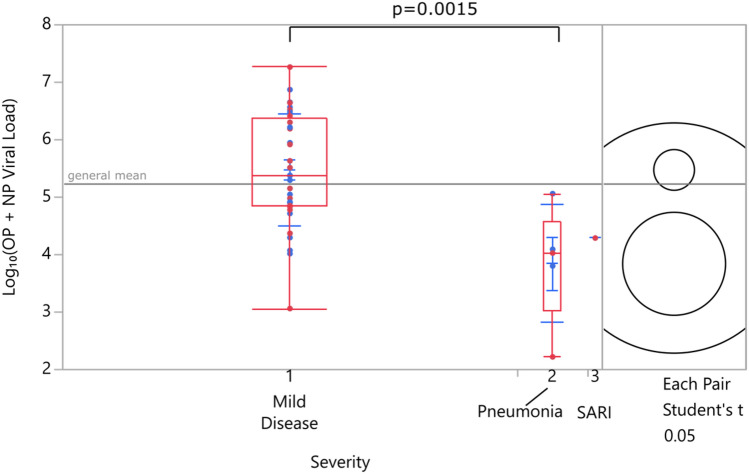
A significant decrease in viral load was observed with increasing disease severity when samples from patients with mild disease and pneumonia were compared. No comparisons were made for SARI and other severity groups since only 2 patients were in the SARI group (Fig. 6). Considering the possibility that low viral loads in more severe patients could be due to late admission, patients belonging to different severity groups were compared for differences in admission day from symptom onset and no significant difference was found (p = 0.805), hence eliminating the possibility.
Fig. 6.
Viral load vs disease severity (SARI: severe acute respiratory illness, NP:Nasopharyngeal, OP: Oropharyngeal)
Correlation of SARS-CoV-2 viral load with laboratory and radiologic findings
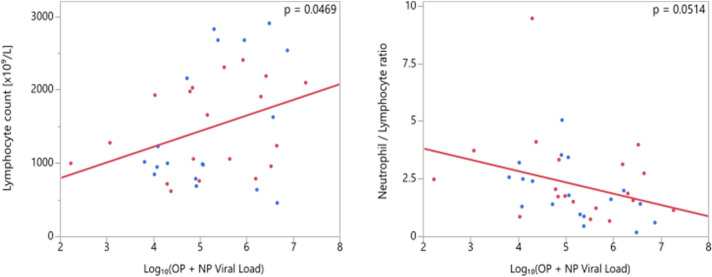
Laboratory findings (lymphocyte count, neutrophil/ lymphocyte ratio, platelet count, AST, ALT, C-reactive protein, creatine kinase) were compared across groups of different PCR positivity and evaluated for correlations with viral loads (for all types of samples). No significant difference was found between PCR-positive and -negative patients and no significant relation with viral load exists except for the positive correlation between lymphocyte count and NP+OP viral load which was found to be significant (p = 0.0469). An inverse correlation between neutrophil / lymphocyte ratio and viral load was found to be marginally insignificant (p = 0.0514) (Fig. 7).
Fig. 7.
Correlation of viral load and laboratory parameters (NP:Nasopharyngeal, OP: Oropharyngeal)
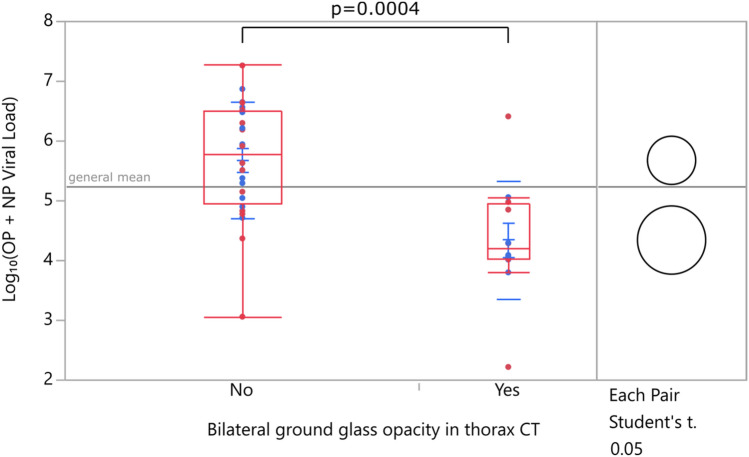
In patients with bilateral ground-glass opacity in chest CT, viral loads were significantly lower when compared with patients with unilateral ground-glass opacity or normal chest CT (Fig. 8).
Fig. 8.
Viral load versus chest CT findings (NP:Nasopharyngeal, OP: Oropharyngeal)
Discussion
The year 2020 brought a completely different endeavor to the entire medical world. While the doctors were dealing with a large number of COVID-19 patients on one hand, they tried to carry out studies to reveal the virus characteristics on the other. Although we have left half of the year behind and encountered millions of patients, many points of the SARS-CoV-2 virus have still not been elucidated. Virus dynamics in different hosts and different samples and their relationship with disease severity have not been clearly revealed.
In the current literature, although there are studies with a relatively good sample size, differing results are reported regarding the PCR positivity rates [2–6]. In this study, SARS-CoV-2 was detected in different samples from 60 COVID-19 patients. PCR positivity rates were 80%, 50%, 13.3%, 8.3%, and 1.7% for NP+OP, saliva, oral cavity, rectal, and urine samples, respectively. Wang et al. reported that PCR positivity rate for nasal swaps, pharyngeal swaps, and feces were 63%, 32%, and 29%, respectively [6]. Their study consisted of 1070 specimens from 205 patients with different severity and found 1% blood positivity and no urine sample positivity. We found no blood sample positivity, but 1 PCR-positive urine sample (1.7%) collected from an asymptomatic patient. In some studies, no PCR positivity in the urine samples was detected, despite the existence of viremia [4, 6, 10]. There are too many points that need to be clarified about the extrapulmonary replication of SARS-CoV-2 virus and time dependent changes of PCR positivity. Chen et al. reported that SARS-CoV-2 RNA was detected in the blood (6 out of 57 patients) and anal swabs (11 out of 28 patients) [11]. They concluded a quite different point from our study, that the presence of virus outside of the respiratory tract like blood and anal swab is related with severe disease. However, we found PCR positivity in anal and urine samples of asymptomatic patients. Zheng et al. reported that the PCR positivity rate in stool samples did not differ between patients with mild disease and patients with severe disease and they detected only one PCR positivity in a critically ill patient among 180 urine samples [12]. Note that, although there is some evidence that a higher viral load can be found in the stool of some patients, this does not provide substantial evidence for the use of anal swab samples as can also be seen in this study results where only 5 out of 60 patients’ samples were found positive.
Another issue regarding PCR positivity is its relationship with infectivity. PCR positivity does not always indicate infectivity. Studies demonstrated that despite positive PCR results, patients are less likely to be infectious after 1 week [13, 14]. Wölfel et al. reported that all viral cultures were negative after day 8 [13]. In addition to all this points, the infectivity may be affected by the presence of neutralizing SARS-CoV-2 antibodies.
Since the beginning of the pandemic, there are controversial views about the infectiousness of asymptomatic patients. It is reported that approximately 40–45% of patients infected with SARS-CoV-2 will remain asymptomatic [15]. Surprisingly in our study, viral loads of asymptomatic patients were found to be significantly higher (p = 0.0141). Zou et al. evaluated SARS-CoV-2 viral load in 18 COVID-19 patients’ upper respiratory specimens. They included only one asymptomatic patient and found that NP+OP sample’s viral load of asymptomatic patient was similar to that in the symptomatic patients [16]. The period of the disease when samples for the PCR test were collected is important both in terms of PCR positivity and viral load. This correlation makes it difficult to compare the results of the studies. In a study including 31 adult patients who were virologically confirmed COVID-19 but were asymptomatic on admission, it is reported that the cycle threshold values of asymptomatic patients were significantly higher than those of asymptomatic patients who developed symptoms after admission to hospital while having similar duration of viral shedding [17]. In our study, all PCR and viral load analysis were performed on admission to hospital for all patients.
In a study from China, He et al. evaluated temporal patterns of viral shedding in 94 laboratory-confirmed COVID-19 patients and reported that infectivity started from 2.3 days before symptom onset, peaked at 0.7 days before symptom onset, and declined quickly within 7 days [14]. Therefore, patients actually begin to be infectious before the symptom onset and isolation. Probably, this is one of the important points that makes the control of the epidemic difficult. Asymptomatic patients maybe another important point. Although asymptomatic patients are intuitively thought to be less infectious due to producing less aerosols since they do not cough as much as symptomatic patients, their high levels of viral load may indicate a higher than expected infectiousness. It must also be kept in mind that asymptomatic patients are rarely detected and isolated. Therefore, their exact role in the pandemic might be more important than initially thought.
There are a limited number of studies in the literature evaluating the relationship between viral load and disease severity. Shi et al. found that pneumonia cases had the lowest viral loads, followed by non-pneumonia cases, and severe pneumonia cases having the highest with no statistically significant differences [18]. Zheng et al. reported that viral load of respiratory samples was significantly higher in severe patients than patients with mild disease [12]. But the respiratory samples in their study were sputum and saliva. They found that in the mild disease group, viral load was higher during the early phase, peaked at the second week from disease onset, and declined afterwards. However, they also found that the viral load remained high in the severe disease group. We found a significant decrease in viral load with increased disease severity. To interpret the studies correctly, it is absolutely necessary to consider when the samples are taken. In our study, patients were in relatively early phase of the disease since the median time from illness onset to admission was 3 (1–14) days. The reason for low viral load in severe patients can be interpreted as late admission to hospital. However, it is not the case in our study, since no significant difference was found in admission day from symptom onset of patients belonging to different severity groups (p = 0.805). To et al. reported no difference between median viral loads of severe and mild cases [19]. As seen in these examples, there are studies that find the viral load in severe patients lower, higher, or equal (i.e., no significant difference) compared to the mild patients.
In our country, mean age of COVID-19 cases is 42 years [20]. Mean age of patients in our study was 33.9 years. According to the published data, younger patients are more likely to be asymptomatic than older patients [21]. Studies demonstrated that older age and male gender is associated with severe disease [22–24]. But little is known about correlation of viral load with age and gender. We found that gender is not a factor affecting PCR positivity and viral load. But the viral load had a significant negative trend with increasing age. Zheng et al. reported that duration of viral shedding was significantly longer in men than in women and increased with older age [12]. To et al. found similar results with Zheng et al. and concluded that older age is associated with higher viral load [19].
The strengths of our study were evaluating 6 different sample types (OP+NP, oral cavity, saliva, rectal, urine, and blood) of patients with different ages and clinics, revealing the relationship between disease course and SARS-COv-2 viral load, and differences in viral loads of asymptomatic and symptomatic patients. Our study has some limitations. First, we performed the PCR and viral load tests only on admission. Serial sampling would be much better to see the dynamics of viral loads in different tissues and viral shedding patterns. Second, we did not evaluate lower respiratory samples. Third, not all PCR-positive samples have undergone viral load analysis. Finally, higher number of patients would have strengthened the study.
In conclusion, this study demonstrates that asymptomatic patients have higher SARS-CoV-2 viral loads than symptomatic patients and unlike in the few study in the literature, a significant decrease in viral load was observed with increasing disease severity. Factors associated with poor prognosis like low lymphocyte count, bilateral ground-glass opacity in chest CT, and older age are found to be significantly correlated with low SARS-CoV-2 viral load. COVID-19 is a complicated puzzle with pieces of many colors and shapes. Further virologic and immunological studies are urgently needed to put all the pieces together and see the big picture.
Acknowledgment
We are grateful to all patients who accepted to be part of this study to make it possible.
Author contributions
İH carried out study design, data collection, data analysis, and drafted the manuscript. DA carried out sample collection and data analysis. RG, AKK, BK, and FE participated the study design and statistical analysis. GA, YC, ABA, and EAK performed laboratory tests. All authors read and approved the final version of the manuscript.
Funding
None.
Compliance with ethical standards
Conflict of interest
Authors declare no conflict of interest.
Ethics approval
The study was approved by the Turkish Ministry of Health and ethics board of Ankara City Hospital (No: E1-20-548).
Contributor Information
Imran Hasanoglu, Email: imran.solak@gmail.com.
Gulay Korukluoglu, Email: gucank@gmail.com.
Dilek Asilturk, Email: nymph.ecrin@gmail.com.
Yasemin Cosgun, Email: yasemincosgun2006@yahoo.com.tr.
Ayse Kaya Kalem, Email: dr.aysekaya09@hotmail.com.
Ayşe Basak Altas, Email: aysebasakdemir@gmail.com.
Bircan Kayaaslan, Email: drbican@gmail.com.
Fatma Eser, Email: fatmaceser@gmail.com.
Esra Akkan Kuzucu, Email: esra.akkan@yahoo.com.tr.
Rahmet Guner, Email: rahmetguner@yahoo.com.
References
- 1.Zhu N, Zhang D, Wang W, Li X, Yang B, Song J, et al. A novel coronavirus from patients with pneumonia in China, 2019. N Engl J Med. 2020;382:727–733. doi: 10.1056/NEJMoa2001017. [DOI] [PMC free article] [PubMed] [Google Scholar]
- 2.Peng L, Liu J, Xu W, Luo Q, Chen D, Lei Z, et al. SARS-CoV-2 can be detected in urine, blood, anal swabs, and oropharyngeal swabs specimens. J Med Virol. 2020 doi: 10.1002/jmv.25936. [DOI] [PMC free article] [PubMed] [Google Scholar]
- 3.Chen JH-K, Yip CC-Y, Poon RW-S, Chan K-H, Cheng VC-C, Hung IF-N, et al. Evaluating the use of posterior oropharyngeal saliva in a point-of-care assay for the detection of SARS-CoV-2. Emerg Microbes Infect. 2020;9:1–14. doi: 10.1080/22221751.2019.1699450. [DOI] [PMC free article] [PubMed] [Google Scholar]
- 4.Yu F, Yan L, Wang N, Yang S, Wang L, Tang Y, et al. Quantitative detection and viral load analysis of SARS-CoV-2 in infected patients. Clin Infect Dis. 2020;71:793–798. doi: 10.1093/cid/ciaa345. [DOI] [PMC free article] [PubMed] [Google Scholar]
- 5.Pan Y, Zhang D, Yang P, Poon LLM, Wang Q. Viral load of SARS-CoV-2 in clinical samples. Lancet Infect Dis. 2020;20:411–412. doi: 10.1016/S1473-3099(20)30113-4. [DOI] [PMC free article] [PubMed] [Google Scholar]
- 6.Wang W, Xu Y, Gao R, Lu R, Han K, Wu G, et al. Detection of SARS-CoV-2 in different types of clinical specimens. JAMA. 2020;323:1843–1844. doi: 10.1001/jama.2020.3786. [DOI] [PMC free article] [PubMed] [Google Scholar]
- 7.Clinical management of COVID-19 [Internet]. https://www.who.int/publications-detail-redirect/clinical-management-of-covid-19. Accessed 12 Sept 2020.
- 8.CDC. Information for Laboratories about Coronavirus (COVID-19) [Internet]. Centers for Disease Control and Prevention. 2020. https://www.cdc.gov/coronavirus/2019-ncov/lab/guidelines-clinical-specimens.html. Accessed 10 Sept 2020.
- 9.WHO. Use of laboratory methods for SARS diagnosis [Internet]. WHO. World Health Organization; https://www.who.int/csr/sars/labmethods/en/. Accessed 9 Sept 2020.
- 10.Lui G, Ling L, Lai CK, Tso EY, Fung KS, Chan V, et al. Viral dynamics of SARS-CoV-2 across a spectrum of disease severity in COVID-19. J Infect. 2020;81:318–356. doi: 10.1016/j.jinf.2020.04.014. [DOI] [PMC free article] [PubMed] [Google Scholar]
- 11.Chen W, Lan Y, Yuan X, Deng X, Li Y, Cai X, et al. Detectable 2019-nCoV viral RNA in blood is a strong indicator for the further clinical severity. Emerg Microbes Infect. 2020;9:469–473. doi: 10.1080/22221751.2020.1732837. [DOI] [PMC free article] [PubMed] [Google Scholar]
- 12.Zheng S, Fan J, Yu F, Feng B, Lou B, Zou Q, et al. Viral load dynamics and disease severity in patients infected with SARS-CoV-2 in Zhejiang province, China, January–March 2020: retrospective cohort study. BMJ. 2020;369:m1443. doi: 10.1136/bmj.m1443. [DOI] [PMC free article] [PubMed] [Google Scholar]
- 13.Wölfel R, Corman VM, Guggemos W, Seilmaier M, Zange S, Müller MA, et al. Virological assessment of hospitalized patients with COVID-2019. Nature. 2020;581:465–469. doi: 10.1038/s41586-020-2196-x. [DOI] [PubMed] [Google Scholar]
- 14.He X, Lau EHY, Wu P, Deng X, Wang J, Hao X, et al. Temporal dynamics in viral shedding and transmissibility of COVID-19. Nat Med. 2020;26:672–675. doi: 10.1038/s41591-020-0869-5. [DOI] [PubMed] [Google Scholar]
- 15.Oran DP, Topol EJ. Prevalence of asymptomatic SARS-CoV-2 infection: a narrative review. Ann Intern Med. 2020 doi: 10.7326/M20-3012. [DOI] [PMC free article] [PubMed] [Google Scholar]
- 16.Zou L, Ruan F, Huang M, Liang L, Huang H, Hong Z, et al. SARS-CoV-2 viral load in upper respiratory specimens of infected patients. N Engl J Med. 2020;382:1177–1179. doi: 10.1056/NEJMc2001737. [DOI] [PMC free article] [PubMed] [Google Scholar]
- 17.Zhou R, Li F, Chen F, Liu H, Zheng J, Lei C, et al. Viral dynamics in asymptomatic patients with COVID-19. Int J Infect Dis. 2020;96:288–290. doi: 10.1016/j.ijid.2020.05.030. [DOI] [PMC free article] [PubMed] [Google Scholar]
- 18.Shi F, Wu T, Zhu X, Ge Y, Zeng X, Chi Y, et al. Association of viral load with serum biomakers among COVID-19 cases. Virology. 2020;546:122–126. doi: 10.1016/j.virol.2020.04.011. [DOI] [PMC free article] [PubMed] [Google Scholar]
- 19.To KKW, Tsang OTY, Leung W-S, Tam AR, Wu T-C, Lung DC, et al. Temporal profiles of viral load in posterior oropharyngeal saliva samples and serum antibody responses during infection by SARS-CoV-2: an observational cohort study. Lancet Infect Dis. 2020;20:565–574. doi: 10.1016/S1473-3099(20)30196-1. [DOI] [PMC free article] [PubMed] [Google Scholar]
- 20.COVID-19 Durum Raporu [Internet]. https://covid19.saglik.gov.tr/TR-68443/covid-19-durum-raporu.html. Accessed 12 Sept 2020.
- 21.Li Y, Shi J, Xia J, Duan J, Chen L, Yu X, et al. Asymptomatic and symptomatic patients with non-severe coronavirus disease (covid-19) have similar clinical features and virological courses: a retrospective single center study. Front Microbiol. 2020;11:1570. doi: 10.3389/fmicb.2020.01570. [DOI] [PMC free article] [PubMed] [Google Scholar]
- 22.Qian J, Zhao L, Ye R-Z, Li X-J, Liu Y-L. Age-dependent gender differences of COVID-19 in mainland China: comparative study. Clin Infect Dis. 2020 doi: 10.1093/cid/ciaa683. [DOI] [PMC free article] [PubMed] [Google Scholar]
- 23.Qin L, Li X, Shi J, Yu M, Wang K, Tao Y, et al. Gendered effects on inflammation reaction and outcome of COVID-19 patients in Wuhan. J Med Virol. 2020 doi: 10.1002/jmv.26137. [DOI] [PMC free article] [PubMed] [Google Scholar]
- 24.Galloway JB, Norton S, Barker RD, Brookes A, Carey I, Clarke BD, et al. A clinical risk score to identify patients with COVID-19 at high risk of critical care admission or death: an observational cohort study. J Infect. 2020;81:282–288. doi: 10.1016/j.jinf.2020.05.064. [DOI] [PMC free article] [PubMed] [Google Scholar]


