Figure 2.

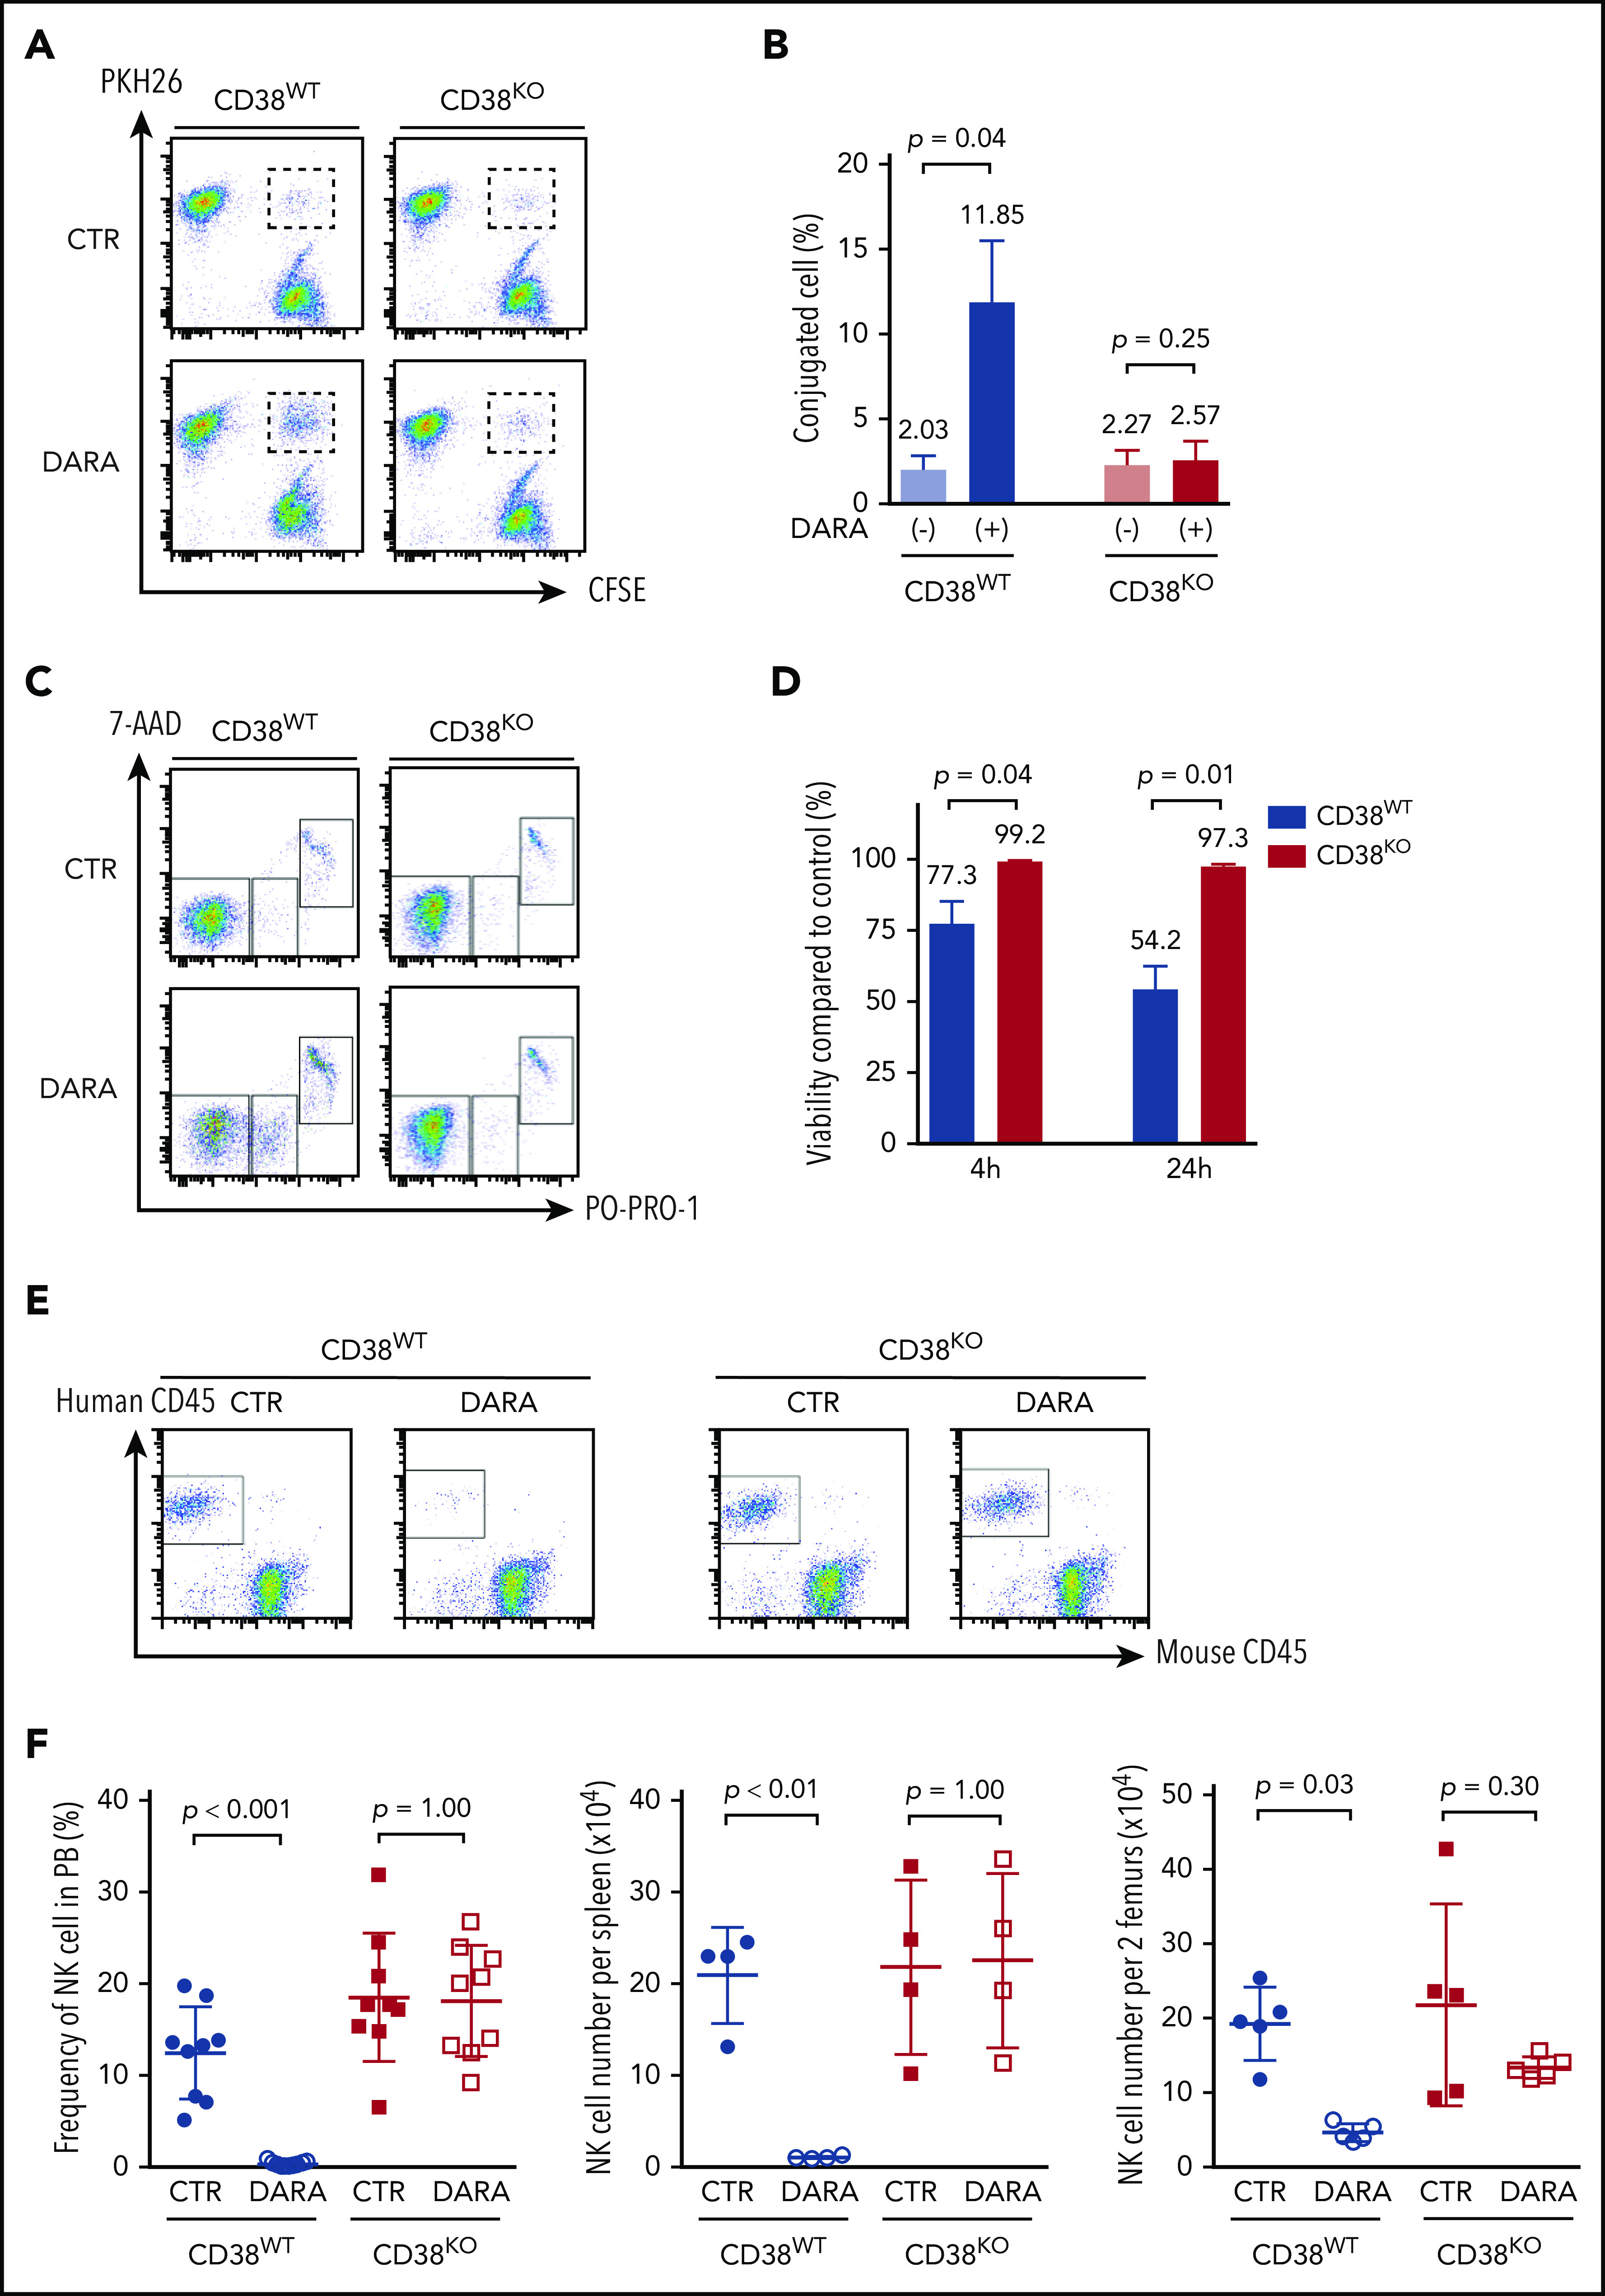
Resistance of CD38KO NK cells to DARA-induced fratricide. (A) Representative FACS analyses of the conjugation assay. (B) Summarized data of conjugation assays are shown (n = 3; mean ± SD). (C) Representative FACS analyses of the fratricide assay. (D) Viability of CD38WT and CD38KO NK cells treated with DARA compared with that of control (CTR) samples (n = 3; mean ± SD). (E) Representative FACS analyses of PB of NSG mice 7 days after treatment with DARA or saline. (F) Summarized data of NK cell persistence in NSG mice during treatment. The frequency of human NK cells in PB at day 7 and their absolute number in spleen and BM at day 9 are shown (n = 5; mean ± SD).
