Coronary arteries are covered by a layer of endothelial cells (ECs) that have a thickness of approximately 1 μm. Impairment of ECs is at the origin of coronary atherosclerosis and its clinical manifestations. The current gold standard, scanning electron microscopy (SEM), has demonstrated that ECs form an endoluminal feature referred to as ‘endothelial pavementing’.1 However, the assessment of ECs in humans remains elusive because a clinical imaging modality with sufficient resolution does not exist. This study investigates the utilization of new form of optical coherence tomography (OCT), termed μOCT,2 that offers an axial resolution of 1-μm and a lateral resolution of 2-μm, for evaluating EC morphology.
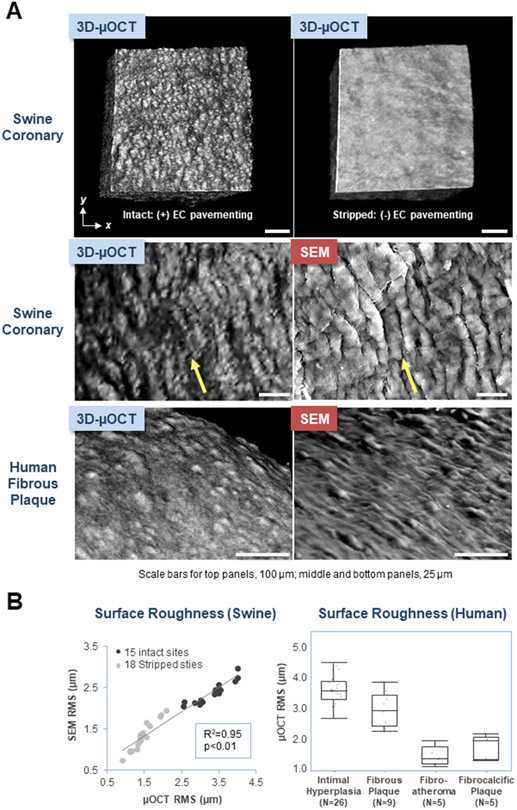
First, we stripped the endothelium from fresh swine coronary segments with cyanoacrylate adhesive. Coronary segments were imaged in three-dimensions (3D) with μOCT. μOCT images were then 3D-volume rendered using ImageJ.3 3D-μOCT allowed clear visualization of endothelial pavementing (Figure A, left top and middle panels) with cells oriented parallel to the coronary flow direction (Figure A, left top and middle panels), not seen at the sites where ECs were stripped off (Figure A, top right panel). The surface roughness, measured as root mean squared (RMS), diminished significantly at sites of EC stripping compared with intact sites (3.4±0.1 vs. 1.5±0.1 μm, p<0.01). Subsequently, swine coronary segments were processed for SEM, and were co-registered to the same area imaged by μOCT. The morphology of ECs visualized by 3D-μOCT was similar to that seen by SEM (Figure A, middle panels). 3D-SEM data was computed from 2D-SEM images using intensity thresholding and Mountains-Map software (Digital Surf, Besancon, France). In both intact and stripped sites, very strong positive correlations were noted between the RMS calculated for μOCT vs. SEM (R2=0.95, p<0.01; R2=0.97, p<0.01) (Figure B, left top and bottom panels). We also utilized μOCT to explore EC morphology in human cadaver coronary plaques. Conventional OCT cross-sections were obtained prior to μOCT to characterize human coronary lesion tissue type. After standard OCT pullback, 1-cm long coronary segments (n=45) from 8 fresh cadaver hearts were opened and imaged in 3D with μOCT and co-registered SEM. As per the corresponding standard OCT images, the tissue type of each coronary segment was classified as either intimal hyperplasia, fibrous plaque, lipid-rich/fibroatheroma or fibrocalcific plaque. Figure A, bottom panels show typical endothelial morphology of a fibrous plaque seen by 3D-μOCT and co-registered SEM. μOCT RMS was significantly lower over fibroatheroma and fibrocalcific plaques compared with intimal hyperplasia and fibrous segments (p<0.01; Figure B, right).
Figure. 3D-μOCT and SEM Images of Coronary Endothelial Cell Morphology.
(A) 3D-μOCT of an intact swine coronary artery showing endothelial pavementing (top left panel). In contrast, a comparatively smooth surface is seen at the site of endothelial stripping (top right panel). Endothelial pavementing of a swine coronary segment and human fibrous plaque visualized by 3D-μOCT is similar to that seen by SEM (middle and bottom panels). Blood flow direction in the images of the swine coronary is depicted using yellow arrows (middle panels), demonstrating an alignment of endothelial cells with flow. Scale bars, 100 μm (upper panels); 25 μm (middle and bottom panels).
(B) Scatter plot showing significant correlations between 3D-μOCT and SEM RMS measurements in both intact and stripped sites (left). Box plot of μOCT RMS for different OCT-delineated coronary lesions (right). Statistical differences were examined using Wilcoxon signed rank test. Intimal hyperplasia RMS (3.6±0.1 μm) was higher than that of fibrous plaque (3.0±0.2 μm) (p<0.01) and both intimal hyperplasia and fibrous plaque RMS were higher than those of fibrocalcific plaque (1.8±0.2 μm) and fibroatheroma (1.5±0.1 μm) (p<0.01).
The major findings of the present study were that 1) 3D-μOCT was capable of clearly visualizing EC morphology that manifested endothelial pavementing in intact swine coronary arteries, confirmed by surface morphology seen by SEM, 2) 3D-μOCT imaging was able to identify and quantify EC morphology overlying various human cadaver coronary lesions. These results suggest that μOCT could be useful for improving our understanding the role of ECs in the pathogenesis of the diverse manifestations of coronary artery disease.
Importantly, μOCT is a non-contact, 3D imaging technology that can ultimately be implemented in catheters to study ECs in living patients.4 3D-μOCT visualization of ECs may allow a more precise capability to predict plaque progression. Although the extent to which μOCT can visualize ECs beneath thrombus remains an open question, μOCT could also be helpful for making a more precise diagnosis of coronary ‘endothelial’ erosion that has emerged as the second most prevalent histopathological finding in acute coronary syndrome. The use of μOCT technology to assess coronary stent strut endothelial coverage may also help resolve current questions and controversies regarding stent healing and optimal antiplatelet therapy durations.
References
- 1.Pasternak RC, Baughman KL, Fallon JT, et al. Scanning electron microscopy after transluminal angioplasty of normal canine coronary arteries. Am J Cardiol 1980;45:591–8. [DOI] [PubMed] [Google Scholar]
- 2.Liu L, Gardecki JA, Nadkarni SK, et al. Imaging the subcellular structure of human coronary atherosclerosis using micro-optical coherence tomography. Nat Med 2011;17:1010–4. [DOI] [PMC free article] [PubMed] [Google Scholar]
- 3.Schneider CA, Rasband WS, Eliceiri KW. NIH Image to ImageJ: 25 years of image analysis. Nat Methods 2012;9:671–5. [DOI] [PMC free article] [PubMed] [Google Scholar]
- 4.Yin B, Hyun C, Gardecki JA, et al. Extended depth of focus for coherence-based cellular imaging. Optica 2017;4:959–65. [DOI] [PMC free article] [PubMed] [Google Scholar]


