

Abstract
Huntington disease (HD) is a fatal autosomal dominant neurocognitive disorder that causes cognitive disturbances, neuropsychiatric symptoms, and impaired motor abilities (e.g., gait, speech, voice). Due to its progressive nature, HD treatment requires ongoing clinical monitoring of symptoms. Individuals with the Huntingtin gene mutation, which causes HD, may exhibit a range of speech symptoms as they progress from premanifest to manifest HD. Speech-based passive monitoring has the potential to augment clinical information by more continuously tracking manifestation symptoms. Differentiating between premanifest and manifest HD is an important yet under-studied problem, as this distinction marks the need for increased treatment. In this work we present the first demonstration of how changes in speech can be measured to differentiate between premanifest and manifest HD. To do so, we focus on one speech symptom of HD: distorted vowels. We introduce a set of Filtered Vowel Distortion Measures (FVDM) which we extract from read speech. We show that FVDM, coupled with features from existing literature, can differentiate between premanifest and manifest HD with 80% accuracy.
Index Terms: Huntington disease, disordered speech, speech feature extraction, vowel distortion
1. Introduction
Huntington disease (HD) is a fatal autosomal dominant neurocognitive disorder that causes cognitive disturbances, neuropsychiatric symptoms, and impaired motor abilities (e.g., gait, speech, voice) [1–4]. Individuals who have a family history of HD can undergo a gene test to learn if they carry the gene mutation that causes HD (i.e., are gene-positive). Individuals who are gene-positive will develop clinically significant symptoms of HD, resulting in an HD diagnosis, typically in their mid-40’s [5]. These individuals are considered premanifest before the onset of these symptoms, and manifest after. No cure exists, but timely diagnosis of HD (i.e., manifestation) coupled with treatment allows individuals to manage their symptoms.
At-home passive symptom monitoring captures patient health as it relates to real-world functioning [6]. Providing clinicians with this information can allow for a more timely diagnosis of HD and a better understanding of its progression for treatment planning. Disordered speech is one symptom of HD, and previous work has demonstrated changes in speech occur before an HD diagnosis, and become more noticeable as HD progresses. [7–10]. This suggests the potential of passively tracking speech symptoms to better understand HD progression.
Vowel distortion is one speech symptom of HD [11–13], and tracking this symptom may augment passive monitoring. However, methods of automatically quantifying vowel distortion from speech have not been extensively explored. Kaploun et al. extracted jitter and shimmer from a sustained vowel task to characterize vowel distortion, and they demonstrated its prevalence as an HD symptom [7]. Works differentiating between healthy and disordered speech (a range of conditions in the Kay Elemetrics Disordered Voice Dataset [14]) have extracted measures of system stability from sustained vowel tasks, suggesting the potential of stability measures for capturing vowel distortion [14–17]. However, there is no guarantee that measures extracted from sustained vowel tasks can be applied to connected speech. Vowels in connected speech differ because they are 1) modified and often nonstationary due to coarticulation and 2) shorter, which may pose problems for distortion measures that rely on lengthy signals. Thus, to incorporate tracking of vowel distortion into passive speech monitoring, we must assess how these measures relate to HD when extracted from connected speech. In this work we analyze read speech, which is one type of connected speech and includes short vowel samples that are modified due to coarticulation.
The novelty of this work is a new set of Filtered Vowel Distortion Measures (FVDM), which account for the nonstationarities in connected speech and reliably measures vowel distortion as it relates to HD. Supplementing features identified in previous work with FVDM, we present the first system to classify premanifest versus manifest HD, doing so with 80% accuracy.
2. Related work
2.1. HD classification using speech
Previous works have demonstrated the potential of passively monitoring speech to assist in managing neurocognitive disorders such as Parkinson’s [18, 19] and Alzheimer’s [20–22]. Individuals with HD exhibit similar speech symptoms, suggesting the potential of monitoring speech to aid in managing HD.
Prior works in automatically classifying HD stages have not studied how to differentiate between premanifest and manifest HD, but they have differentiated between healthy controls and individuals who are gene-positive. Kaploun et al. used speaking rate from a reading passage and jitter and shimmer of a sustained vowel to classify individuals as healthy controls or premanifest, illustrating the subtle speech symptoms that may occur even in the premanifest population [7]. Perez et al. used speaking rate, pause information, and goodness of pronunciation features to classify individuals as healthy controls or gene-positive [10]. In doing so, they demonstrated the difficulty of differentiating between the premanifest and manifest subcategories: half of premanifest individuals were classified as healthy controls, and the other half as gene-positive. To the best of our knowledge, no work has focused on extracting speech features to classify premanifest versus manifest HD.
2.2. Vowel distortion
Vowel distortion is a prevalent symptom of HD [11–13]. Prior works have quantified vowel distortion from sustained vowels using a variety of perturbation measures, and used these measures to classify a range of disorders. As mentioned above, Kaploun et al. used jitter and shimmer from a sustained vowel task to differentiate between healthy controls and individuals with premanifest HD [7]. Vaziri et al. extracted the correlation dimension (CD) and the Maximal Lyapunov Exponent (MLE) from sustained vowels, and used these measures to classify voice disorders in the Kay Dataset [17]. Little et al. extracted recurrence period density entropy (RPDE) and detrended fluctuation analysis (DFA) from sustained vowels to more accurately classify voice disorders in the Kay Dataset [15]. An open question is if these measures can provide insight into manifest HD.
Furthermore, these previous works have only examined measuring vowel distortion in sustained vowel tasks, potentially limiting their applicability to connected speech. These tasks allow for the analysis of vowel distortion without needing to account for changes due to coarticulation, which is the influence of surrounding phones on the vowel of interest. Coarticulation may lead to changes in the vowel, including nonstationarities (i.e., changing mean and variance) [15, 23], which limit the applicability of some existing vowel distortion measures. These controlled tasks also allow for analysis on longer signals, and the applicability of some measures may be further limited if they do not scale to the short vowels within connected speech.
3. Data description
In this paper we use data collected as part of a study on acoustic biomarkers for HD at the University of Michigan. The participants in this study provided speech samples that were recorded at 44.1kHz with a Hosa XVM-102M XLR microphone. We use two tasks: the sustained vowel, in which participants were instructed to hold the vowel /a/ for as long as possible, and the Grandfather Passage (GFP). The GFP contains nearly all of the phonemes of American English and is a standard reading passage used in assessing motor speech and voice disorders [24].
The data contains speech from 62 individuals, in which 31 are healthy controls and 31 are gene-positive. Gene-positive individuals are assigned to specific HD stages (premanifest, manifest early-stage, and manifest late-stage) using the Unified Huntington’s Disease Rating Scale (UHDRS) [25]. First, the premanifest versus manifest labels are determined based on the clinician-determined Diagnostic Confidence Level (DCL) within the Total Motor Score (TMS) portion of UHDRS. DCL ranges from 0 (no symptoms) to 4 (symptoms of HD with >99% confidence). We label participants with a DCL of less than 4 as premanifest, and participants with a DCL of 4 as manifest. Within the manifest group, we label participants as early-or late-stage based on their Total Functional Capacity (TFC) scores [26]. TFC scores provide a clinician-rating of functional capacity, and range from 0 (low functioning) to 13 (high functioning). We label participants with a TFC score of 7–13 early-stage and those with a TFC score of 0–6 as late-stage [10,27].
This paper focuses on analyzing speech of gene-positive individuals. Of these participants, one was unable to hold the sustained vowel. To provide a consistent comparison across experiments, we exclude this participant from our analysis. Thus in this paper we use data collected from 30 individuals: 12 premanifest, 11 with early-stage HD, and 7 with late-stage HD. We focus on differentiating between premanifest and manifest.
4. Methods
4.1. Data segmentation
We segment three vowel sample types: sustained vowels, shortened sustained vowels, and vowels extracted from the GFP. Table 1 summarizes these samples.
Table 1:
Three types of vowel samples
| Sample type | Description |
|---|---|
| SV | 2 seconds of holding the vowel /a/ |
| SSV | 10 randomly selected segments from the SV, each 140ms |
| GFPV | The phones [ɑ], [ə], and [ɔ] manually segmented from the Grandfather Passage reading |
We first analyze the sustained vowel recordings. In this task participants were instructed to hold the vowel /a/ for as long as possible and the interviewer provided an example. Recordings varied in length (12.8s ± 8.5s), as some participants could hold the vowel for longer than others. To enable a consistent comparison, we segment two seconds of the vowel for each participant, as in [16]. We drop the initial second of the sample, as during this time participants were settling in to a stable vibration. A similar assumption was made in [15]. We then choose to use the beginning two seconds of the remaining sample. Thus, for each participant, we extract the sustained vowel (SV) sample from seconds 1–3 of their sustained vowel recording.
To analyze vowel distortion within read speech, we manually segment the vowels from GFP recordings. We focus on phones that closely resembled the sounds in SV, as this would limit potential variation due to sound. More specifically, we extract the phones [ɑ] (as in the the second /a/ in “grandfather”), [ə] (as in the final /a/ in “banana”), and [ɔ] (as in “small”). We listen to each GFP recording to identify occurrences of these phones, and then identify their endpoints by assessing changes in the sound and associated spectrogram. We verify that the sound of the resulting sample minimally contained surrounding phones. The number and length of samples vary by each participant, as there were variations in pronunciation and noise, making some occurrences of the phones difficult to segment. Ultimately, we extract 11.6 ±1.7 vowel samples for each participant, and these are 140ms ± 94ms in length. We refer to these samples as GFP vowels (GFPV).
To understand the impact of vowel length versus vowel changes within read speech, we sample an intermediate set of vowels from SV, but of a length representative of GFPV. We sample shortened sustained vowels (SSV) by choosing 10 segments of 140ms (the average length of GFPV) from each SV.
4.2. Feature extraction
Baseline features.
We first develop a set of baseline features for the task of classifying premanifest versus manifest HD. In prior work, Perez et al. extracted 252 features (81 relating to speaking rate, 100 relating to pause information, and 71 relating to goodness of pronunciation) from the GFP (for details, see [10]). They demonstrated that these features could differentiate between healthy individuals and gene-positive individuals with 87% accuracy, but did not focus on separating the premanifest and manifest populations.
Vowel distortion measures overview.
In the previous works highlighted in Section 2.2, researchers extracted a range of vowel distortion measures from sustained phonation: jitter and shimmer, CD, MLE, RPDE, and DFA. In our preliminary analysis, when extracted from GFPV, DFA was notably more correlated with HD manifestation than other measures. Thus, we limit our discussion of existing measures here to DFA.
In the remainder of this section we introduce the Hurst exponent (HE) and describe two types of vowel distortion measures derived from this: DFA and our proposed FVDM1. We extract DFA from SV, SSV, and GFPV. FVDM are designed for short segments of vowels, so we extract FVDM from SSV and GFPV. For each participant we aggregate the values of all individual vowels within SSV and GFPV with six statistics: minimum, median, maximum, range, mean, and standard deviation.
Hurst exponent introduction.
The HE is an index of series stability [28]. If we think of distorted vowels as “unstable,” we can use the HE to quantify this. An HE closer to 1 indicates more stability, and an HE closer to 0 indicates more distortion. This level of interpretability makes the HE a desirable measure. The traditional approach for extracting the HE is rescaled range analysis (see [28]). This approach involves dividing the signal into small windows, evaluating the deviation from the mean within each window, and calculating the average rescaled range (R/S) across all windows of that size. This process is repeated for windows of larger sizes. The slope of the line fit to the graph of log(average R/S) versus log(window size) is the HE. In general this process expects that within each window the signal is stationary. DFA, described below, is a technique that can be used when stationarity does not hold within each window, and has previously been applied to speech signals [15]. However, as we also describe below, despite potential nonstationarities in small windows, we find that the traditional R/S approach generally produces a linear log-log plot. Thus we also explore the use of this approach to measure speech stability.
Detrended fluctuation analysis.
DFA is a method for estimating the HE from data when nonstationarities are present [29]. The obtained measure is also referred to as DFA. The primary difference between DFA and the R/S approach is that DFA removes trends within each window by fitting and adjusting for low-order polynomials. We extract DFA using Python [30].
Filtered vowel distortion measures.
We propose a set of FVDM that can describe the distortion of vowels within connected speech even when nonstationarities are present. Our pipeline for extracting these measures, which is summarized in Figure 1, first quantifies and corrects for the multiplicative and additive trends causing the nonstationary, and then calculates the HE of the remaining signal using the R/S approach. The main idea is that the trend components removed by DFA may themselves contain relevant information about HD manifestation. As a result, we aim to quantify these trend components, while also using the HE to estimate stability. The proposed pipeline provides three FVDM for each vowel: multiplicative component variance (FVDM-MCV), additive component variance (FVDM-ACV), and vowel stability (FVDM-VS).
Figure 1:
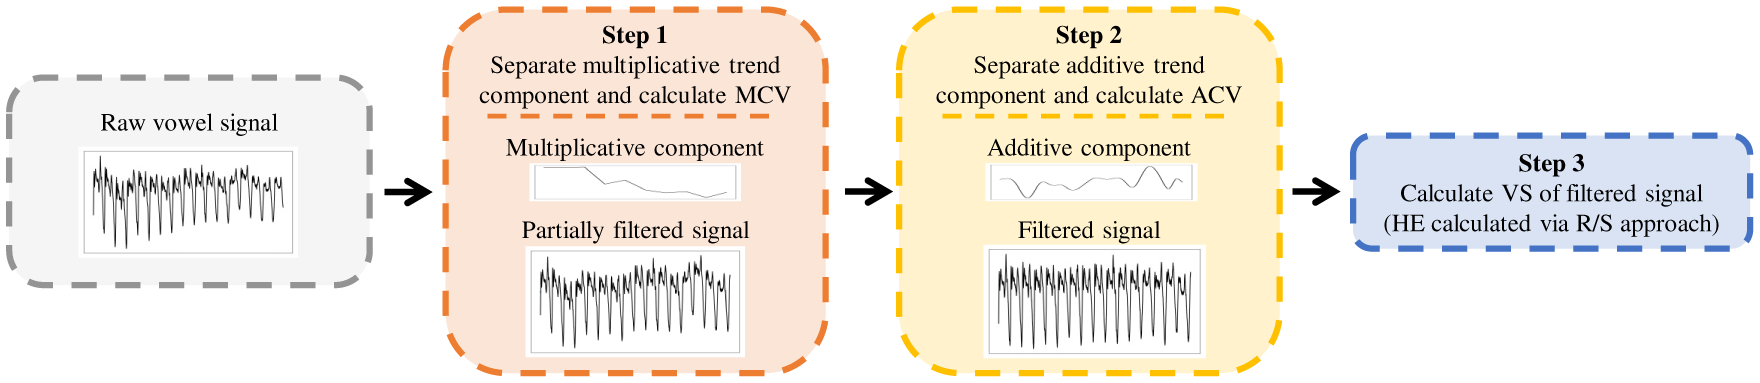
Pipeline for extracting Filtered Vowel Distortion Measures (FVDM). Note: MCV=multiplicative component variance, ACV=additive component variance, VS=vowel stability, HE=hurst exponent, R/S=rescaled range
Step 1:
Removing the multiplicative trend. A multiplicative trend in speech indicates changes in volume. We hypothesize that individuals with manifest HD will have a higher variance in their volume. We address this trend by first calculating the average decibels relative to full scale (dBFS, a measure of amplitude) of the vowel. We then apply a convolutional filter, with a window of 25ms and a shift of 10ms, to calculate the average dBFS within each window. We calculate the variance of these dBFS values and save it as FVDM-MCV. We then correct for this trend by applying the necessary gain or decay to each window so that it matches the average dBFS of the entire vowel.
Step 2:
Removing the additive trend. An additive trend in speech is a potential artifact of coarticulation. We hypothesize that individuals with manifest HD display different patterns of coarticulation, which will be evident in the variance of this trend. We address the additive trend using empirical mode decomposition-based filtering. Wu et al. demonstrated that additive trends could be removed by decomposing the signal into intrinsic mode functions (IMFs) [31]. Certain IMFs will contain signal information, and others will contain trend information. Chatlani et al. provide methods to associate IMFs with each component for voiced sounds, which have distinct IMF properties [32]. They demonstrated how the variance of each IMF component drops after the fourth IMF, and suggest that the first four IMFs contain relevant signal information. Figure 2 illustrates that within our SSV data the first six IMFs have higher variance, after which variance drops. Based on this analysis, we decompose the signal into IMFs [33], sum the first six IMFs to reconstruct the stationary vowel, and sum the remaining IMFs as the additive component. We calculate the variance of this additive component and save it as FVDM-ACV.
Figure 2:
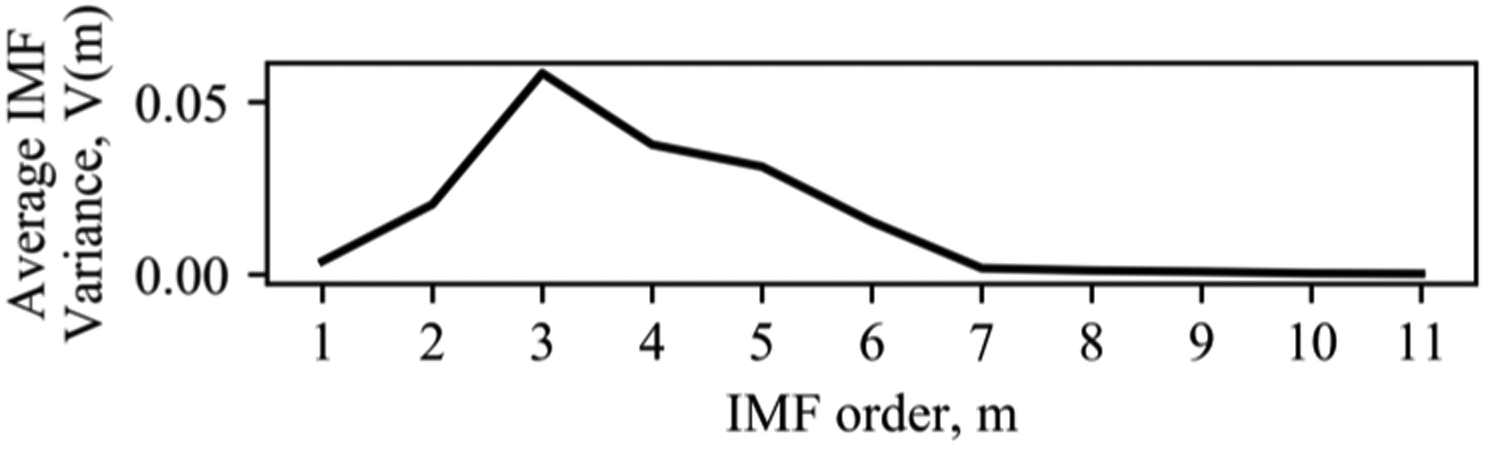
IMF Variance for SSV
Step 3:
Calculating stability. Finally, we explore using the traditional R/S approach to calculate the HE of the filtered signal [30]. Although the filtering process corrects for stationarity across the entire signal and not necessarily within small windows, we find the R/S approach generally produces a linear log-log graph, suggesting we can use the slope of this graph without detrending in the small windows. This gives us FVDM-VS.
5. Results
5.1. Feature correlations across sample types
Table 2 lists the correlations between the vowel distortion measures extracted from each sample type and the manifest labels. For both DFA and FVDM we see that the correlations are highest when measured from GFPV, suggesting that vowel distortion is more pronounced within read speech. We particularly highlight the high correlation of 0.75 between the range of FVDM-VS and the manifest label, suggesting that individuals with manifest HD exhibit a wider range of vowel distortion within speech when compared to premanifest individuals. The correlations for FVDM-ACV are not as strong as hypothesized, but we find a significant negative correlation between the minimum FVDM-ACV and the manifest label, which is consistent with less articulator movement due to disease manifestation. Finally, we find that several statistics over FVDM-MCV are positively correlated with manifest HD, suggesting that individuals with manifest HD exhibit more volume variation within vowels.
Table 2:
Spearman correlation coefficients between vowel distortion features and manifest label for each sample type. Significant correlations (p < 0.05) are in bold.
| Sample | Stat | DFA | FVDM | ||
|---|---|---|---|---|---|
| VS | ACV | MCV | |||
| SV | −0.24 | ||||
| SSV | min | −0.23 | −0.30 | −0.13 | 0.11 |
| med | −0.26 | −0.15 | −0.06 | 0.31 | |
| max | −0.07 | 0.12 | 0.03 | 0.39 | |
| range | 0.22 | 0.37 | 0.21 | 0.33 | |
| mean | −0.20 | −0.17 | −0.06 | 0.35 | |
| std | 0.23 | 0.37 | 0.20 | 0.31 | |
| GFPV | min | −0.63 | −0.69 | −0.41 | 0.04 |
| med | −0.51 | −0.36 | −0.20 | 0.12 | |
| max | −0.19 | 0.00 | −0.14 | 0.47 | |
| range | 0.61 | 0.75 | 0.09 | 0.48 | |
| mean | −0.43 | −0.46 | −0.20 | 0.35 | |
| std | 0.58 | 0.71 | −0.06 | 0.47 | |
Note: SV=sustained vowel, SSV=shortened sustained vowels, GFPV=Grandfather Passage vowels, DFA=Detrended fluctuation analysis, FVDM=Filtered vowel distortion measures, VS=Vowel stability, ACV=additive component variance, MCV=multiplicative component variance.
5.2. Classifying manifest HD
We explore the feasibility of detecting HD manifestation from speech by training a logistic regression model to predict if a speaker has premanifest or manifest HD. We train the model using a leave-one-subject-out paradigm. Our baseline feature set includes the features from [10] and we augment this set with DFA and FVDM. We use DFA and FVDM extracted from the GFPV samples because the baseline features were extracted from the GFP, and this provides the most insight into how to passively predict manifestation from connected speech. We perform z-score normalization on each of the features. We use three-fold cross-validation over the training data to choose the number of features (5, 10 or 15, selected using maximal relevance minimum redundancy (mRMR) [34]) and the inverse regularization parameter (0.1 or 1). Table 3 lists classification accuracies averaged over 10 random initializations of the model.
Table 3:
Accuracy in classifying premanifest vs manifest HD: mean and std across all subjects and 10 model initializations
| Features | Classification Accuracy |
|---|---|
| Baseline | 0.63 ± 0.04 |
| Baseline+DFA | 0.68 ± 0.04 |
| Baseline+FVDM | 0.80 ± 0.03 |
While DFA improves baseline classification, FVDM provide a greater improvement. Table 4 illustrates how the Baseline+FVDM model classifies late-stage manifest with high accuracy, but has more difficulty differentiating between premanifest and early-stage manifest.
Table 4:
Confusion matrix from Baseline+FVDM manifest HD classification experiment. Rows=label, columns=prediction.
| Premanifest | Manifest | |
|---|---|---|
| Premanifest | 0.81 | 0.19 |
| Early-stage manifest | 0.30 | 0.70 |
| Late-stage manifest | 0.03 | 0.97 |
Further analysis into the Baseline+FVDM model shows that mRMR selects FVDM-VS range and standard deviation for each training fold. The learned β parameters for FVDM-VS range and standard deviation are significant for 65% and 58% of training folds, respectively. We also confirm that these β parameters are interpretable. The positive β parameters illustrate that individuals with manifest HD exhibit a higher range of vowel distortion within speech compared to individuals with premanifest HD (β = 0.62 ± 0.30 for range and β = 0.42 ± 0.13 for standard deviation). While Table 2 demonstrates that other statistics over FVDM-VS and some statistics over FVDM-MCV and FVDM-ACV are correlated with the manifest label, mRMR only includes these features in a small number of cases.
FVDM provide information that is supplementary to existing speech features, and improve manifest HD classification accuracy from 63% to 80%. Furthermore, we observe that the relationship between FVDM and HD manifestation is consistent with understandings of vowel distortion within HD [11–13].
6. Conclusions
In this paper we present FVDM, a small and human interpretable feature set. We show that these features can classify HD manifestation with 80% accuracy. These results bring us closer to being able to passively detect HD manifestation.
In future work we will analyze how FVDM compare across different vowels. We will then explore how the FVDM pipeline can be coupled with vowel detection methods to automatically extract FVDM from spontaneous speech (as opposed to read speech). Finally, we will examine the use of FVDM to classify other disorders which present themselves with distorted vowels.
7. Acknowledgements
We thank the Investigators and Coordinators of this study, the study participants, the Huntington Study Group, and the Huntington’s Disease Society of America. This work was supported by the National Institutes of Health (NIH), National Center for Advancing Translational Sciences (UL1TR000433), the Heinz C Prechter Bipolar Research Fund, and the Richard Tam Foundation at the University of Michigan.
Footnotes
Code available at https://github.com/amritkromana/FVDM
8. References
- [1].Vonsattel JPG and DiFiglia M, “Huntington disease,” Journal of neuropathology and experimental neurology, vol. 57, no. 5, p. 369, 1998. [DOI] [PubMed] [Google Scholar]
- [2].Snowden J, Craufurd D, Griffiths H, Thompson J, and Neary D, “Longitudinal evaluation of cognitive disorder in huntington’s disease,” Journal of the International Neuropsychological Society, vol. 7, no. 1, pp. 33–44, 2001. [DOI] [PubMed] [Google Scholar]
- [3].Paulsen JS, Ready R, Hamilton J, Mega M, and Cummings J, “Neuropsychiatric aspects of huntington’s disease,” Journal of Neurology, Neurosurgery & Psychiatry, vol. 71, no. 3, pp. 310–314, 2001. [DOI] [PMC free article] [PubMed] [Google Scholar]
- [4].Long JD, Paulsen JS, Marder K, Zhang Y, Kim J-I, Mills JA, and R. of the PREDICT-HD Huntington’s Study Group, “Tracking motor impairments in the progression of huntington’s disease,” Movement Disorders, vol. 29, no. 3, pp. 311–319, 2014. [DOI] [PMC free article] [PubMed] [Google Scholar]
- [5].Duyao M, Ambrose C, Myers R, Novelletto A, Persichetti F, Frontali M, Folstein S, Ross C, Franz M, Abbott M et al. , “Trinucleotide repeat length instability and age of onset in huntington’s disease,” Nature genetics, vol. 4, no. 4, pp. 387–392, 1993. [DOI] [PubMed] [Google Scholar]
- [6].Kabelac Z, Tarolli CG, Snyder C, Feldman B, Glidden A, Hsu C-Y, Hristov R, Dorsey ER, and Katabi D, “Passive monitoring at home: A pilot study in parkinson disease,” Digital Biomarkers, vol. 3, no. 1, pp. 22–30, 2019. [DOI] [PMC free article] [PubMed] [Google Scholar]
- [7].Kaploun LR, Saxman JH, Wasserman P, and Marder K, “Acoustic analysis of voice and speech characteristics in pre-symptomatic gene carriers of huntington’s disease: biomarkers for preclinical sign onset?” Journal of Medical Speech-Language Pathology, vol. 19, no. 2, pp. 49–65, 2011. [Google Scholar]
- [8].Vogel AP, Shirbin C, Churchyard AJ, and Stout JC, “Speech acoustic markers of early stage and prodromal huntington’s disease: a marker of disease onset?” Neuropsychologia, vol. 50, no. 14, pp. 3273–3278, 2012. [DOI] [PubMed] [Google Scholar]
- [9].Hinzen W, Rosselló J, Morey C, Camara E, Garcia-Gorro C, Salvador R, and de Diego-Balaguer R, “A systematic linguistic profile of spontaneous narrative speech in pre-symptomatic and early stage huntington’s disease,” Cortex, vol. 100, pp. 71–83, 2018. [DOI] [PMC free article] [PubMed] [Google Scholar]
- [10].Perez M, Jin W, Le D, Carlozzi N, Dayalu P, Roberts A, and Provost EM, “Classification of huntington disease using acoustic and lexical features.” in Interspeech, 2018, pp. 1898–1902. [DOI] [PMC free article] [PubMed] [Google Scholar]
- [11].Darley FL, Aronson AE, and Brown JR, “Differential diagnostic patterns of dysarthria,” Journal of speech and hearing research, vol. 12, no. 2, pp. 246–269, 1969. [DOI] [PubMed] [Google Scholar]
- [12].Hartelius L, Carlstedt A, Ytterberg M, Lillvik M, and Laakso K, “Speech disorders in mild and moderate huntington disease: Results of dysarthria assessments of 19 individuals,” Journal of Medical Speech-Language Pathology, vol. 11, no. 1, pp. 1–15, 2003. [Google Scholar]
- [13].Diehl SK, Mefferd AS, Lin Y-C, Sellers J, McDonell KE, de Riesthal M, and Claassen DO, “Motor speech patterns in huntington disease,” Neurology, vol. 93, no. 22, pp. e2042–e2052, 2019. [DOI] [PMC free article] [PubMed] [Google Scholar]
- [14].Elemetrics K, “Disordered voice database,” 1994.
- [15].Little MA, McSharry PE, Roberts SJ, Costello DA, and Moroz IM, “Exploiting nonlinear recurrence and fractal scaling properties for voice disorder detection,” Biomedical engineering online, vol. 6, no. 1, p. 23, 2007. [DOI] [PMC free article] [PubMed] [Google Scholar]
- [16].Henríquez P, Alonso JB, Ferrer MA, Travieso CM, Godino-Llorente JI, and Díaz-de María F, “Characterization of healthy and pathological voice through measures based on nonlinear dynamics,” IEEE transactions on audio, speech, and language processing, vol. 17, no. 6, pp. 1186–1195, 2009. [Google Scholar]
- [17].Vaziri G, Almasganj F, and Behroozmand R, “Pathological assessment of patients’ speech signals using nonlinear dynamical analysis,” Computers in biology and medicine, vol. 40, no. 1, pp. 54–63, 2010. [DOI] [PubMed] [Google Scholar]
- [18].Tsanas A, Little MA, McSharry PE, Spielman J, and Ramig LO, “Novel speech signal processing algorithms for high-accuracy classification of parkinson’s disease,” IEEE transactions on biomedical engineering, vol. 59, no. 5, pp. 1264–1271, 2012. [DOI] [PubMed] [Google Scholar]
- [19].Orozco-Arroyave J, Hönig F, Arias-Londoño J, Vargas-Bonilla J, Daqrouq K, Skodda S, Rusz J, and Nöth E, “Automatic detection of parkinson’s disease in running speech spoken in three different languages,” The Journal of the Acoustical Society of America, vol. 139, no. 1, pp. 481–500, 2016. [DOI] [PubMed] [Google Scholar]
- [20].Satt A, Hoory R, König A, Aalten P, and Robert PH, “Speech-based automatic and robust detection of very early dementia,” in Fifteenth Annual Conference of the International Speech Communication Association, 2014. [Google Scholar]
- [21].König A, Satt A, Sorin A, Hoory R, Toledo-Ronen O, Derreumaux A, Manera V, Verhey F, Aalten P, Robert PH et al. , “Automatic speech analysis for the assessment of patients with predementia and alzheimer’s disease,” Alzheimer’s & Dementia: Diagnosis, Assessment & Disease Monitoring, vol. 1, no. 1, pp. 112–124, 2015. [DOI] [PMC free article] [PubMed] [Google Scholar]
- [22].Zhou L, Fraser KC, and Rudzicz F, “Speech recognition in alzheimer’s disease and in its assessment.” in Interspeech, 2016, pp. 1948–1952. [Google Scholar]
- [23].Hu Z, Schalkwyk J, Barnard E, and Cole R, “Speech recognition using syllable-like units,” in Proceeding of Fourth International Conference on Spoken Language Processing. ICSLP’96, vol. 2 IEEE, 1996, pp. 1117–1120. [Google Scholar]
- [24].Darley FL, Aronson AE, and Brown JR, in Motor speech disorders. W.B. Saunders Company, 1975. [Google Scholar]
- [25].Kieburtz K, Penney JB, Corno P, Ranen N, Shoulson I, Feigin A, Abwender D, Greenarnyre JT, Higgins D, Marshall FJ et al. , “Unified huntington’s disease rating scale: reliability and consistency,” Neurology, vol. 11, no. 2, pp. 136–142, 2001. [Google Scholar]
- [26].Shoulson I, Kurlan R, Rubin AJ, Goldblatt D, Behr J, Miller C, Kennedy J, Bamford KA, Caine ED, Kido DK et al. , “Assessment of functional capacity in neurodegenerative movement disorders: Huntington’s disease as a prototype,” Quantification of neurologic deficit. Boston: Butterworths, pp. 271–283, 1989. [Google Scholar]
- [27].Marder K, Zhao H, Myers R, Cudkowicz M, Kayson E, Kieburtz K, Orme C, Paulsen J, Penney J, Siemers E et al. , “Rate of functional decline in huntington’s disease,” Neurology, vol. 54, no. 2, pp. 452–452, 2000. [DOI] [PubMed] [Google Scholar]
- [28].Mandelbrot BB and Wallis JR, “Robustness of the rescaled range r/s in the measurement of noncyclic long run statistical dependence,” Water resources research, vol. 5, no. 5, pp. 967–988, 1969. [Google Scholar]
- [29].Kantz H and Schreiber T, Nonlinear time series analysis. Cambridge university press, 2004, vol. 7. [Google Scholar]
- [30].Schölzel C, “Nonlinear measures for dynamical systems (nolds),” https://github.com/CSchoel/nolds, 2019.
- [31].Wu Z, Huang NE, Long SR, and Peng C-K, “On the trend, detrending, and variability of nonlinear and nonstationary time series,” Proceedings of the National Academy of Sciences, vol. 104, no. 38, pp. 14 889–14 894, 2007. [DOI] [PMC free article] [PubMed] [Google Scholar]
- [32].Chatlani N and Soraghan JJ, “Emd-based filtering (emdf) of low-frequency noise for speech enhancement,” IEEE Transactions on Audio, Speech, and Language Processing, vol. 20, no. 4, pp. 1158–1166, 2011. [Google Scholar]
- [33].Laszuk D, “Python implementation of empirical mode decomposition algorithm,” http://www.laszukdawid.com/codes, 2017-.
- [34].Peng H, Long F, and Ding C, “Feature selection based on mutual information criteria of max-dependency, max-relevance, and min-redundancy,” IEEE Transactions on pattern analysis and machine intelligence, vol. 27, no. 8, pp. 1226–1238, 2005. [DOI] [PubMed] [Google Scholar]